Analyses of Rainfall Hydrology and Water Resources 720128


 Probable Maximum Precipitation Standard Project Storm Frequency")
 Assumed physical upper limit of rain that will fall over")
 Storm which is reasonably capable of occurring over the basin")


 Precipitation (mm)")

 for a catchment area")


 Analysis Average depth of storm and its duration for a specific area")

- Slides: 34
Analyses of Rainfall Hydrology and Water Resources 720128 Institute of Space Technology September 28, 2017
Mean Rainfall Mean Annual Rainfall: determined by averaging the total rainfall of several consecutive years at a place Mean Monthly Rainfall: by averaging the monthly total rainfall for several consecutive years
Example: Mean Monthly Rainfall
Interception and Net Precipitation Vegetation influence on pattern of deposition and amount of precipitation reaching the soil surface Interception losses are less in arid and semiarid regions that have sparse vegetation Net precipitation is gross precipitation (measured by gauge) minus interception loss Net precipitation is the amount available either to replenish soil water deficits or to become surface, subsurface, or ground water flow.
Effective Rainfall component causing perceptible change in the stream flow That is only a portion of the total rainfall recorded over the catchment Rainfall that does not infiltrate the soil and moves into the stream as overland flow No Overland flow? ?
Index of wetness Ratio of rainfall in a given year and average annual precipitation When it is Less than 1 - bad year/deficient year/ dry year More than 1 – good year / surplus year / wet year Equal to 1 – normal year
Probable Extreme Rainfall Events (Standard Design Storms) Probable Maximum Precipitation Standard Project Storm Frequency based storm Important for water resources engineering
Probable Maximum Precipitation (PMP) Assumed physical upper limit of rain that will fall over a specified area in a given time (that’s physically possible) Rainfall for a given area and duration that can be reached or exceeded under known meteorological conditions Used to provide an estimate of the Probable Maximum Flood (PMF) hydrographs For design of major structure with the threat of loss of life PMP is used (where no risk of failure accepted)
Standard Project Storm (SPS) Storm which is reasonably capable of occurring over the basin under consideration (actually occurred) The heaviest rain storm occurred in the region during the period of rainfall records Used for design project with economic considerations and low risk
Frequency Based Storm Frequency analysis of long term rainfall data
Flood/Storm Frequency Flood frequency: number of times a particular flood/storm can be expected in a river/watershed in a given number of years Example: 100 year flood – a flood that can be expected once in 100 years. (usually worked out by extrapolating the observed data) Frequency is the percentage of years, during which a storm of a given magnitude may be equaled or exceeded Recurrence interval/return period: Time interval after which a similar flood can be forecasted or expected.
Frequency Analysis Objective: to develop a frequency curve Precipitation frequency curves can be developed to evaluate maximum events Used for planning water resources structures Relationship between the magnitude of events and either the associated probability or the recurrence interval Weather systems vary year to year and hence magnitude of future events can not be predicted accurately Have to rely on statistical analyses of rainfall amounts over certain period Frequency distribution of past events Probability or likelihood of having certain events occurring over a specified period is estimated
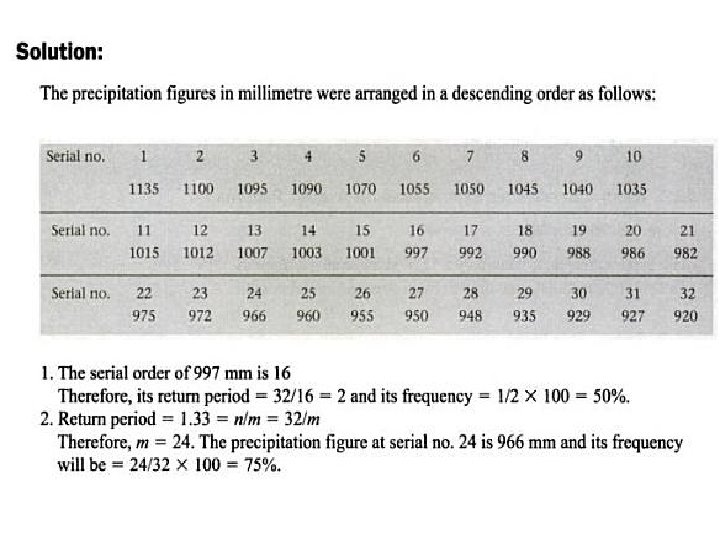
Recurrence Interval of a Storm Number of years within which a given storm may equal or exceed once - Also known as return period Means this precipitation value or more than that occurs m times in n years
Probability of Exceedance The probability of occurrence of a flood (having a recurrence interval T-year) in any year, Probability: Reciprocal of the return period p = 1/ T
Frequency: Probability expressed in terms of percentage Frequency = p * 100 Frequency of a rainfall of a given magnitude = the number of times the given event may be expected to be equaled or exceeded in 100 years If a storm of a specified duration and depth has a 1% frequency in any one year, it has an exceedance probability of 0. 01 and a return period of 100 years
Example:
The probability of having a 24 hr rainfall event of 100 mm or more in any given year is ? about 0. 024 (or a 40 year recurrence interval)
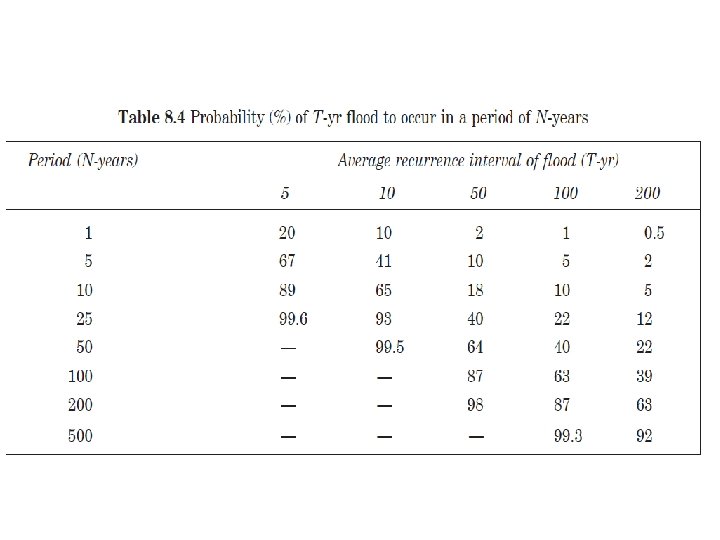
Once the frequency curve is developed, the probability of exceeding certain rainfall amount over a specified period can be determined Even if a flood of a long recurrence interval is chosen, there is always a possibility that the flood can be exceeded more then once during the interval The probability that an event with probability p will be equaled or exceeded x times in N years is determined by: If x=0 (no occurrence in N years) then Prob (no occurrence in N years) = (1 -p)N Therefore; Prob (at least 1 occurrence in N years) = 1 -(1 -p)N Q: the probability of having a 24 hr rainfall event of 100 mm or greater over a 20 year period is?
Solution to example • What is the p for 100 years flood? • Means probability of occurrence in one year = ? • Prob of occurrence of 100 years flood in 100 years?
Intensity Duration Analysis Study of intensity and its duration is called Intensity Duration Analysis Usually most intense storms last for shorter duration As intensity reduces duration increases
Intensity Duration Curve Graph of duration vs. intensity for an area Normally follows the following equation Where; I = intensity in mm/hr t = duration in minutes C, a, b = constants for the specific area
Intensity Duration Curve
Example: A storm occurred over a catchment area as under: Time (min) Precipitation (mm) 0 0 10 19 20 22 30 7 40 20 50 23 60 33 70 28 80 8 90 6 Plot maximum intensity duration curve?
*60/30
Intensity Frequency Duration Analysis When sufficient data (say 50 years) for a catchment area is available Analyze data for each storm Analyze for: q. Intensity q. Frequency q. Duration Different graphs for different catchment areas depending on their hydrologic character
Intensity-Frequency-Duration Curve To know rainfall intensities of different duration and different return period
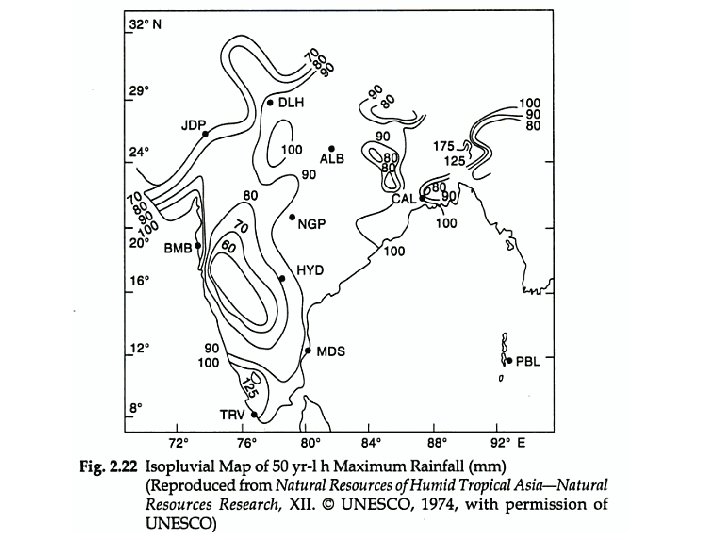
Isopluvial Maps Combined map for large area for maximum rainfall depth for various combination of a return period and duration These are Isohyets shown on regional rainfall map
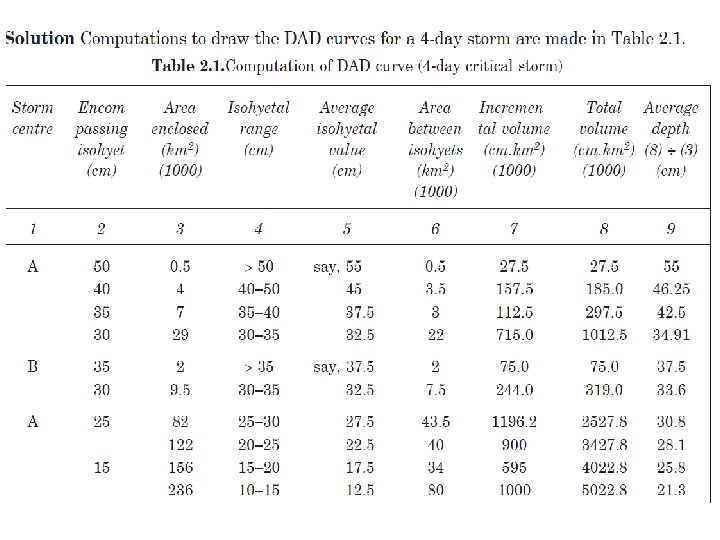
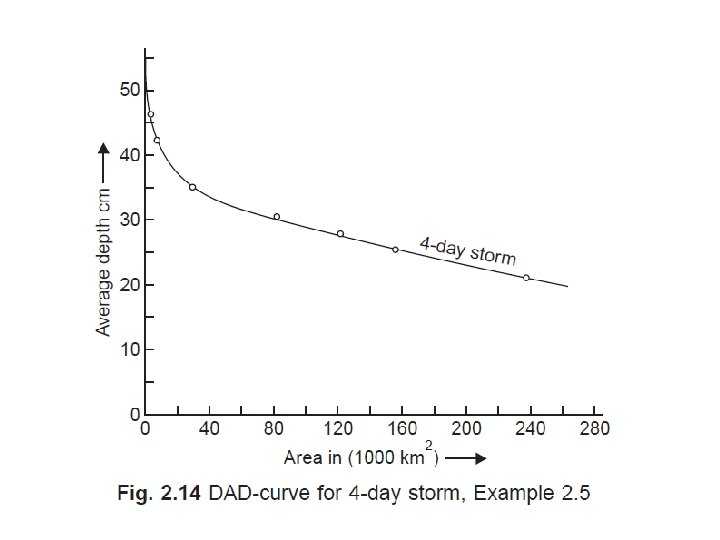
Depth-Area-Duration (DAD) Analysis Average depth of storm and its duration for a specific area Also called DAD study Horton’s Equation Pa =Poe-(KA)^n
DAD Curve Based on records of several storms on an area Maximum areal precipitation for different durations corresponding to different areal extents