Gas Chromatography Inventers Russian MS Tswett 1903 invented


- Slides: 32

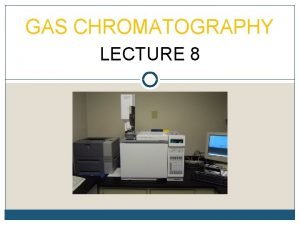
Gas Chromatography

Inventers • Russian MS Tswett (1903) – invented Chromatography • German Fritz Prior (1947) – invented Gas solid chromatography • Archer JP Martin (1950) – invented Gas liquid Chromatography

Gas Chromatography • • • A chromatographic technique for the separation of volatile organic compounds from the mixture. Sample is vaporized, injected onto to the column and transported through the column by a gaseous mobile phase known as “carrier gas” Column itself contains a liquid stationary phase, which is adsorbed on an inert solid surface The compounds are separated based on their differences in their partitioning behavior between mobile gas phase and stationary phase GC is applicable only to volatile substances or compounds made volatile after derivatization

Separation mechanism • Separation occurs by the interaction of compound differentially with the liquid stationary phase and temperature while the mobile phase does not interact with compound. • Separation depends on – Stationary phase type – Stationary film thickness – Column inner diameter and length

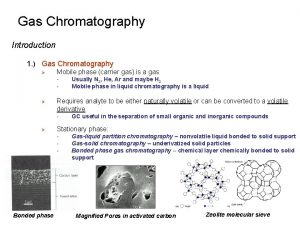
Two techniques • Gas-Solid Chromatography (GSC) – Has a solid stationary phase that physically adsorbs the compounds leading to their retention on the column – Has a limited use due to long retention of active or polar molecules and severe tailing of elution peaks – Real application is for specific low MW compounds • Gas-Liquid Chromatography (GLC) – Has a thin layer of a liquid stationary phase immobilised inside the column and the compounds partition between the gaseous mobile phase and the liquid phase. – Widely adopted method and is now known as Gas Chromatography (GC)

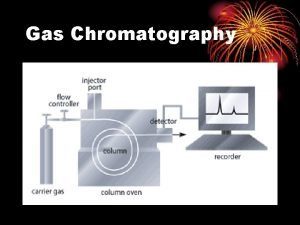
Schematic diagram of Gas Chromatography Data system Syringe Injector Filters Controller Regulators Carrier gas Detector Amplifier Column Thermostat oven

Carrier gas • Common gases are nitrogen, hydrogen, helium, argon, and carbon dioxide • Carrier gas properties – Chemically inert – High purity – Filters to remove water, hydrocarbons – Constant flow rate • Carrier gas choice dependent on – Type of detectors eg. FID uses helium

Injector • Injector port is a heated chamber that contains a glass liner into which sample is injected through rubber septum. • Septum prevents bleed components from entering into the column. • Sample is introduced using micro syringe • Always introduce as small volume – Packed columns, 1 to 5 l – Capillary columns, 0. 5 l • Sample vaporizes to form a mixture of carrier gas and vaporized solutes • Maintain injector at a temperature

Split/split less injectors Split mode A portion of mixture passes onto the column and the rest exit through the split outlet Splitter is used to deliver a fraction of injection 1: 50 to 1: 500 Split ratio is controlled by adjusting carrier gas flow through split vent

Flow rate measurement • Flow rate is adjusted or measured by the use of gas bubble flow meter • Hydrogen flow is 45 ml/min • Air flow is 450 ml/min • Carrier N 2 pressure is 20 psi

Columns Two general types of column • Packed column • Capillary or open tubular column Packed columns • Column materials are made of glass, stainless or Teflon • Length of the column is 1. 5 – 10 m • Internal diameter is 2 -4 mm • Support materials are small porous inert particles of uniform spherical shape with 100 -300 μm diameter • Most common materials are diatomaceous earth as well as polymeric materials

Capillary column • Column materials are metal, plastic, glass, fused silica • Two types of support methods Wall-coated open tubular (WCOT) • Consists of a capillary tube whose walls are coated with liquid stationary phase. Support-coated open tubular (SCOT) • Consists of a capillary tube whose inner wall is lined with a thin layer of support material (diatomaceous earth), onto which the liquid stationary phase is adsorbed SCOT columns are less efficient than WCOT columns. Both types are more efficient than packed columns.

TYPES OF COLUMN PACKING

Fused silica open tubular column (FSOT) • They have much thinner walls than glass capillary columns • The strength is given by the polyimide coating • They are flexible and wound into coils • Advantages are more physical strength, flexibility and low reactivity

Stationery phase • Determines the ability of the column to separate components • There are two types of columns : Non-polar and Polar • The selection is based on the following principle: Non-polar column for separation of non-polar analytes Polar columns for separation of polar analytes. • Polarity is determined by the structure of the polymer • Stationery phase have a high column melt temperature and become liquid films on the porous materials and effects the separation.

Non-polar column • Stationary phase is polydimethylene-siloxane • Separation is based on their boiling points and different vapor pressure of the analytes • With the substitution of methylene groups to the stationary phase such as phenyl-or cyanopropyl groups, the polarity of the stationary phase can be increased. • Polysiloxanes columns are referred as OV, SE, XE etc. Polar column • Stationary phase is polyethylene glycols. • Separation is based on the polarity and boiling points of the analytes. • Carbowax column contains polyethylene glycol adepic acid

Polysiloxanes • • Polysiloxanes is the most common stationary phase Most stable, robust and versatile Most of them are 100% methyl substituted When other groups are present, their amount is indicated as the percent of the total number of groups Column Composition Polarity Application PE-1 100% polydimethyl siloxane Non polar Amines, hydrocarbons, pesticides, PCB’s, phenols PE-5 5% diphenyl 95% polydimethyl siloxane Non polar Alkaloids, drugs, FAME’s, halogenated compounds PE-225 50% cyanopropyl phenyl 50% dimethyl siloxane Intermed to Polar FAME’s, alditol acetates, neutral sterols

Polyethylene glycols • • • A widely used stationary phases with "wax“ They have unique separation properties They are not substituted They are less stable and less robust They have lower temperature limits than most polysiloxanes. • They have shorter lifetimes • They are more susceptible to damage upon over heating or exposure to oxygen.

Cross-linked phases Individual polymer chains are linked via covalent bonds Bonded phases Polymers are covalently bonded to surface of tubing • Cross-linked and bonded phases impart enhanced thermal and solvent stability to the stationary phase • Polysiloxanes and polyethylene glycol bonded and cross-linked stationary phases are available • They are also available in non-bonded version • It is better to use a bonded and cross-linked

Cross linked stationery phase

Porous layer open tubular (PLOT) columns • PLOT columns used with Gas solid chromatography • Column materials are styrene, aluminium oxides and molecular sieves • They are adhered to the surface as a thin layer of small porous particles of size <10 um • Particles do the size exclusion and shape selectivity • Separations require sub-ambient temperatures • Separates hydrocarbon and sulfur gases, noble and permanent gases and low boiling point solvents • Some PLOT columns occasionally lose particles of the stationary phase and mass spectrometers are more susceptible

Comparison of two columns efficiencies Parameter Capillary Packed 2 000 – 4 000 500 - 1 000 Sample size (ng) 10 - 75 10 – 1 000000 Relative pressure Low High Relative speed Fast Slow Chemical inertness Best Poorest Flexible column Yes No Efficiency (plates/m)

Oven • The partitioning behavior is dependent on oven temperature • The column is contained in a thermostatcontrolled oven • The optimum column temperature depends on boiling point of the sample. • Two types of programming : Isothermal and gradient • Isothermal : Running at same oven temperature • Gradient: Increasing oven temperature gradually over time • Gradient elution separates high boiling point components with a wide range of boiling points.

Detectors • Detectors detect and quantify the components eluted from the column • Detectors produce response proportional to component that is separated by column Different types of detectors are • Flame ionization detector (FLD) • Electron capture detector (ELD) • Flame photometric detector (FPD) • Thermal conductivity detector (TCD)

Characteristics of a “good” detector • • Sensitivity appropriate to sample Large linear dynamic range Useful at a range of temperatures Rapid response time Easy to use Stable, predictable response Nondestructive

Types of detectors, applications and detection limits

Flame Ionization Detector Components from the column are mixed with hydrogen and air, and ignited. The organic compounds burning in the flame produce ions and electrons which can conduct electricity through the flame. A large electrical potential is applied at the burner tip, and a collector electrode is located above the flame measures the resultant current. • It is mass sensitive rather than concentration sensitive • It is a universal detector for the analysis of organic compounds • It is less sensitive for non-hydrocarbon groups and insensitive to H 2 O, CO 2, SO 2 and other non combustibles • It has high sensitivity, large linear response range, low noise. • It is robust and easy to use, but unfortunately, destructive

Thermal Conductivity Detector (TCD) • An element is electrically heated at constant power • The temperature depends on thermal conductivity of surrounding gas • Then, measure the conductivity or resistance with respect to a “reference” • Hydrogen and helium carrier gas provide best sensitivity • Poorer sensitivity than FID • Non-destructive

Electron Capture Detector (ECD) • Carrier gas passes over βemitter (Nickel -63), resulting in ionization and electron production. This produces a current between electrodes. In the presence of halogens, electrons are captured, causing decrease in current • This is most commonly used for halogenated organics (insecticides) and highly sensitive Nickel-63 source emits energetic electrons that collide with N 2 to produce more electrons:

Flame photometric detector • Selectively detects phosphorus and sulphur compounds • Two flame tips are used. Initially the gas effluents mix with a large excess of H 2 and burns in the first flame tip producing simpler compounds of S and P. • These compounds with an excess of H 2 then burns at the second flame tip, where S compounds produce a blue flame and P compounds produce green flame • The colour intensity is proportional to the amount of material in the effluent. • The flame intensities are measured through appropriate filter (530 for P and 365 for S) in a photomultiplier and the output is fed to a

Amplifier and Integrator • Amplifier receives an output from a detector and amplifies it so that the signal can be detected by a recorder or integrator. • Integrator takes signal from amplifier and produces an output (chromatogram) and peak height or area used for quantification.

Identification of components is based on the retention time. The retention time is defined as the time measured from the start of injection to the peak maximum. The retention time is characteristic for each compound.
 Famous inventors from ohio
 Gc principle
 Mikhail s. tswett
 Partition column chromatography
 M.s. tswett and the invention of chromatography
 Everything that can be invented has been invented
 Everything has been invented
 Paper chromatography principle
 Who invented thin layer chromatography
 George orwell 1903
 Srbija od 1903 do 1914
 Ugir 1903
 Batas sa rekonsentrasyon ng 1903
 Kulturhistoriske perioder
 Herbert spencer 1820 a 1903
 Frederick winslow taylor la direzione di stabilimento
 Who is considered as the father of scientific management
 Permanent gases
 Van deemter equation explained
 Gas chromatography
 Gas chromatography theory
 Percent composition gas chromatography
 Www.youtube.com
 Gradient vs isocratic elution
 Gas chromatography
 Stationary phase in gas chromatography
 Introduction of gas chromatography
 Basic principle of gc
 Basic gas chromatography
 Kation ditunjukkan oleh
 Application of glc
 Gas liquid chromatography
 Mikhail tswett

