Gas Chromatography Invention of Chromatography Mikhail Tswett invented


 Tswett named this new technique")


 t. R wb t.")

 v")
 Sample Injector:")


 Gas Supply: propane")

 Pipet *Do not leave")


 Check that leads are not shorted inside straw.")

 R (Ω) 350 Ω (bright) Brightness")
. 2. Overfill syringe")


 A.")
 1 -flow regulator (buret valve)")
 teaspoons plastic funnels fiberfill (looks")

- Slides: 39
Gas Chromatography
Invention of Chromatography Mikhail Tswett invented chromatography in 1901 during his research on plant pigments. He used the technique to separate various plant pigments such as chlorophylls, xanthophylls and carotenoids. Mikhail Tswett Russian Botanist (1872 -1919)
Original Chromatography Experiment Start: A glass column is filled with powdered limestone (Ca. CO 3). An Et. OH extract of leaf pigments is applied to the top of the column. Et. OH is used to flush the pigments down the column. Later End: A series of colored bands is seen to form, corresponding to the different pigments in the original plant extract. These bands were later determined to be chlorophylls, xanthophylls and carotenoids.
Chromatography: (Greek = chroma “color” and graphein “writing” ) Tswett named this new technique chromatography based on the fact that it separated the components of a solution by color. Common Types of Chromatography Tswett’s technique is based on Liquid Chromatography. There are now several common chromatographic methods. These include: Paper Chromatography Thin Layer Chromatography (TLC) Liquid Chromatography (LC) High Pressure Liquid Chromatography (HPLC) Ion Chromatography Gas Chromatography (GC)
Paper and Thin Layer Chromatography The solvent moves up paper by capillary action, carrying mixture components at different rates. solvent front Later solvent
How Does Chromatography Work? In all chromatographic separations, the sample is transported in a mobile phase. The mobile phase can be a gas, a liquid, or a supercritical fluid. The mobile phase is then forced through a stationary phase held in a column or on a solid surface. The stationary phase needs to be something that does not react with the mobile phase or the sample. The sample then has the opportunity to interact with the stationary phase as it moves past it. Samples that interact greatly, then appear to move more slowly. Samples that interact weakly, then appear to move more quickly. Because of this difference in rates, the samples can then be separated into their components.
Chromatography is based on a physical equilibrium that results when a solute is transferred between the mobile and a stationary phase. K = distribution A A A Cross Section of Equilibrium in a column. “A” are adsorbed to the stationary phase. “A” are traveling in the mobile phase. coefficient or partition ratio K = CS CM Where CS is the molar concentration of the solute in the stationary phase and CM is the molar concentration in the mobile phase.
In a chromatography column, flowing gas or liquid continuously replaces saturated mobile phase and results in movement of A through the column. Flow Column is packed with particulate stationary phase. As a material travels through the column, it assumes a Gaussian concentration profile as it distributes between the stationary packing phase and the flowing mobile gas or liquid carrier phase.
In a mixture, each component has a different distribution coefficient, and thus spends a different amount of time absorbed on the solid packing phase vs being carried along with the flowing gas Flow More volatile materials are carried through the column more rapidly than less volatile materials, which results in a separation.
If a detector is used to determine when the components elute from the column, a series of Gaussian peaks are obtained, one for each component in the mixture that was separated by the column. Note: The first two components were not completely separated. Peaks in general tend to become shorter and wider with time.
The Theoretical Plate Theoretical plate is a term coined by Martin & Synge. It is based on a study in which they imagined that chromatographic columns were analogous to distillation columns and made up or numerous discrete but connected narrow layers or plates. Movement of the solute down the column then could be treated as a stepwise transfer. Theoretical plates (N) measure how efficiently a column can separate a mixture into its components. This efficiency is based on the retention time of the components and the width of the peaks.
N = Number of theoretical plates (a measure of efficiency) t. R wb t. R is the retention time; it is measured from the injection peak (or zero) to the intersection of the tangents. wb is the width of the base of the triangle; it is measured at the intersection of the tangents with the baseline.
t. R wb Larger N wb Smaller N When the retention time, t. R, is held constant, the column that produces peaks with narrower bases, wb, will be more efficient – have a greater N value. Likewise a column that produces wider peaks will be less efficient – have a smaller N value. This is because a smaller denominator, wb, will yield a larger overall number and a larger denominator will yield a smaller number.
Gas Chromatography v Good for volatile samples (up to about 250 o. C) v 0. 1 -1. 0 microliter of liquid or 1 -10 ml vapor v Can detect <1 ppm with certain detectors v Can be easily automated for injection and data analysis
Components of a Gas Chromatograph Gas Supply: (usually N 2 or He) Sample Injector: (syringe / septum) Column: 1/8” or 1/4” x 6 -50’ tubing packed with small uniform size, inert support coated with thin film of nonvolatile liquid Detector: TC - thermal conductivity FID - flame ionization detector
Schematic of a Commercial Gas Chromatograph
HP 5890 Capillary Gas Chromatograph with Robotic Sample Injector and Data Station
Our GC System (Limited to volatile chlorine containing organic compounds. ) Gas Supply: propane line gas Injector: 0. 3 ml of vapor through latex tubing Column: 5 ml pipet filled with Tide detergent Detector: based on Beilstein reaction of chlorinated hydrocarbons with hot Cu metal to give bright blue/green flame coloration.
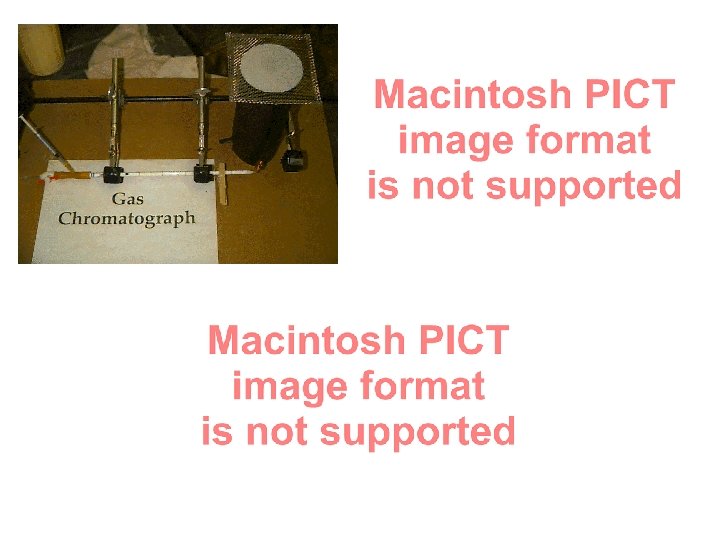
GC Construction Ring Stand TOP Cd. S Photocell mounted in Straw/Stopper bracket Clamps 5 ml pipet Packed with Tide 1 ml Syringe Attach leads to computer Black paper cylinder SIDE Buret Valve Latex coupling Gas inlet Fiber plugs Align photocell with midpt. of flame Cu coil
Wrapping the detector coil (Detail of Cu coil winding. ) Pipet *Do not leave any gaps between turns. 1. Hold here with thumb while winding 18 -20 turns around the pipet. Do NOT use the Coil Adjusting Tool for this step. 2. Bend so mounting post is centered in coil using the Coil Adjusting Tool** Side View End View Do NOT try to adjust coil in pipet tip! **Coil Adjusting Tools are located in the Hood. (Please return them to the Hood as soon as your are finished with them. )
Filling the Column 1. Add about 1 tsp of dry/sifted Tide to fill pipet within 1/4” of top (Tide has been sifted and dried, so keep lid closed on container. ) 2. Tap column with a pencil to settle the powder. 3. Use a plug of fiberfill to hold Tide in place *Do not compact Tide into column. **Do not leave any dead space at head of column.
Burner Adjustment Parameters Adjustment of height above pipet tip will affect the fuel / air ratio. Length of coil will affect flame stability. For best results, flame should be 1/4” - 3/8” high, non-luminous (blue), and non-flickering.
Detail of Sensor (Cd. S Photoresistor) Check that leads are not shorted inside straw. foam plug face of sensor should be 1/8” back from end of straw Straw covered with electrical tape Note: The sensor should be tested by connecting to computer and checking voltage in light and with sensor face covered with your finger.
Sensor Alignment Top View Flame Shield Sensor/Stopper Column Flame 1. Remove sensor from stopper and sight through tube. 2. Adjust clamp so that base of flame can be seen. 3. Carefully replace sensor in tube.
Sensor Response Curve 1. 1 M Ω (dark) R (Ω) 350 Ω (bright) Brightness The sensor has the largest change in resistance in the low light region. (Blue flame is best. ) Too much light will ‘saturate’ the sensor. Place wire gauze on top of flame shield to block room light and drafts.
Sample Injection 1. Fill sample vapor only in syringe (NOT liquid!). 2. Overfill syringe then adjust to desired amount. 3. Do not let the sample remain in the syringe long before injecting to avoid vapor loss into the rubber plunger of the syringe. 4. Rotate the syringe when piercing the latex tubing to avoid a pressure surge which may blow out the flame. 5. Inject as close as possible to the column head. 6. Push the plunger fairly rapidly during injection. 7. Chloroform (CHCl 3 ) may require a larger amount than suggested to get adequate sensor response
General Settings for GC Startup program Y axis: 1 -5 v (0 -1 volt is in bright light, 4 -5 volt is dark) X axis: 0 -400 seconds
Plot of GC Elution Data for Dichloromethane and Chloroform On 25 cm Tide Column Good: Peaks are smooth, well separated and elute quickly
Plot of GC Elution Data for Dichloromethane and Chloroform On 25 cm Tide Column Poor: peaks are noisy, due to flickering flame, and elute slowly. To fix: Adjust sensor so that it is looking at the blue portion of the flame. (Verify the flame is blue. )
Printing Elution Curves From File menu in GC program choose Export Data A 1. Give the file a name. 2. Choose text option. 3. Save to desktop. 4. Send it to your email accounts* via minermail using web. * Don’t forget to cc Dr. Bolon bolonc@umr. edu 5. Open file, highlight text, copy and paste to your favorite graphing program (e. g. Excel).
Determination of the Amount of Sample Components Present The peak height is proportional to the amount of material eluting from the column at any given time, The area under the peak is a measure of the total amount of material that has eluted from the column. Electronic integrators are used for area measurement in commercial GCs. We will be using ALGEBRA.
The Gaussian curve can be approximated as triangular in shape, to simplify area measurement. Area = 1/2 wb h h wb NOTE: the height is measured to the top of the tangents, which is above the actual curve peak.
If voltage data is very noisy, resulting in poor peak shape, some peak parameters may be estimated from visual observations, however areas cannot be calculated. So have the TA verify your data before you take apart your GC. retention time peak width Blue Flame Green Flame onset of green Blue Flame end of green
Experiments 1. Test run of CH 2 Cl 2 without sensor check for visible color, reasonable width and retention time on column. 2. Run of Pure Compounds: (1 good run of each) CH 2 Cl 2 (Dichloromethane aka Methylene Chloride) CHCl 3 (Chloroform) 3. Mixture: CH 2 Cl 2: CHCl 3 (2: 3 mix) Collect voltage vs time data and also note visual onset and disappearance of green flame color.
Data and Calculations (There is a separate handout available with this information. ) A. Graphs (3) from computer 1. Elution data for pure CH 2 Cl 2 2. Elution data for pure CHCl 3 3. Elution data for mixture B. Calculations (handwritten, for each graph) 1. Peak Area = 1/2 (W x H) 2. Number of theoretical plates, N = 16 (TR / Wb)2
Checkout 1 -pipet (5 ml graduated, for GC column) 1 -flow regulator (buret valve) 1 -clothespin 1 -pair forceps 1 -1 cc syringe 1 -flame shield (black construction paper cylinder) 1 -sensor/stopper 1 -coil adjusting tool 1 -pc Cu wire (discard after use)
In Hoods: Tide (Replace lid to prevent moisture absorption) teaspoons plastic funnels fiberfill (looks like cotton) CH 2 Cl 2 - dichloromethane or methylene chloride (clear septum vial) CHCl 3 - chloroform (brown septum vial) Notes: Work in groups of four.
Hazards Needles are sharp. Detector coil is hot. Carrier gas is flammable. CH 2 Cl 2 and CHCl 3 are toxic. Waste Empty Tide from columns into solid waste. Do NOT use water to clean column. Stockroom will clean stuck columns. This Week Review Session – November 29, 8: 30 -10: 00 pm in G 3. Next Week (December 3 -6) *Final Exam – 1 -2 Hour Exam during regularly scheduled class time. You will need a calculator. **Checkout after exam. $35 fine for not checking out. (This means NO Chem 2 Final during Finals Week. )