Flu vaccines immunological and clinical data that could

")

 linked to seasonal flu, per groupe age group. Belgium")


type and week")
 of seasonal flu vaccine Canada (2013")


 2009 H 1 N 1 pandemic flu : pregnant woman –")
 Nested case control study 4. 369 pregnant women 15 -44")
 same immunological answer to several other vaccines (tetanos ,")


 Several companies, with • GSK • Sanofi Pasteur leading the")


 Haemagglutination-inhibition (HI) antibody response 600 500 400 300")
1, 2 Symptoms (All) s Symptoms (% sujets) 100 D-QIV")


- Slides: 47
Flu vaccines: immunological and clinical data that could help to choose… Y. Van Laethem MD Chair, Vaccination section High Council of Health
Wat is griep? C’est quoi la grippe ? Hemagglutinine / Hémagglutinine (H of/ou HA) Neuraminidase (N of/ou NA) Verantwoordelijk voor pathogeniciteit van het virus / Responsable de la pathogénicité du virus Laat het virus toe zich aan de epitheelcellen in de luchtwegen te hechten / Permet au virus d'adhérer aux cellules épithéliales des voies respiratoires Verlaagt viscositeit van de slijmlaag in de luchtpijp / Réduit la viscosité de la couche de mucus de la trachée Laat afgifte van de nieuwe virussen toe die gevormd zijn uit geïnfecteerde cellen / Permet la libération des virus formés à partir de cellules infectées M 1 proteïne / Protéine M 1 Een matrix proteïne dat het virale capside vormt / Une protéine de matrice qui forme la capside virale. Ribonucleoproteïne / Ribonucleoprotéine RNA (genetische code) / ARN (code génétique) Nucleoproteïne (NP) / Nucléoprotéine (NP) M 2 proteïne / Protéine M 2 Functioneert als een ion-kanaal/ Fonctionne comme un canal ionique Ruigrok RWH. Structure of influenza A, B and C viruses. In: Nicholson KG, Webster RG, Hay AJ, editors. Textbook of Influenza. Blackwell Science; 1998: 29– 42 2
De griepsymptomen Les symptômes de la grippe 3
Annual hospitalizations (number and rate) linked to seasonal flu, per groupe age group. Belgium (Hanquet G et al, KCE 2013) Groupe d’âge Nombre d’hospitalisations (Variation par an) Taux d’hospitalisation par 100. 000 habitants <5 ans 661 (338 -925) 113. 4 5 -14 ans 348 (208 -489) 28. 7 15 -49 ans 462 (277 -673) 9. 2 50 -64 ans 356 (198 -517) 18. 7 65 -74 ans 386 (137 -785) 40. 8 75 ans + 1043 (345 -2323) 121. 5 3256 31. 0 Total
Seasonal flu +/-1000/1500 deaths/year. . . …more than road accidents…
Map 1: Influenza intensity during the 2013– 14 season, EU/EEA countries, weeks 40/2013– 20/2014
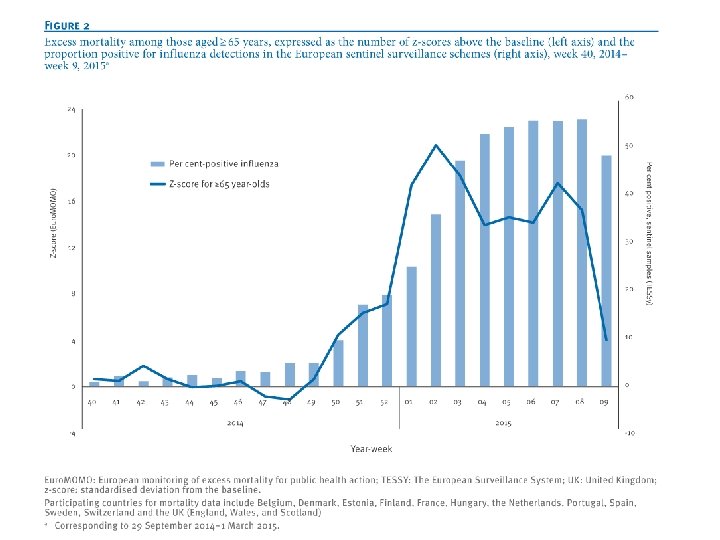
And in 2014 -15 in Europe….
Fig. 1. Number of sentinel specimens positive for influenza virus, by (sub)type and week of specimen collection, weeks 40/2014– 20/2015
Effectiveness ( « real life » ) of seasonal flu vaccine Canada (2013 -2014): 58% on confirmed influenza hospitalizations Spain (2013 -2014) : 35 % à 44% USA (2011 -2012) : 65% (H 1 N 1) 39% (H 3 N 2) 58% (B) in the two countries: on medical care linked to confirmed flu
What about « classic « risk groups? > 65 y Chronic diseases
Figure 1. Reported seasonal influenza vaccination coverage rates in ‘older age groups’ – 09, 2009– 10, 2010– 11 and 2011– 12 influenza seasons), by % (2008
Figure 2. Vaccination coverage rates among clinical risk groups as measured by administrative or survey methods (2008 -09, 2009 -10, 2010 -11 and 2011 -12 influenza seasons) by percentage
Welke dekkingsgraad is aanbevolen/ ? Quel taux de couverture est recommandé /obtenu? 75% 20% 35% ~40% 60% ? ? 18
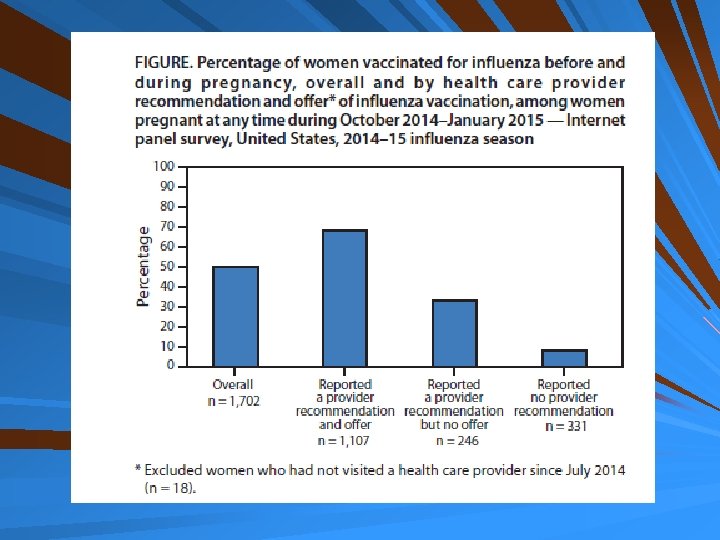
Flu vaccination of pregnant women
Pregnant woman (1) 2009 H 1 N 1 pandemic flu : pregnant woman – 1 - 2% of total population – 7 - 10 % of hospitalized H 1 N 1 patients – 6 - 9% of H 1 N 1 ICU cases – 6 - 10% of H 1 N 1 related deaths N Engl J Med 2010; 362: 1708 -19. Already the same during previous pandemics as 1918 and 1957
Pregnant woman: when? (2) Nested case control study 4. 369 pregnant women 15 -44 Y old >< 21. 845 controls Hospitalization risk(< pneumonia, influenza, cardiopulmonary reasons) or death during flu season – Post partum – 14 -20 w pregnancy – 37 -42 w pregnancy 1 1. 44 4. 67 Am J Epidemiology 1998; 148: 1094
And the pregnant woman (Nearly) same immunological answer to several other vaccines (tetanos , pertussis, hep A, …) No demonstrated fœtal side effect of inactivated vaccines
Cumulative Cases of Laboratory-Proven Influenza in Infants Whose Mothers Received Influenza Vaccine, as Compared with Control Subjects Zaman K et al. N Engl J Med 2008; 359: 1555 -1564
25 Flu viruses and vaccines Pandémie 1968 Pandémie 1957 Pandémie 1918 Influenza A – H 3 N 2 Pandémie 2009 H 2 N 2 Influenza A – H 1 N 1 pdm 09 B-Victoria Influenza B 1920 1930 First isolation of influenza A virus 1940 1950 1960 1970 1980 Bivalent vaccine 1990 2000 2010 Trivalent vaccine (H 3 N 2, H 1 N 1, B) (influenza A & B) First isolation of influenza B virus Monovalent vaccine (influenza A) Mc. Cullers JA, Huber MC. Hum Vaccin Immunother 2012; 8: 34 -44 (adapted). 2012 BE/FLU/0013/15 - April 2015 B-Yamagata
Influenza B • Clinically similar to influenza A If severe ≡ influenza A • +/- 20 -25 % of annual cases since 10 y • Mostly at the end of the season • More frequent / severe (? ) in children • Great variations -seasons - countries
Figure 2. Dominance and co-dominance of sentinel influenza A and B viruses, EU/EEA, 2012– 2013
Circulating flu strains 1997 -2005 Yearly incidence of the disease and of the different strains Mean proportion of annual influenza isolates 1. 0 Hémisphere Nord 2 Hémisphere Sud 1. 0 2 Mean proportion of annual influenza isolates 0. 8 0. 6 0. 4 0. 8 B 0. 6 H 1 N 1 0. 4 H 3 N 2 0. 2 collected for 19 temperate countries in the Northern and Southern hemispheres Global data • Influenza B is more frequent than H 1 N 1, 15% 27% but less than H 3 N 22 • B 68% H 1 N 1 H 3 N 2 1. Brammer TL, et al. Surveillance for influenza – United States, 1994– 95, 1995– 96, and 1996– 97 seasons 2. (Adapted from) Finkelman et al. PLo. S One 2007; 2: e 1296 3. Falcao et al. J Epidemiol Community Health 1998; 52(Suppl 1): 39 S– 42 S; 4. Thompson et al. JAMA 2003; 289: 179– 86 BE/FLU/0013/15(1)- August 2015 0. 0 199719981999200020012002200320042005 Anné Study design 2: analysis of laboratory-confirmed influenza surveillance data by type and subtype (A/H 3 N 2, A/H 1 N 1 and B) from 1997 to 2005. Data were e e 0. 0 9
Yamagata † * 100% * Victoria † * * † 90% 80% 70% 60% 50% 40% VIC YM YM VIC VIC VIC YM YM 30% 20% 10% type souche B Data not available BE/FLU/0013/15(1)- August 2015 Circulating influenza B lineage Discrepancies between planned and real circulating B strain…. 0% 12 *Vaccine mismatch (>60% mismatch); †Partial vaccine mismatch (<80% matched) VIC, Victoria lineage; YM, Yamagata lineage References: (Adapted from) Ambrose & Levin. Hum Vaccin Immunother 2012; 8: 81– 88; ECDC Seasonal influenza 2011 -2012 in Europe available at http: //ecdc. europa. eu (accessed Sept 2012) - Saison 2012/2013: ECDC RTI Annual Epid. Report(2014); Saison 2013/2014: ECDC ERLI (Sept. 2014)
Quadrivalent flu vaccines (QIV) Several companies, with • GSK • Sanofi Pasteur leading the research/ clinical trials
What about quadrivalent vaccines…? That means: with the two B strains Only Rix Tetra in 2015 and 2016
RIX TETRA: IMMUNOMOGICAL AND SAFETY DATA
Data in adults (≥ 18 y) Haemagglutination-inhibition (HI) antibody response 600 500 400 300 200 0 TIV (Vic) TIV (Yam) PI(D 21) POST PRE POST H 1 N 1 H 3 N 2 B-Victoria B-Yamagata Per protocol immunogenicity cohort: D-QIV n=1809, TIV-Vic n=608, TIV-Yam n=534 Day 0 (PRE) and Day 21 (POST). PRE (Adapted from) Kieninger D et al. BMC Infect Dis 2013; 13: 343. Per protocol immunogenicity cohort: D-QIV n=1809, TIV-Vic n=608, TIV-Yam n=534 Geometric mean titres at Day 0 (PRE) and Day 21 (POST). BE/FLU/0013/15(1)- August 2015 100 D-QIV Geometric mean titres (95% CI) 700
Safety: adults (≥ 18 y)1, 2 Symptoms (All) s Symptoms (% sujets) 100 D-QIV TIV (Vic) TIV (Yam) 90 80 70 60 Durant 7 j postvaccination 50 30 20 10 Grade 3 T Grade 3 T All symptoms Systemic symptoms Local symptoms 0 1. (Adapted from) Kieninger D et al. BMC Infect Dis 2013; 13: 343; 2. GSK Data on File 2013, Clinical Study Report 114269 (FLU D-QIV-008). BE/FLU/0013/15(1)- August 2015 40
Modeling of public health and economic impact of TIV versus QIV • Several models for USA Canada Europe France UK Finland…. • show a positive impact….
36
Griepseizoen 2016: de balans Saison de la grippe 2016 : le bilan
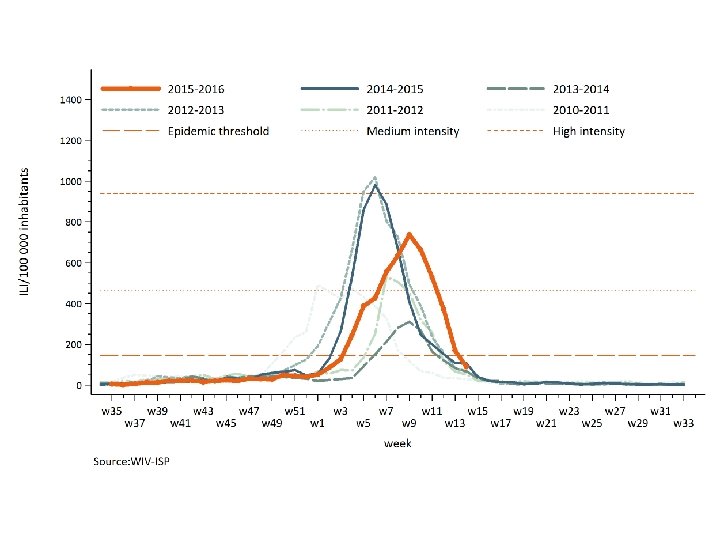
Seizoen 2015 - 2016 Saison 2015 - 2016 Piek in de weken 9 - 10 Le picque dans les semaines 9 - 10 38
Aantal vaccinaties Nombre de vaccinations • Het aantal vaccinaties is stabiel gebleven in 2015/2016: 2 à 2, 5 miljoen mensen lieten zich vaccineren • Het aantal vaccinaties was in dalende lijn sinds 2009 (KCE). • De griepvaccinatie van 65 -plussers is de voorbije 5 jaar constant gedaald en ligt nu op een dekkingsgraad van 56% (2013). Een uitzondering hierop is de vaccinatie van ouderen in de residentiële sector, waar de dekkingsgraad op 82. 2% ligt. De daling is meer uitgesproken in Wallonië en Brussel en werd ook vastgesteld in andere Europese landen (KCE). • Le taux de vaccination est resté stable pour la saison 2015 -2016 : 2 à 2, 5 millions de personnes se sont fait vacciner • Le nombre de vaccinations était en baisse depuis 2009 (KCE). • La vaccination antigrippale pour les personnes de plus de 65 ans a diminué de façon constante au cours des cinq dernières années et a maintenant un taux de couverture de 56% (2013). La vaccination des personnes âgées en résidence est à hauteur de 82, 2%. La baisse fut plus prononcée en Wallonie et à Bruxelles et a également été constatée dans d'autres pays européens (KCE). 39
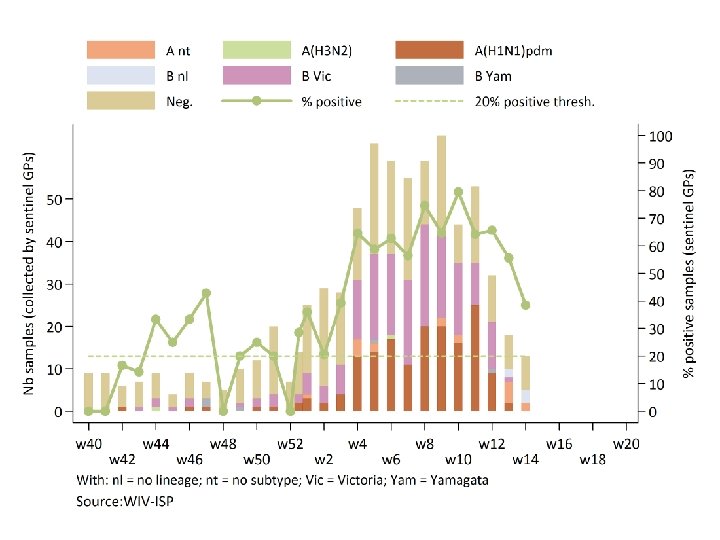
2015 -2016 Few H 3 N 2 Mostly: • H 1 N 1 • B, with Victoria >> Yamagata And Yamagata in the TIV….
De buurlanden Les pays voisins en 2014 -15 41
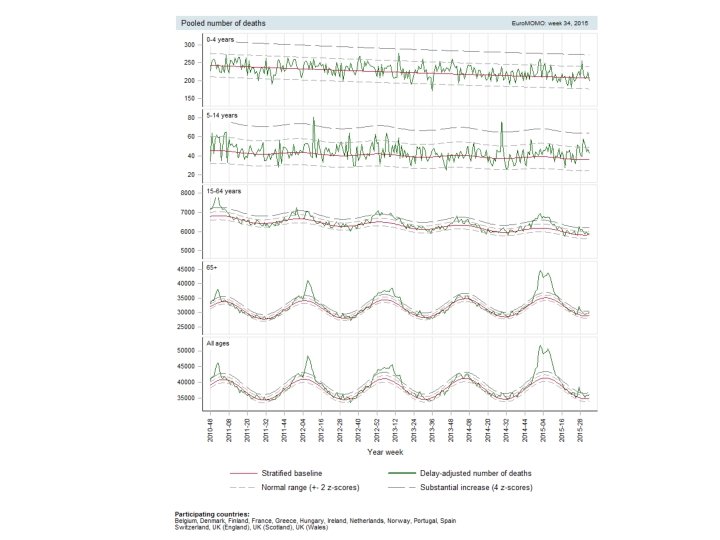
Sterfte in Europa Mortalité en Europe Laatste seizoen Saison dernière Bron: http: //www. euromomo. eu/index. html 42
Sterfte: vergelijking België / Frankrijk Mortalité : comparaison Belgique / France TIV: 46% QIV: 54% TIV: 100% QIV: 0%* TIV, trivalent inactivated vaccine; QIV, quadrivalent inactivated vaccine Laatste seizoen Saison dernière Bron: http: //www. euromomo. eu/index. h ml 43
De griepvaccins Les vaccins contre la grippe 2016 -17 WHO Recommendation for NH season 2016 -2017*: A/H 1 N 1/California TIV A/H 3 N 2/Hong Kong B/Brisbane QI V • • B/Phuket Geen WHO voorkeursaanbeveling voor het gebruik van TIV of QIV. Maar elk jaar wordt een nieuwe compositie aanbevolen voor de stammen ter productie van TIV en QIVs. Aucune recommandation préférentielle WHO pour l'utilisation de TIV ou QIV. Mais il y a chaque année une nouvelle recommandation de la composition pour lesla souches à utiliser lors de la production de TIV et QIV. a. WHO 2016– 2017 recommendations for the Northern Hemisphere; WHO, World Health Organization TIV, trivalent inactivated vaccine; QIV, quadrivalent inactivated vaccine 44
Leading to the 2016 -17 HCH recommendations….
La saison grippale 2015 -2016, malgré une inadéquation du choix de la souche B dans le vaccin trivalent concomitante à une prévalence importante de cette souche (50 % des cas avérés de grippe - https: //influenza. wivisp. be/fr/Documents/Influenza_2016_22. pdf, page 4), n’a pas montré de surmortalité saisonnière en Belgique. Cette observation de l’Institut Scientifique de Santé Publique (ISP) est confirmée par les données des pays limitrophes (http: //www. euromomo. eu/). Par ailleurs, il n’existe pas encore d’évidence montrant que les vaccins quadrivalents amènent un bénéfice supérieur aux vaccins trivalents en terme de prévention de la morbidité.
Le vaccin quadrivalent pourrait cependant apporter un bénéfice en terme de morbidité tout spécialement chez l’enfant, ainsi que chez la femme enceinte (effet indirect pour le nouveau-né), en cas d’un choix inadéquat de la souche B dans le vaccin trivalent. En effet, dans cette situation, le taux d'attaque de la souche B est plus élevé chez l’enfant (Glezen et al. , 2013). En conclusion, le CSS tient à souligner l’importance de renforcer cette vaccination du point de vue de la santé publique et ce indépendamment des particularités / avantages potentiels du vaccin choisi. Toutefois, le vaccin quadrivalent (enregistré pour toute personne âgée de 3 ans ou plus) parait le plus adéquat dans la population des femmes enceintes et des enfants à risque de plus de 3 ans.