Fig 10 CO p 264 Fig 10 1
- Slides: 83
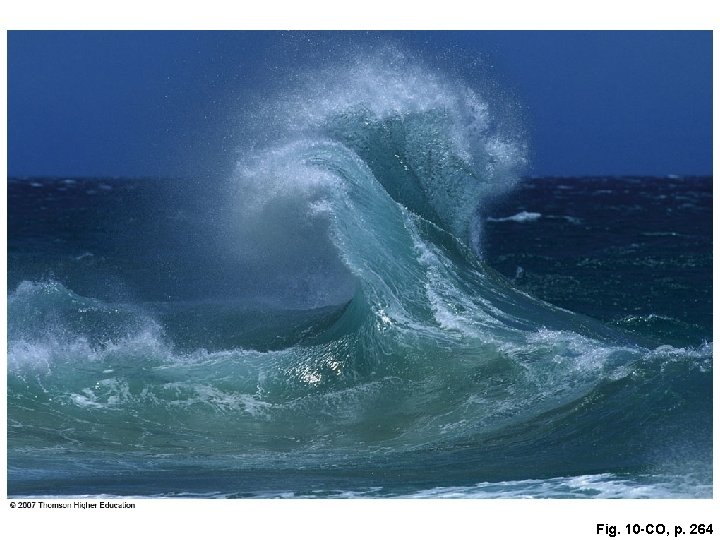
Fig. 10 -CO, p. 264
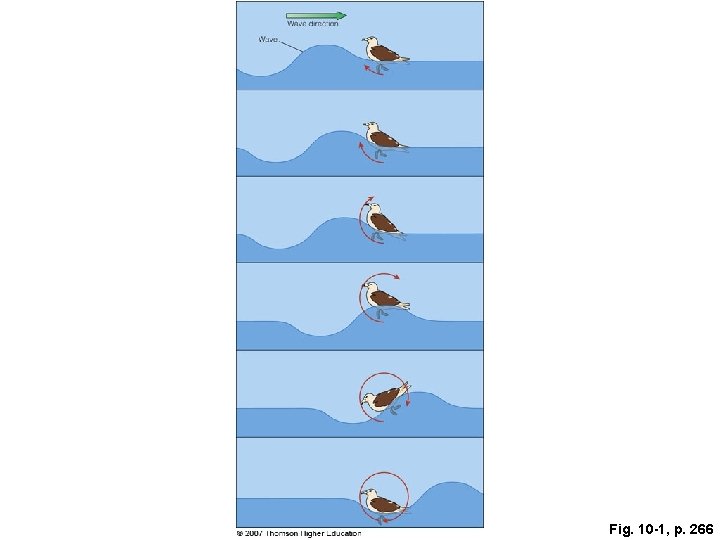
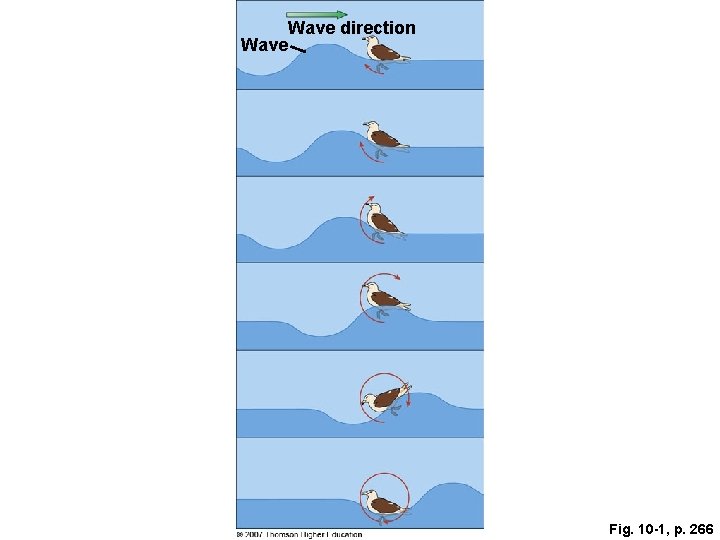
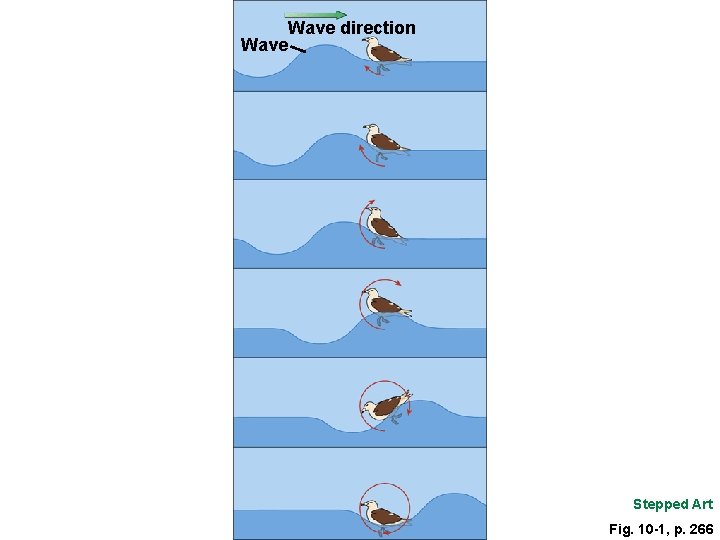
Fig. 10 -1, p. 266
Wave direction Wave Fig. 10 -1, p. 266
Wave direction Wave Stepped Art Fig. 10 -1, p. 266
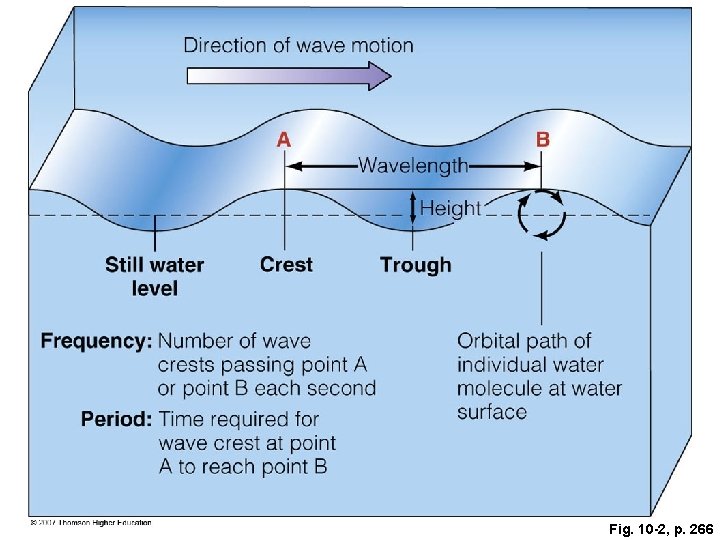
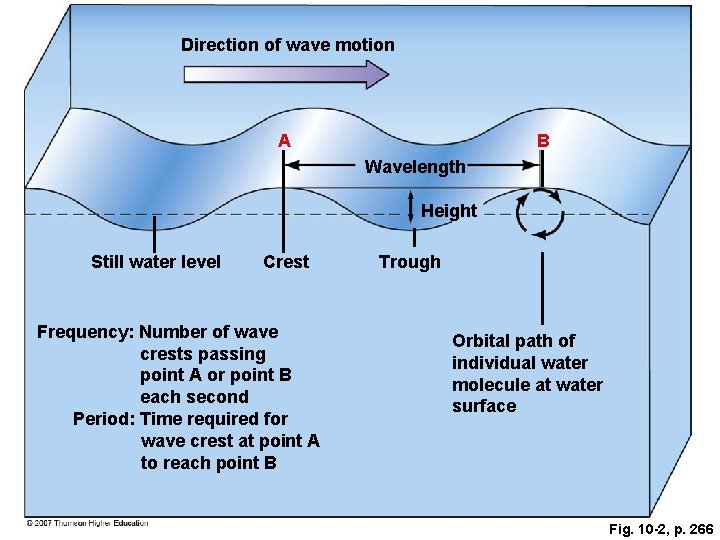
Fig. 10 -2, p. 266
Direction of wave motion A B Wavelength Height Still water level Crest Frequency: Number of wave crests passing point A or point B each second Period: Time required for wave crest at point A to reach point B Trough Orbital path of individual water molecule at water surface Fig. 10 -2, p. 266
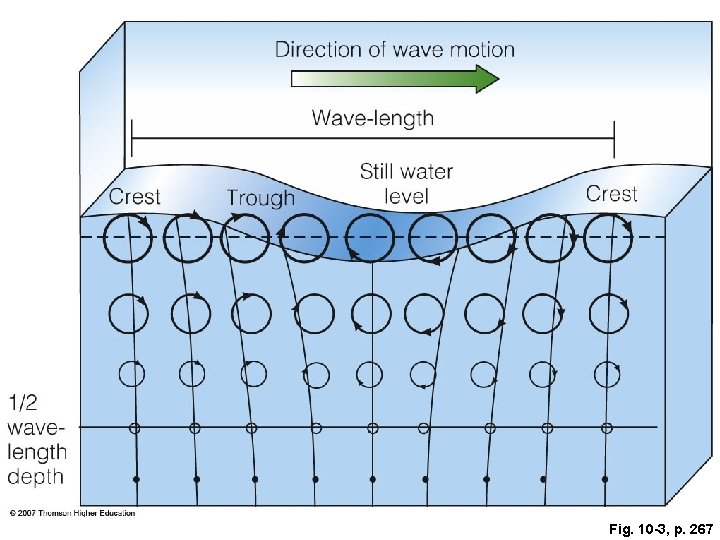
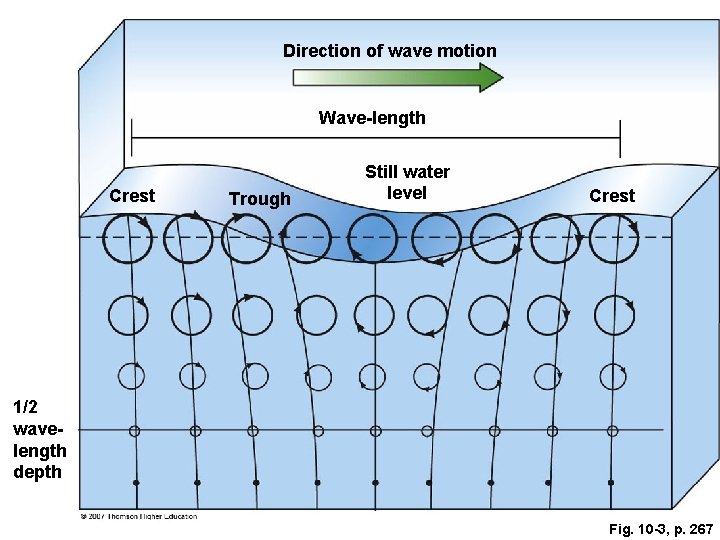
Fig. 10 -3, p. 267
Direction of wave motion Wave-length Crest Trough Still water level Crest 1/2 wavelength depth Fig. 10 -3, p. 267
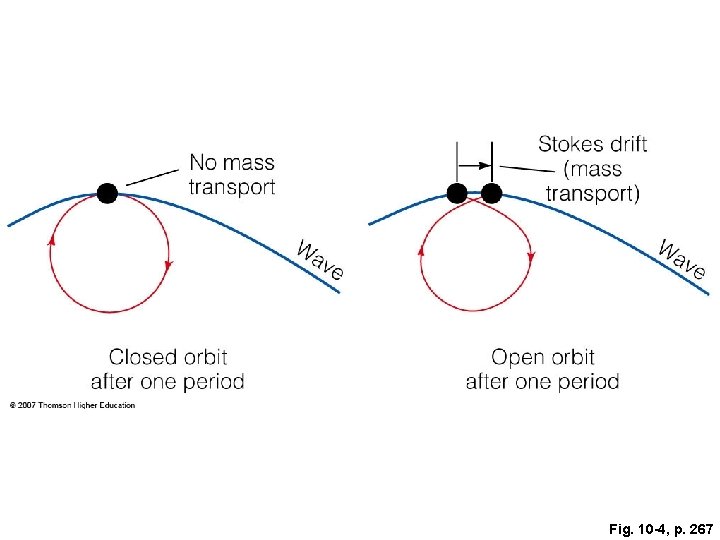
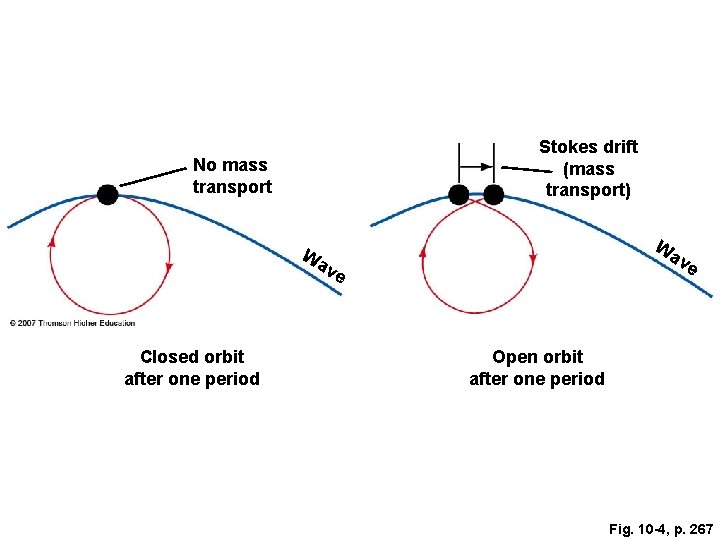
Fig. 10 -4, p. 267
Stokes drift (mass transport) No mass transport W Wa av e ve Closed orbit after one period Open orbit after one period Fig. 10 -4, p. 267
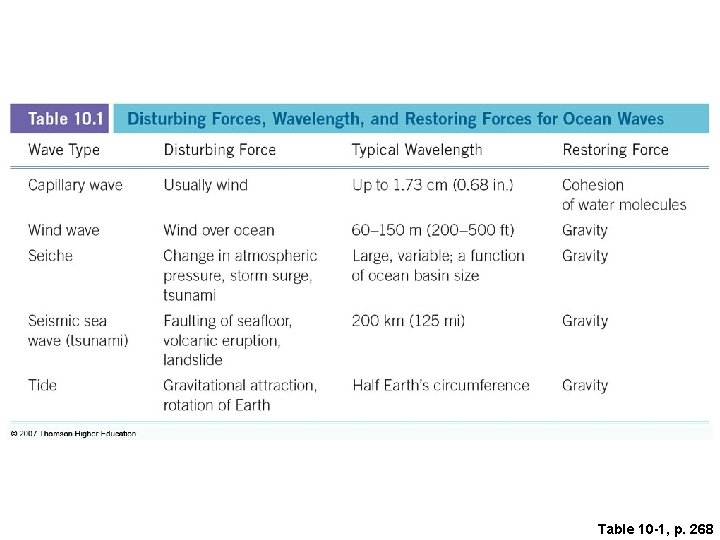
Table 10 -1, p. 268
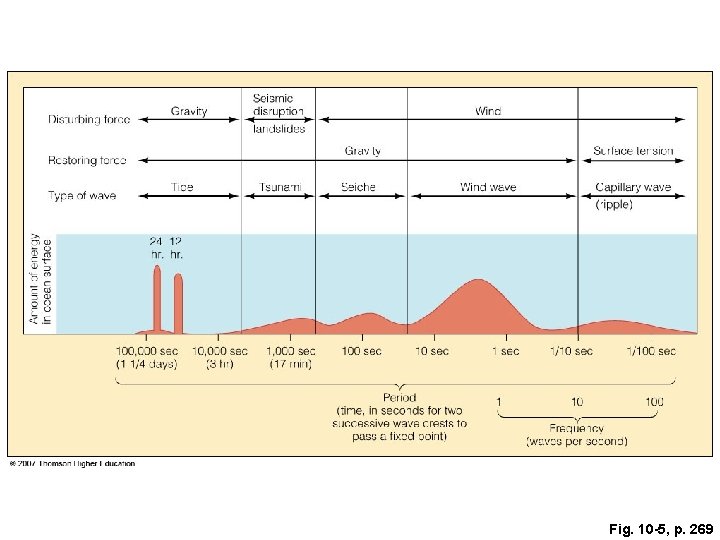
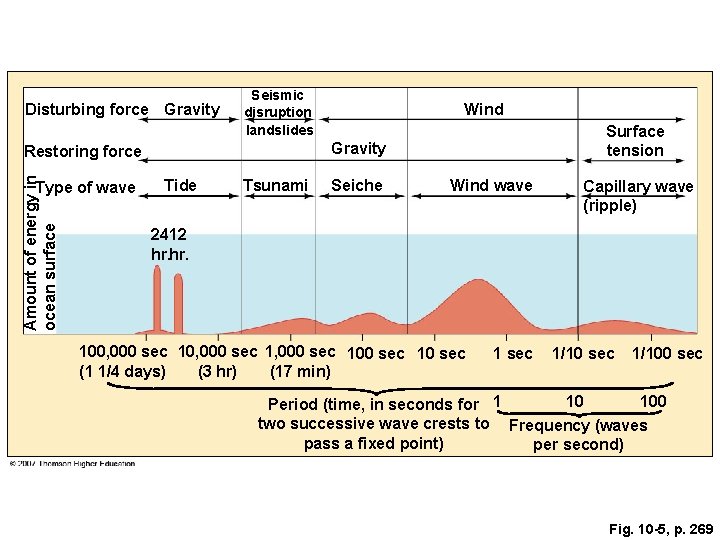
Fig. 10 -5, p. 269
Disturbing force Gravity Seismic disruption landslides Amount of energy in ocean surface Surface tension Gravity Restoring force Type of wave Wind Tide Tsunami Seiche Wind wave Capillary wave (ripple) 2412 hr. 100, 000 sec 1, 000 sec 10 sec (1 1/4 days) (3 hr) (17 min) 1 sec 1/100 sec 10 100 Period (time, in seconds for 1 two successive wave crests to Frequency (waves pass a fixed point) per second) Fig. 10 -5, p. 269
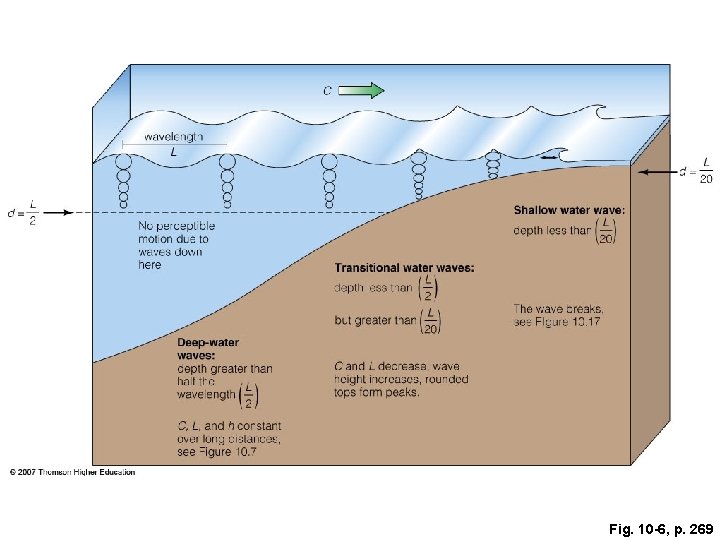
Fig. 10 -6, p. 269
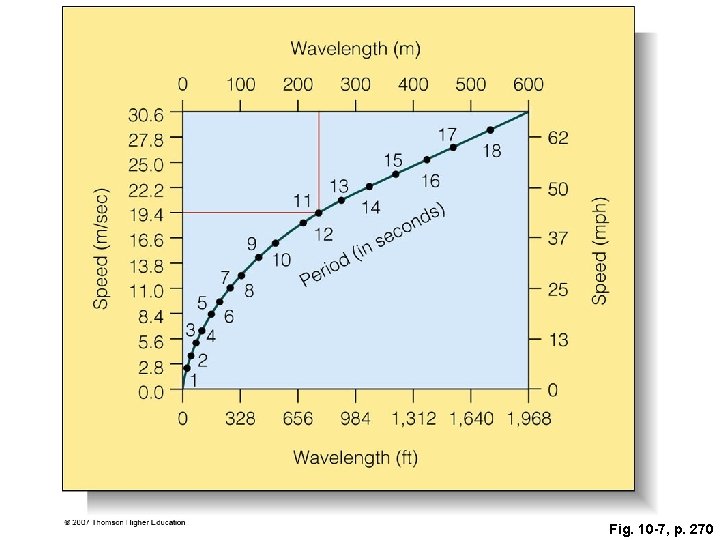
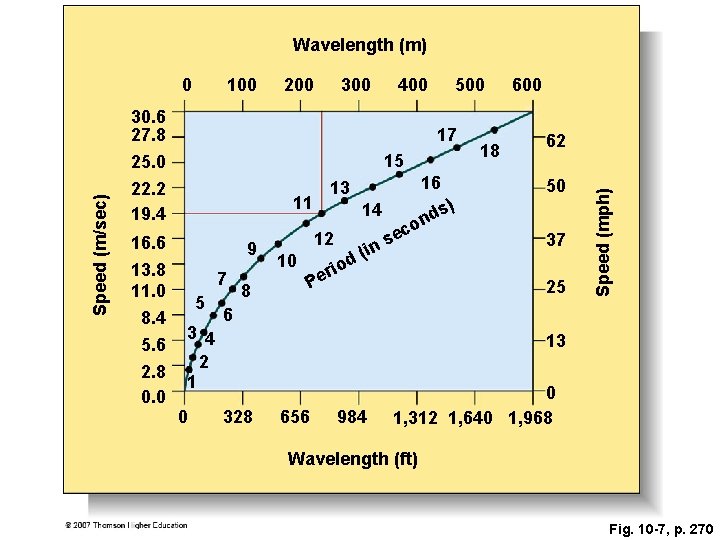
Fig. 10 -7, p. 270
Wavelength (m) 100 200 300 400 Speed (m/sec) 30. 6 27. 8 17 15 25. 0 22. 2 19. 4 16. 6 13. 8 11. 0 8. 4 5. 6 2. 8 0. 0 500 11 9 7 5 3 4 2 1 0 8 14 12 10 16 13 ri e P in d( o s nd c se ) 18 600 62 50 37 o 25 Speed (mph) 0 6 13 328 656 984 0 1, 312 1, 640 1, 968 Wavelength (ft) Fig. 10 -7, p. 270
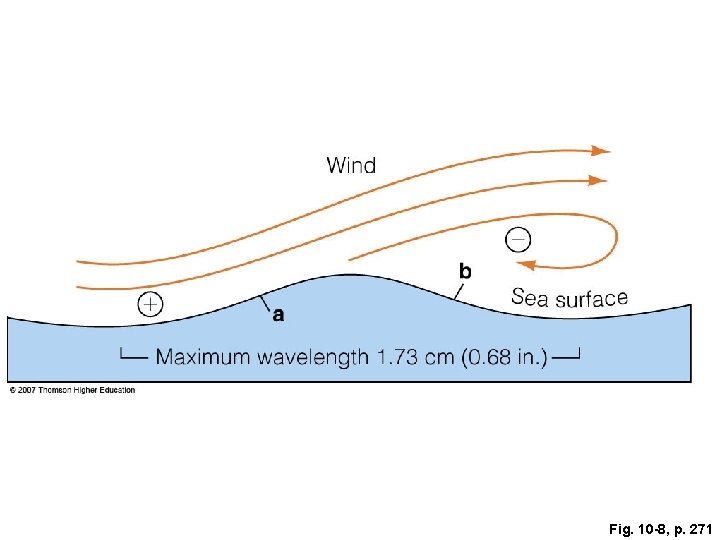
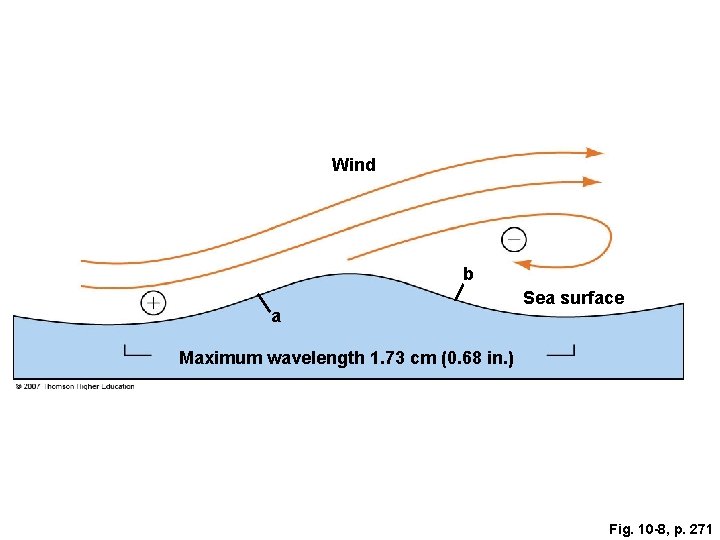
Fig. 10 -8, p. 271
Wind b a Sea surface Maximum wavelength 1. 73 cm (0. 68 in. ) Fig. 10 -8, p. 271
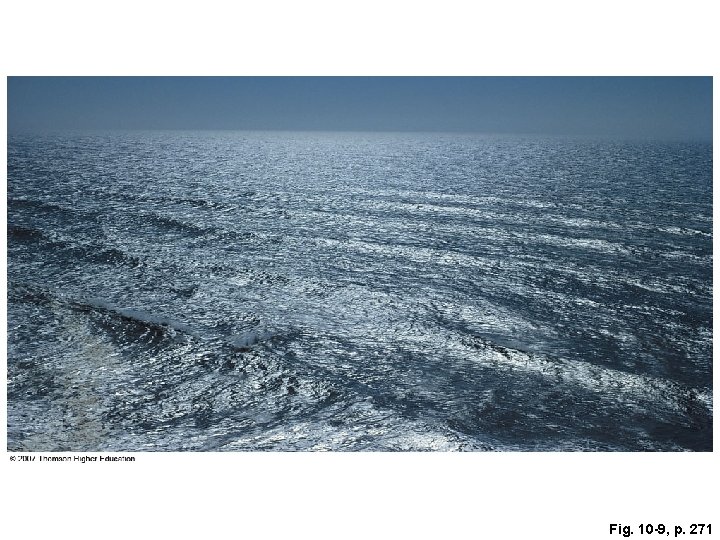
Fig. 10 -9, p. 271
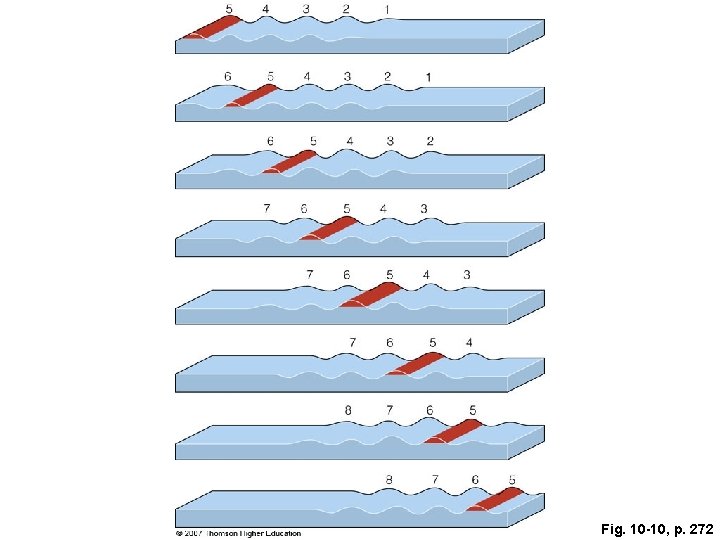
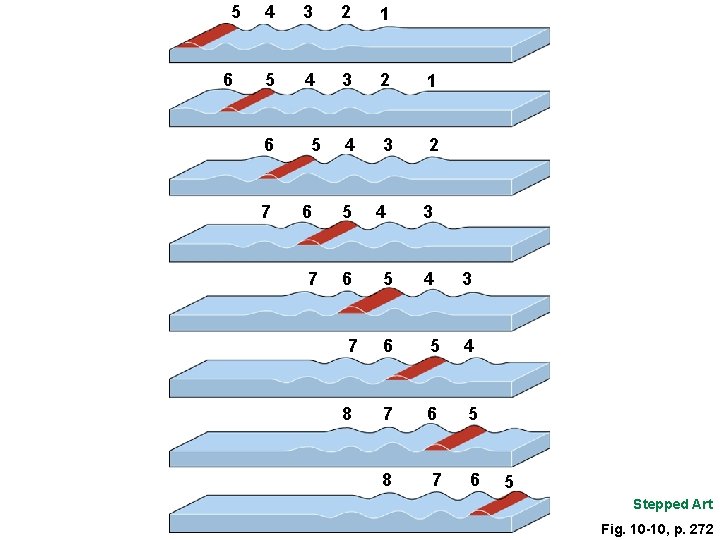
Fig. 10 -10, p. 272
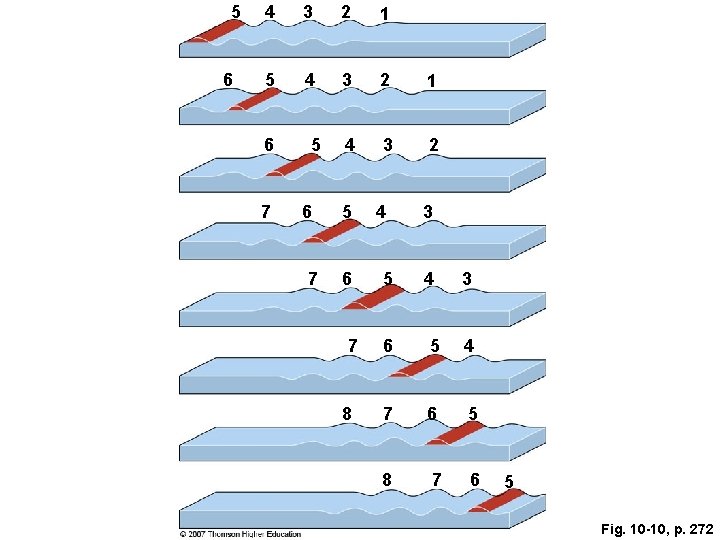
5 6 4 3 2 1 5 4 3 2 1 4 3 2 6 7 5 6 7 8 4 5 3 4 3 6 5 4 7 6 5 8 7 6 5 Fig. 10 -10, p. 272
5 6 4 3 2 1 5 4 3 2 1 4 3 2 6 7 5 6 7 8 4 5 3 4 3 6 5 4 7 6 5 8 7 6 5 Stepped Art Fig. 10 -10, p. 272
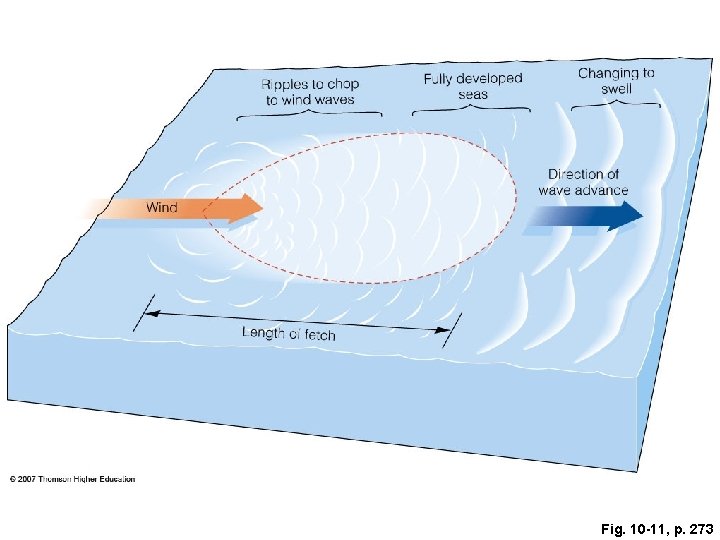
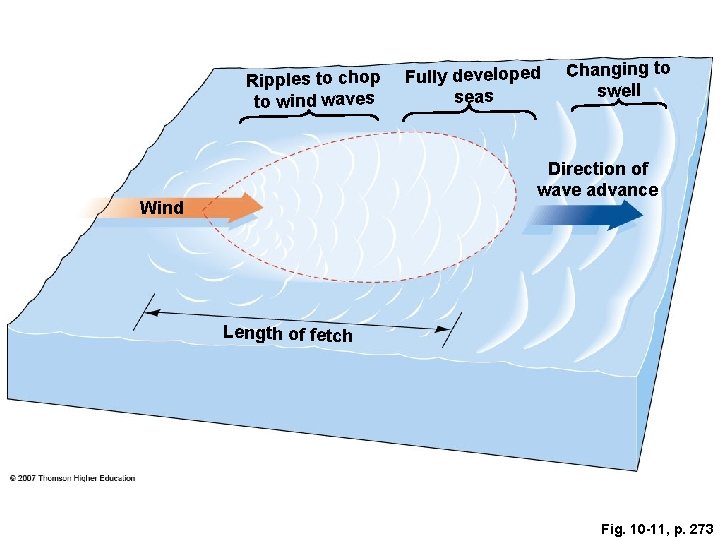
Fig. 10 -11, p. 273
Ripples to chop to wind waves Fully developed seas Changing to swell Direction of wave advance Wind Length of fetch Fig. 10 -11, p. 273
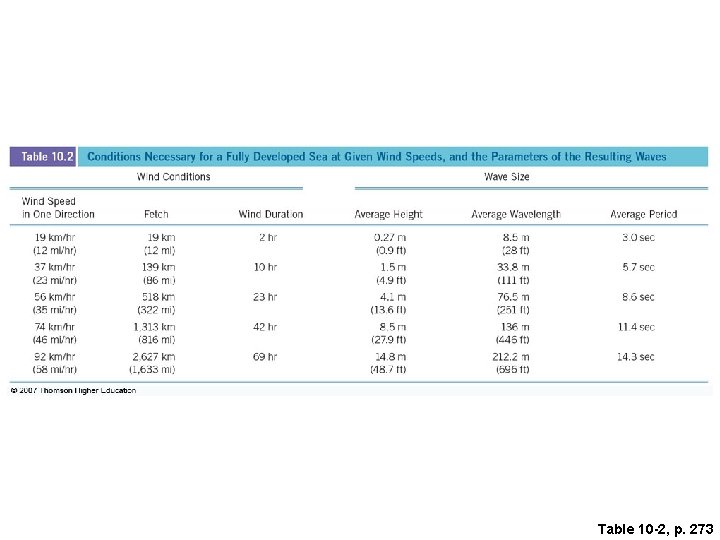
Table 10 -2, p. 273
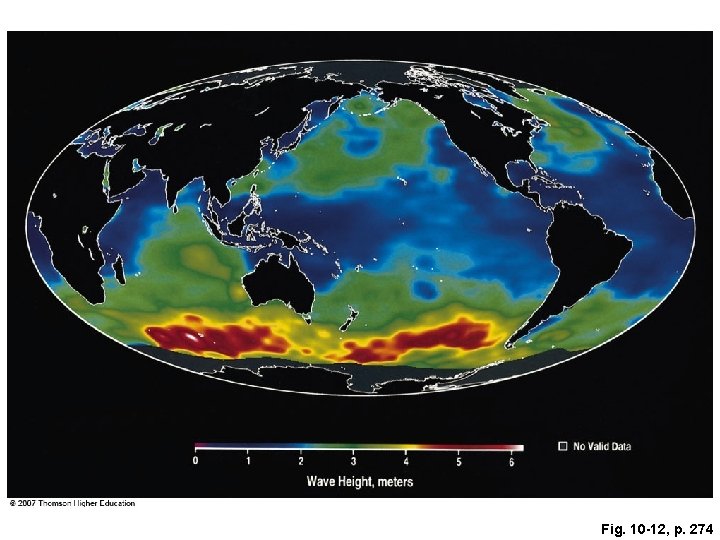
Fig. 10 -12, p. 274
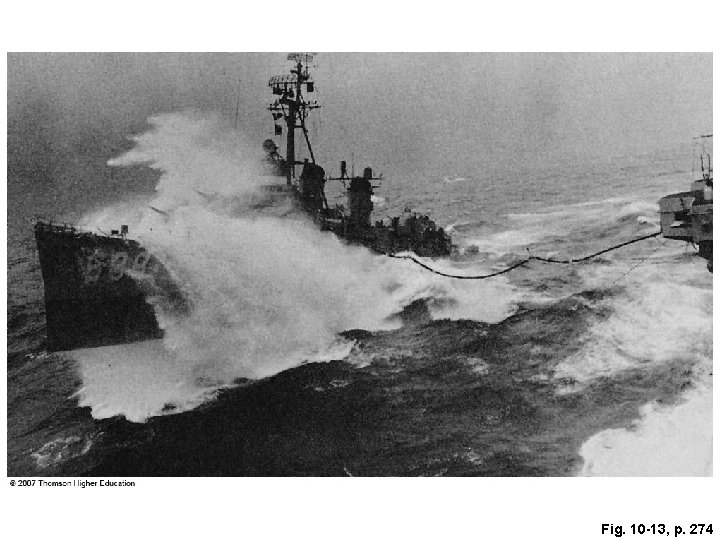
Fig. 10 -13, p. 274
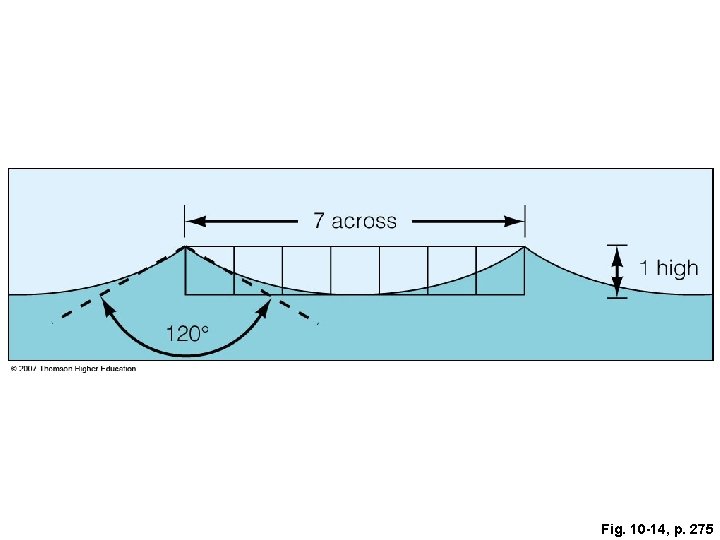
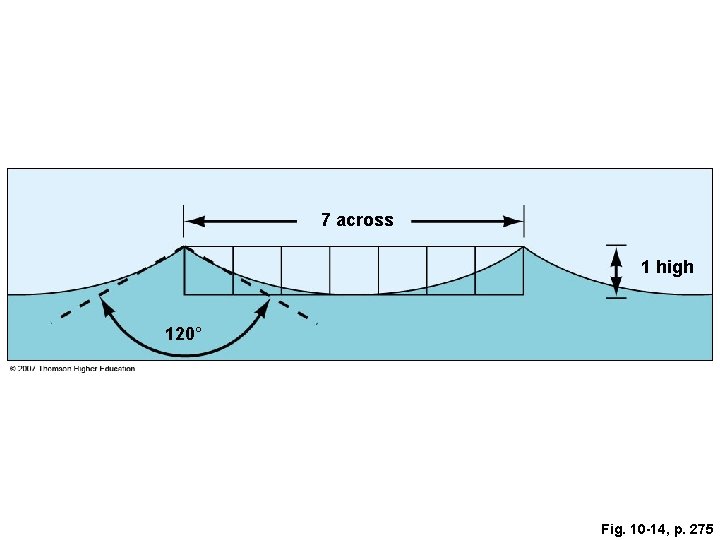
Fig. 10 -14, p. 275
7 across 1 high 120° Fig. 10 -14, p. 275
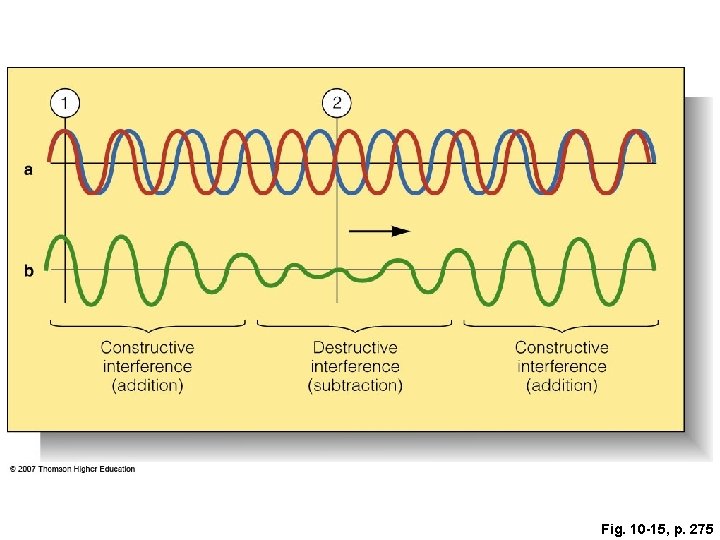
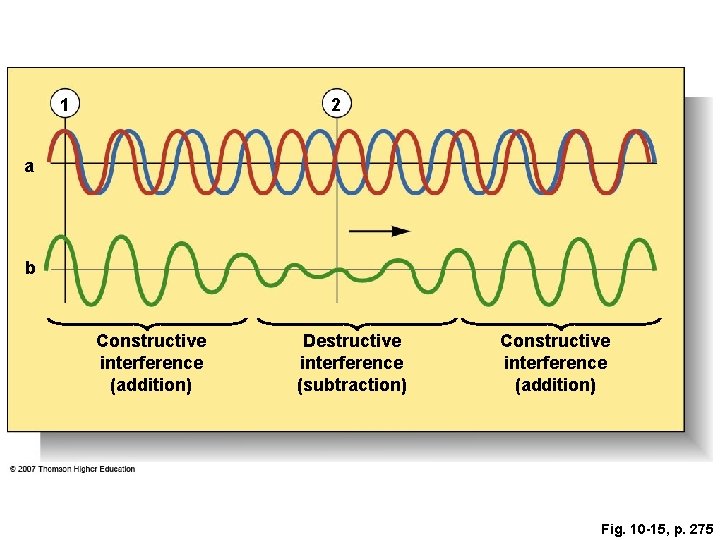
Fig. 10 -15, p. 275
1 2 a b Constructive interference (addition) Destructive interference (subtraction) Constructive interference (addition) Fig. 10 -15, p. 275
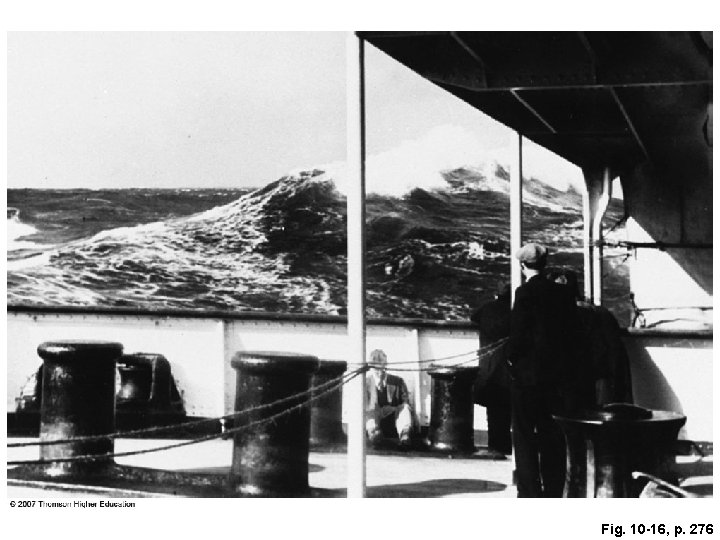
Fig. 10 -16, p. 276
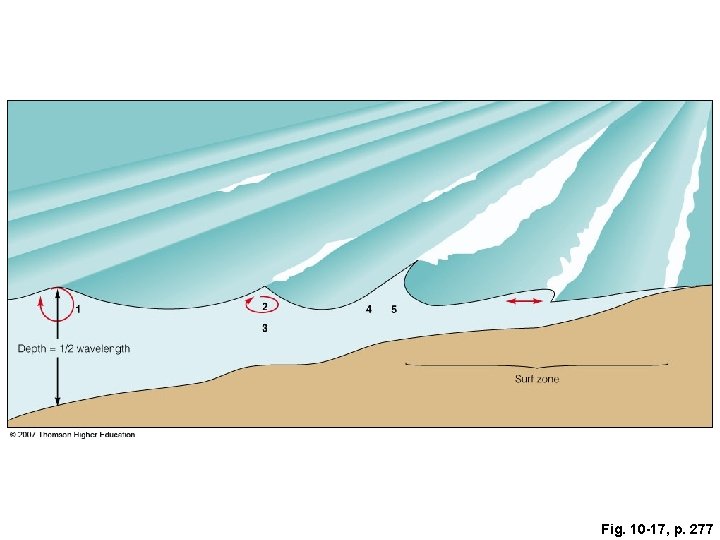
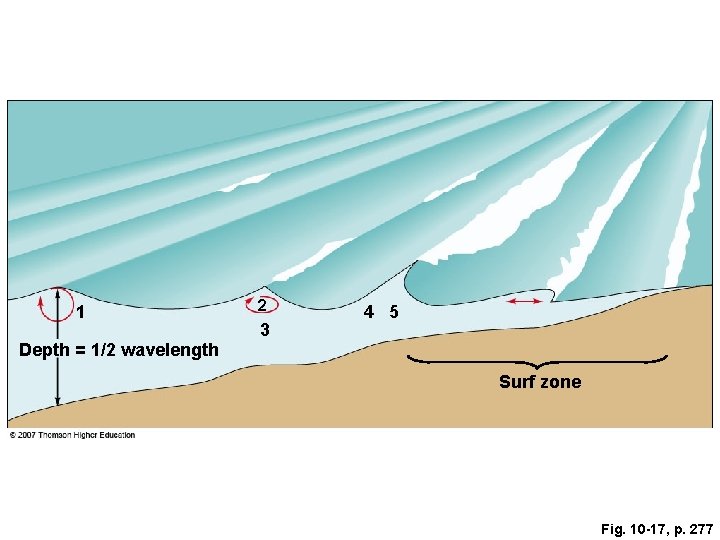
Fig. 10 -17, p. 277
1 2 3 4 5 Depth = 1/2 wavelength Surf zone Fig. 10 -17, p. 277
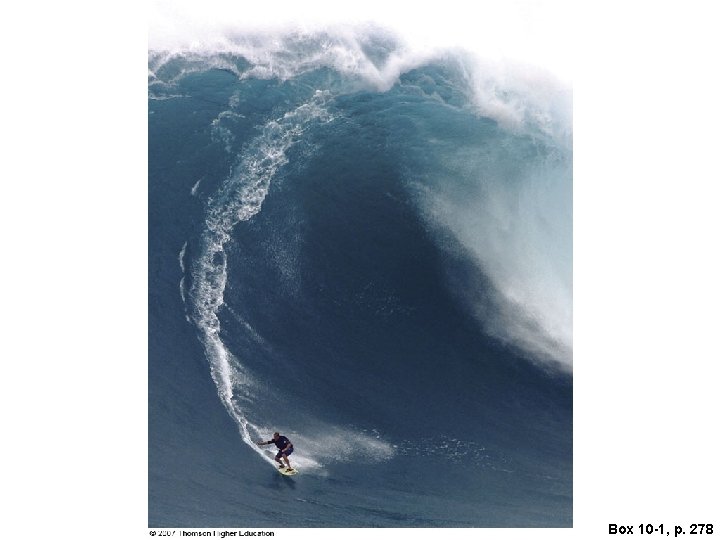
Box 10 -1, p. 278
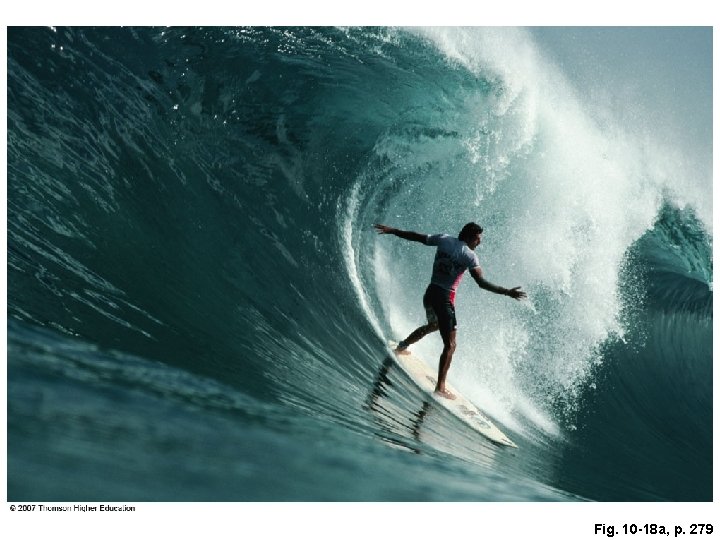
Fig. 10 -18 a, p. 279
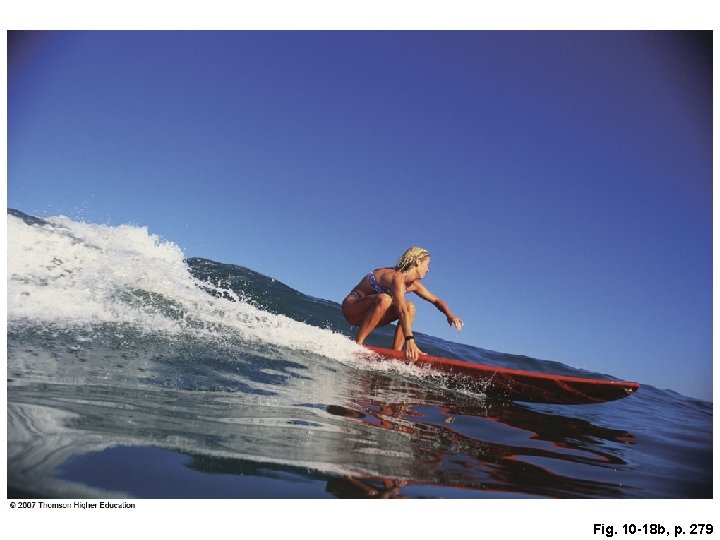
Fig. 10 -18 b, p. 279
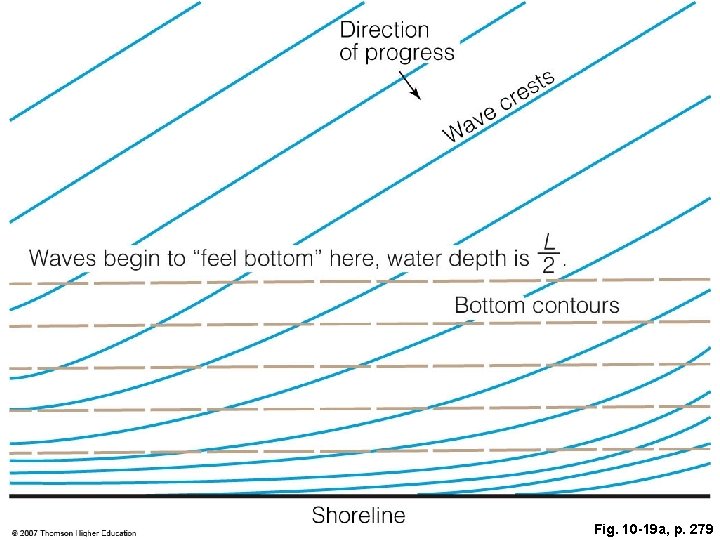
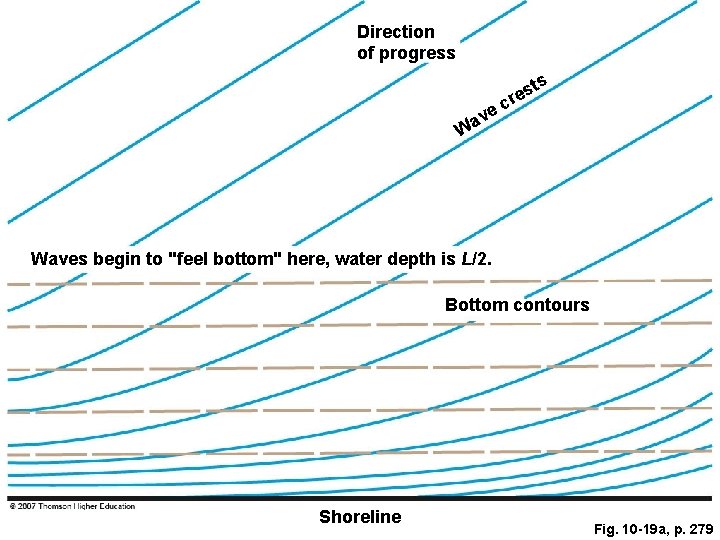
Fig. 10 -19 a, p. 279
Direction of progress ts e v a W s cre Waves begin to "feel bottom" here, water depth is L/2. Bottom contours Shoreline Fig. 10 -19 a, p. 279
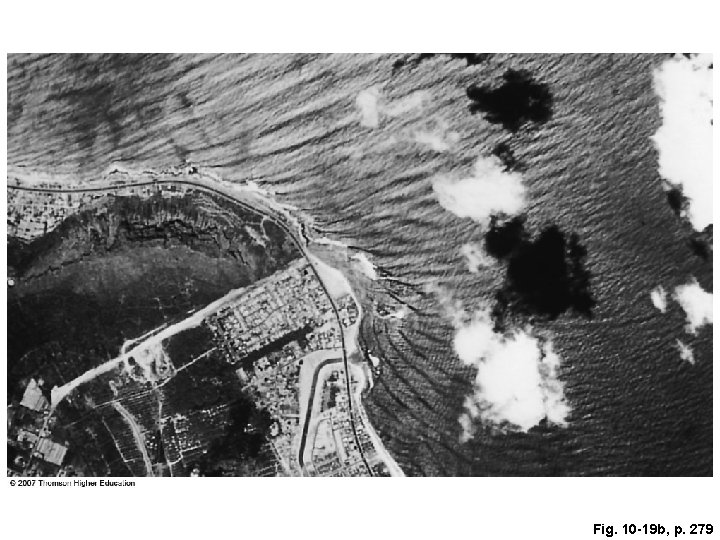
Fig. 10 -19 b, p. 279
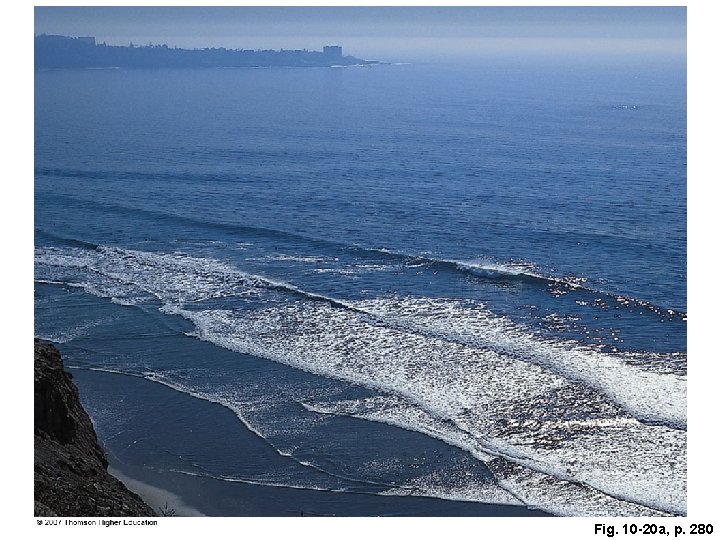
Fig. 10 -20 a, p. 280
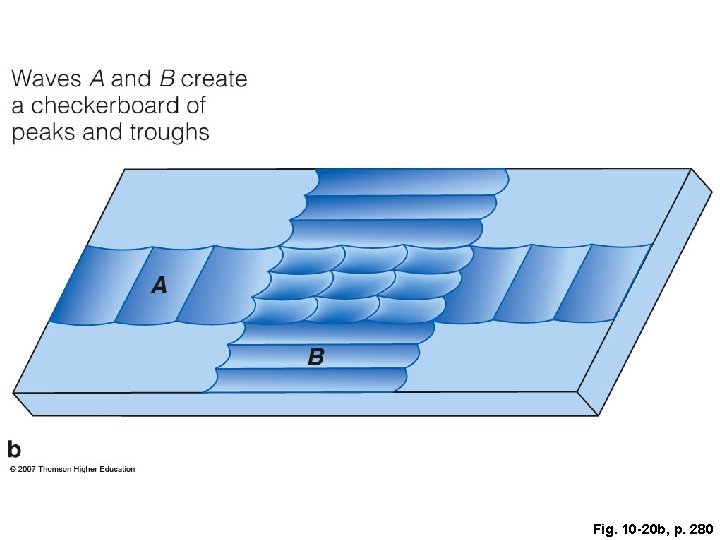
Fig. 10 -20 b, p. 280
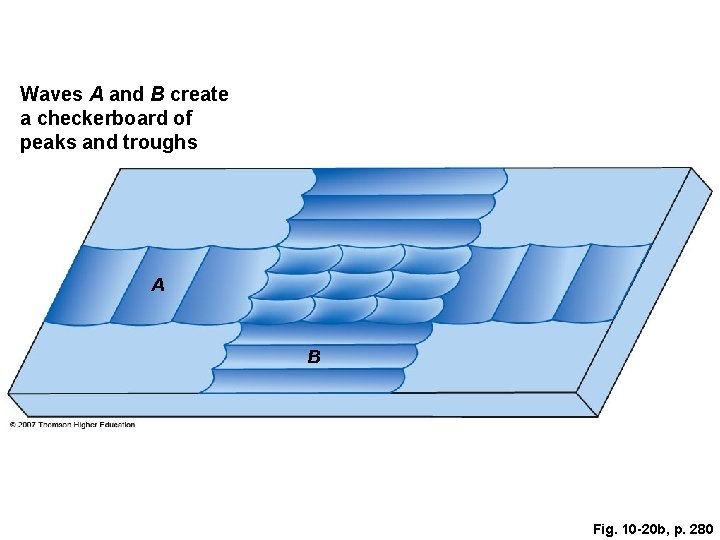
Waves A and B create a checkerboard of peaks and troughs A B Fig. 10 -20 b, p. 280
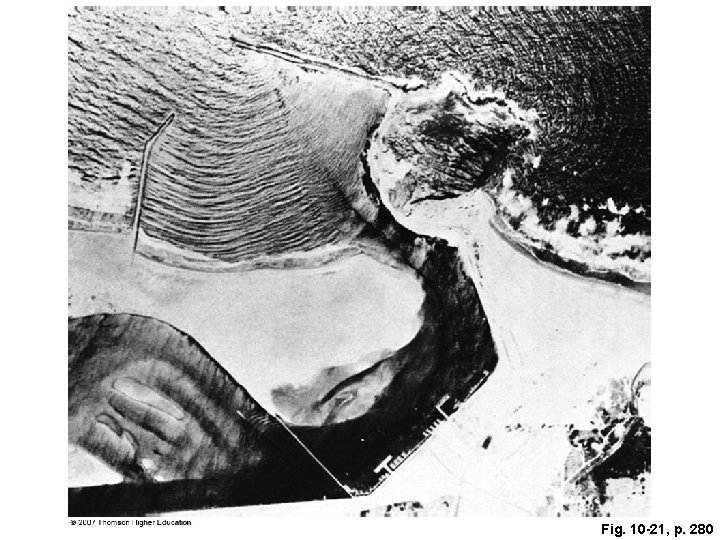
Fig. 10 -21, p. 280
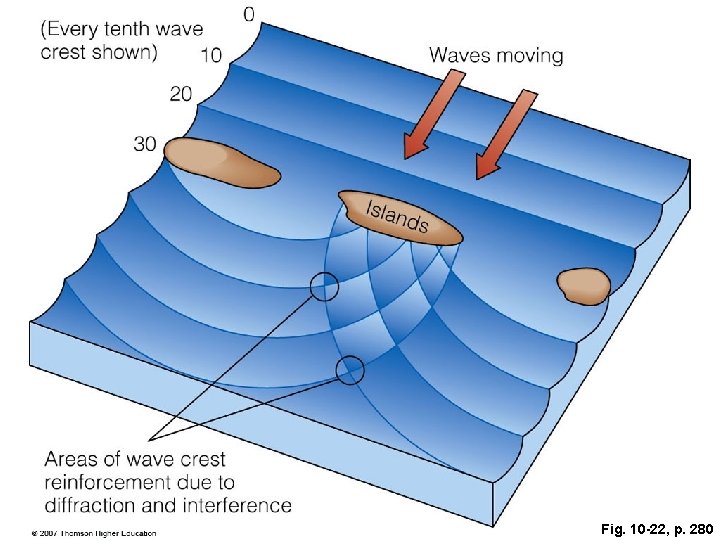
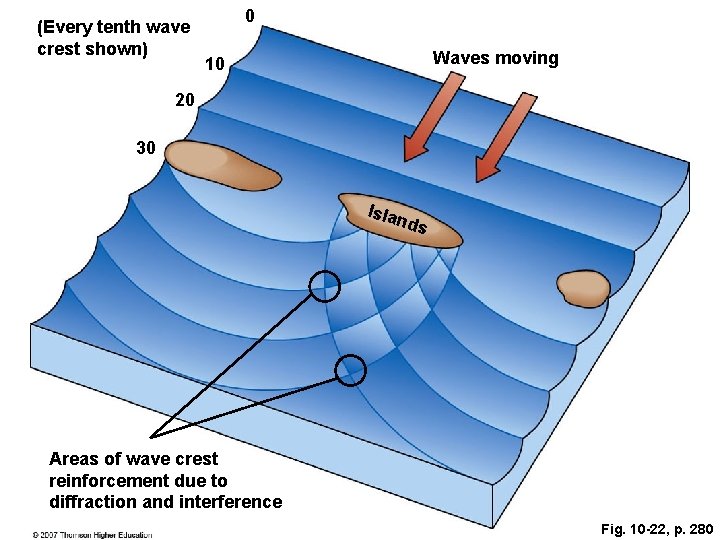
Fig. 10 -22, p. 280
(Every tenth wave crest shown) 0 Waves moving 10 20 30 Isla nds Areas of wave crest reinforcement due to diffraction and interference Fig. 10 -22, p. 280
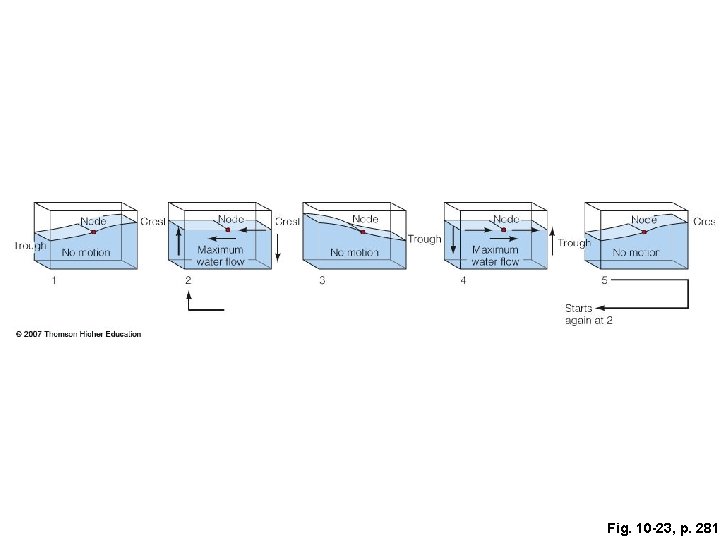
Fig. 10 -23, p. 281
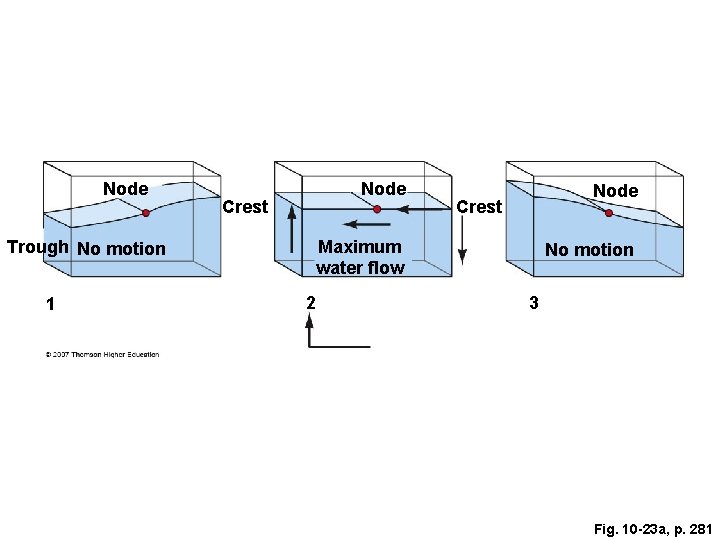
Node Crest Maximum water flow Trough No motion 1 Node 2 No motion 3 Fig. 10 -23 a, p. 281
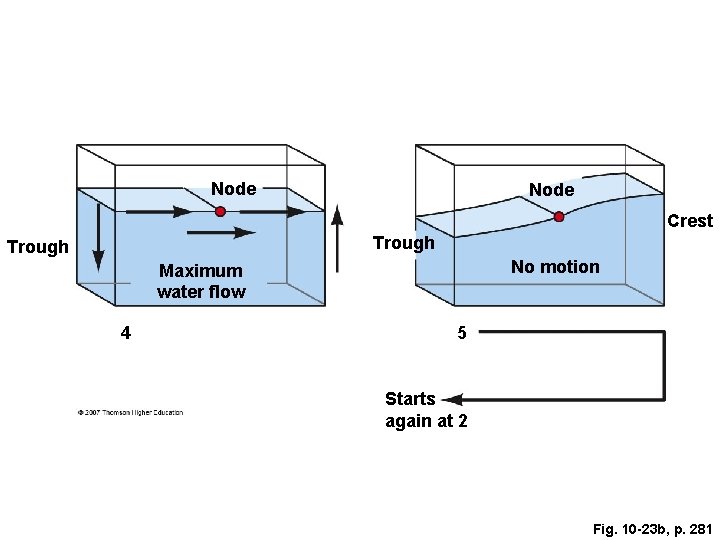
Node Crest Trough No motion Maximum water flow 4 5 Starts again at 2 Fig. 10 -23 b, p. 281
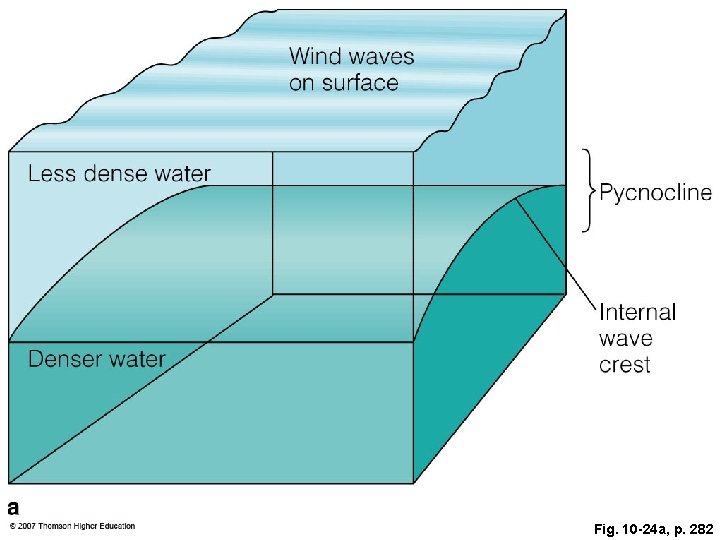
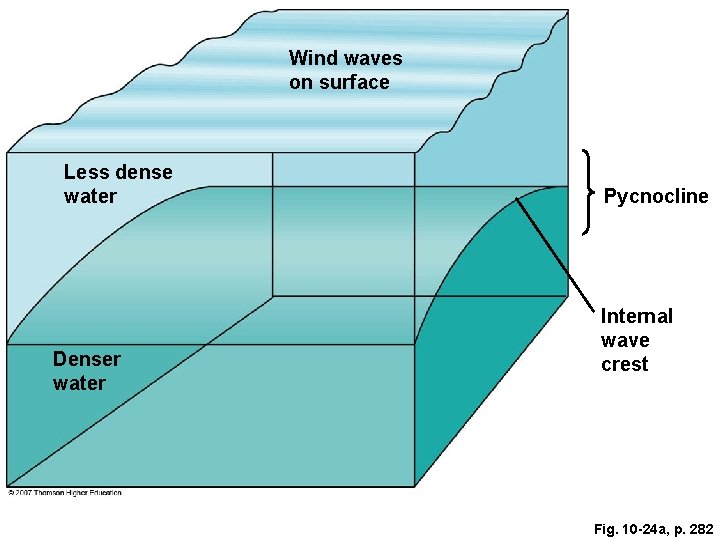
Fig. 10 -24 a, p. 282
Wind waves on surface Less dense water Denser water Pycnocline Internal wave crest Fig. 10 -24 a, p. 282
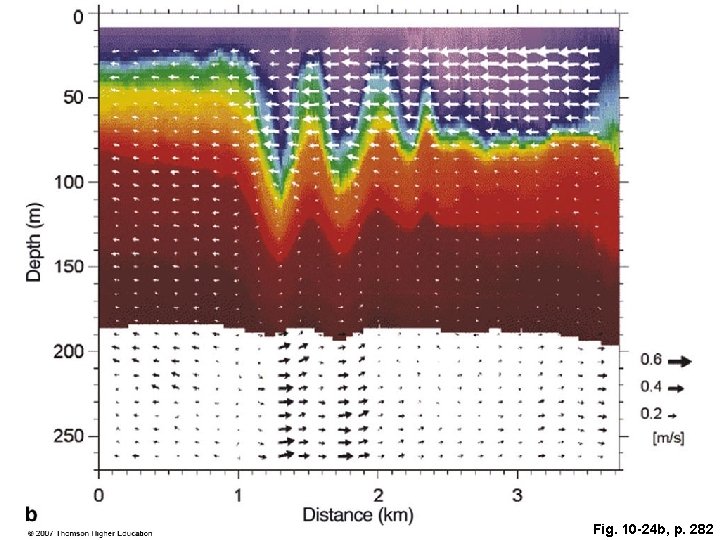
Fig. 10 -24 b, p. 282
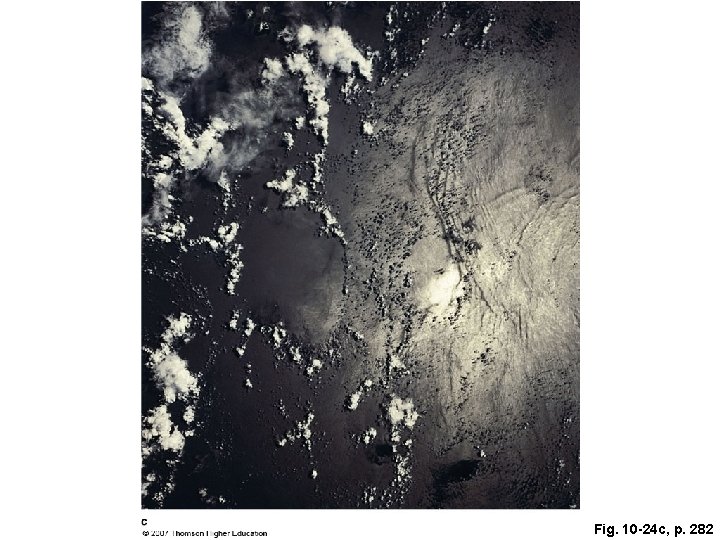
Fig. 10 -24 c, p. 282
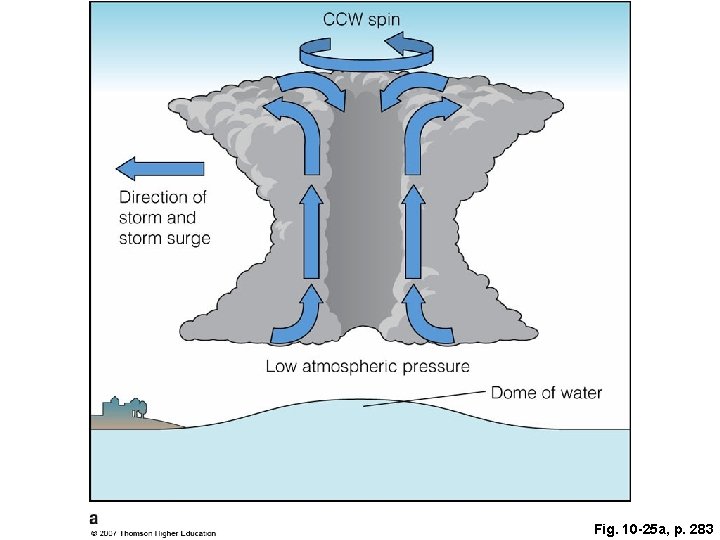
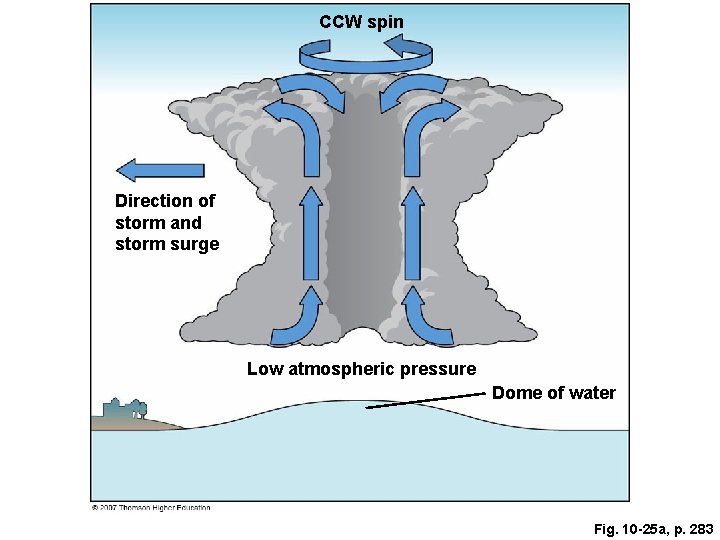
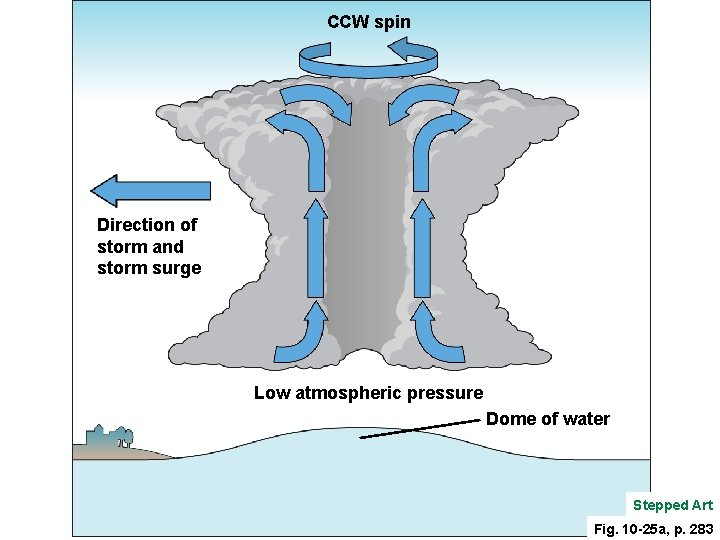
Fig. 10 -25 a, p. 283
CCW spin Direction of storm and storm surge Low atmospheric pressure Dome of water Fig. 10 -25 a, p. 283
CCW spin Direction of storm and storm surge Low atmospheric pressure Dome of water Stepped Art Fig. 10 -25 a, p. 283
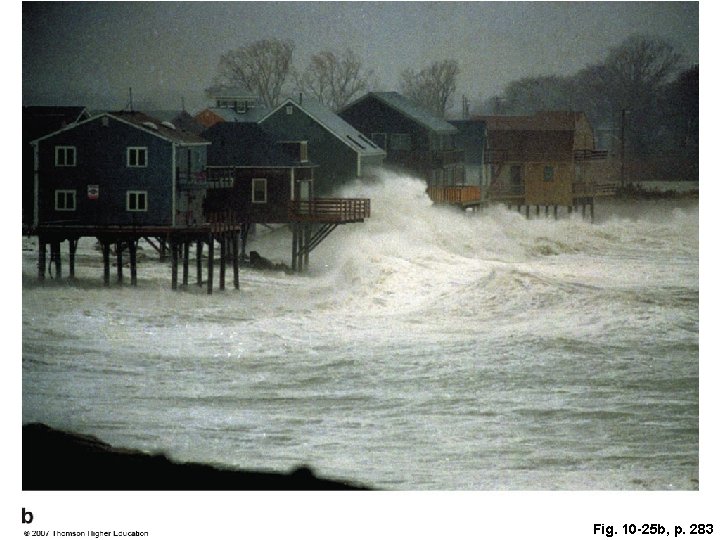
Fig. 10 -25 b, p. 283
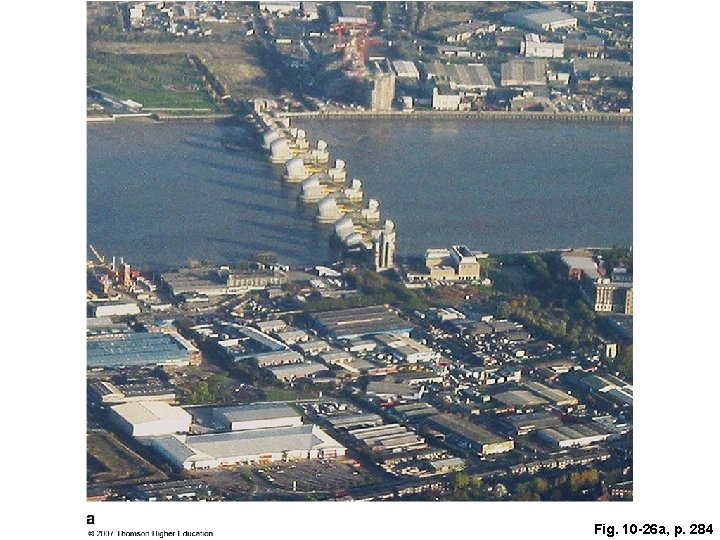
Fig. 10 -26 a, p. 284
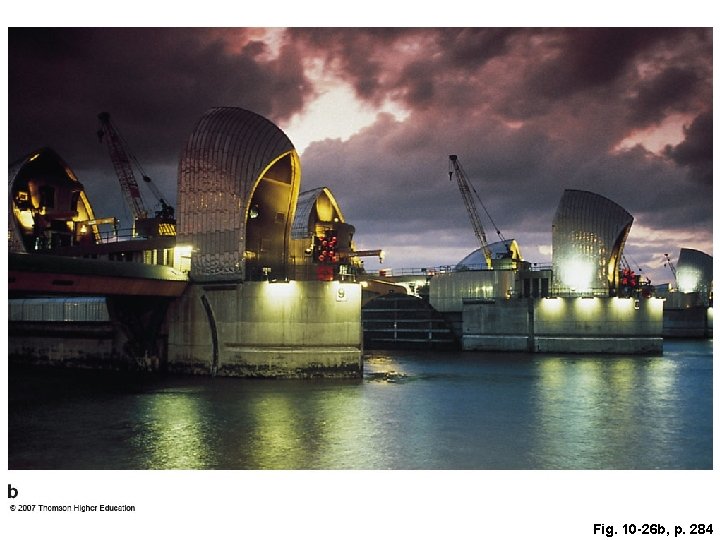
Fig. 10 -26 b, p. 284
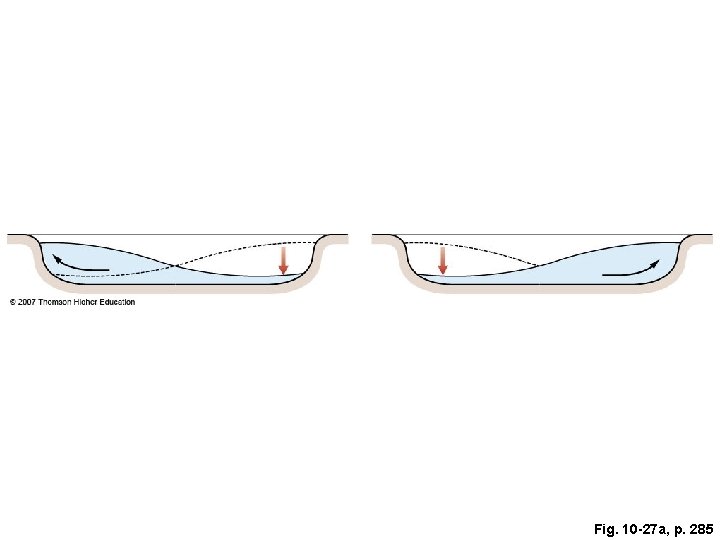
Fig. 10 -27 a, p. 285
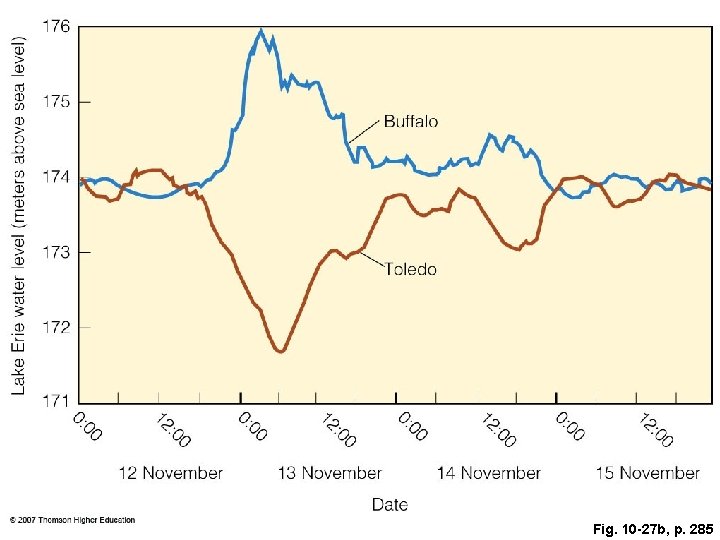
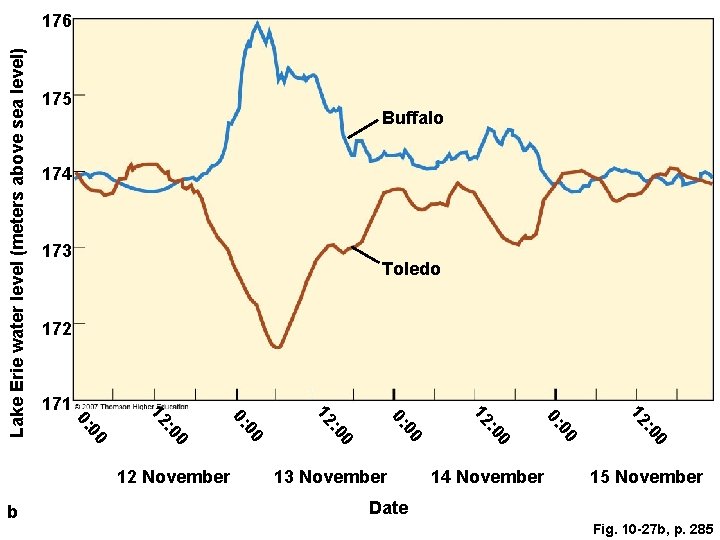
Fig. 10 -27 b, p. 285
175 Buffalo 174 173 Toledo 172 14 November 0 : 0 12 00 0: 13 November 0 : 0 12 00 0: 0 b : 0 12 November 12 00 0: 0 : 0 12 171 00 0: Lake Erie water level (meters above sea level) 176 15 November Date Fig. 10 -27 b, p. 285
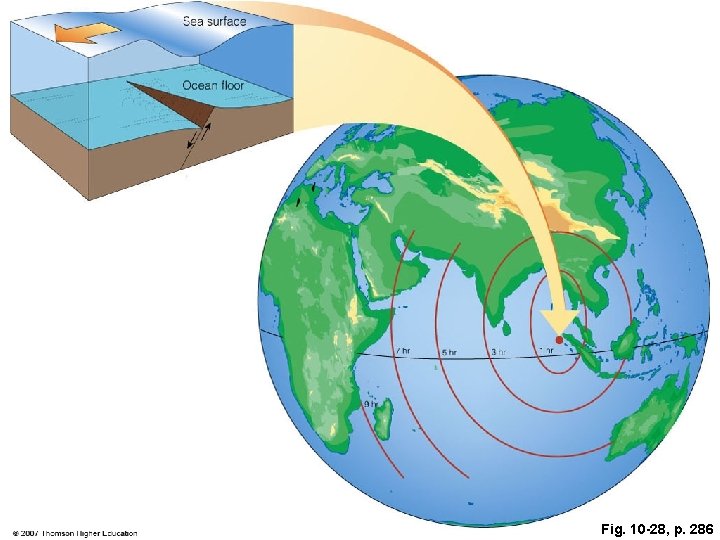
Fig. 10 -28, p. 286
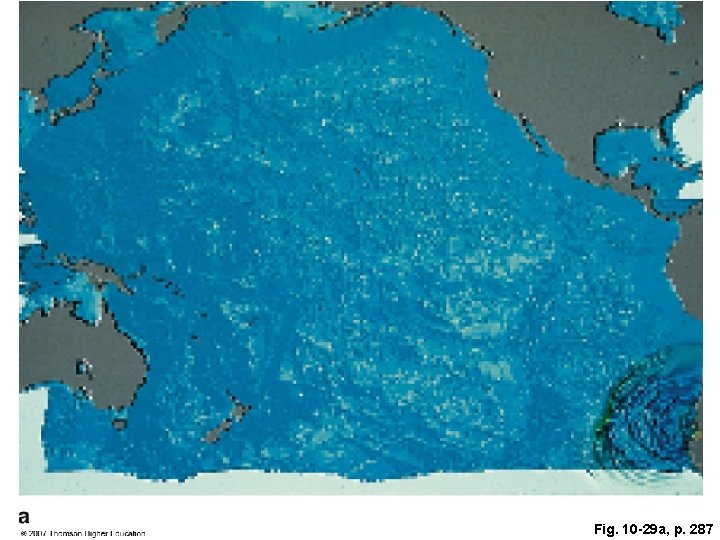
Fig. 10 -29 a, p. 287
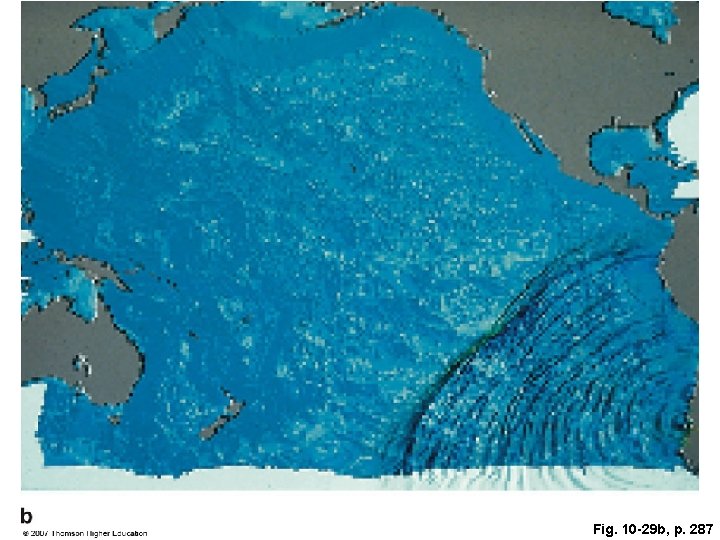
Fig. 10 -29 b, p. 287
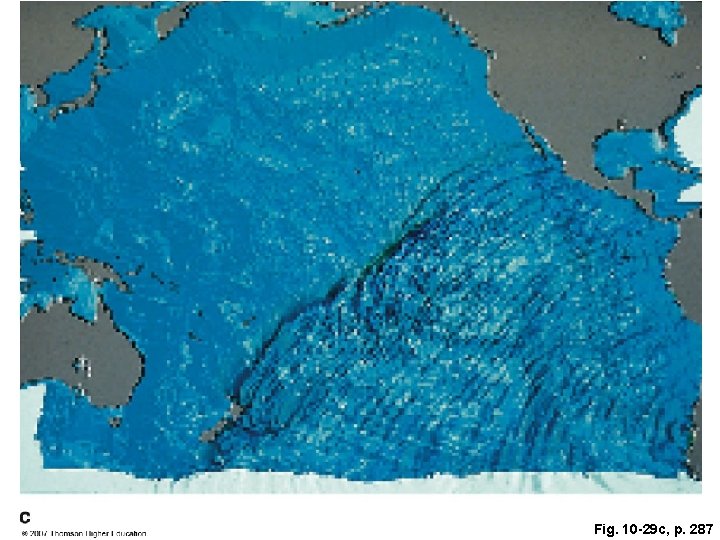
Fig. 10 -29 c, p. 287
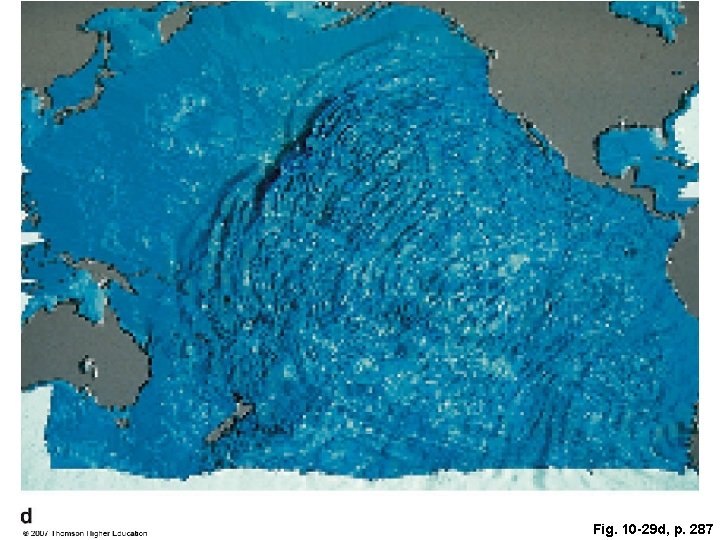
Fig. 10 -29 d, p. 287
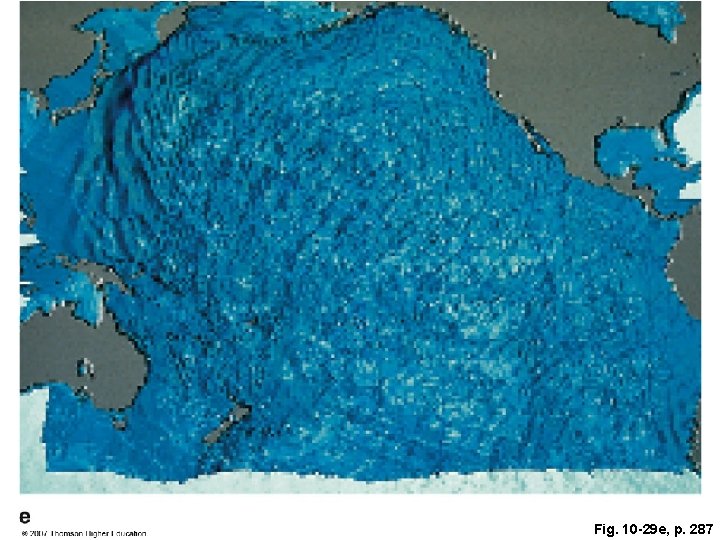
Fig. 10 -29 e, p. 287
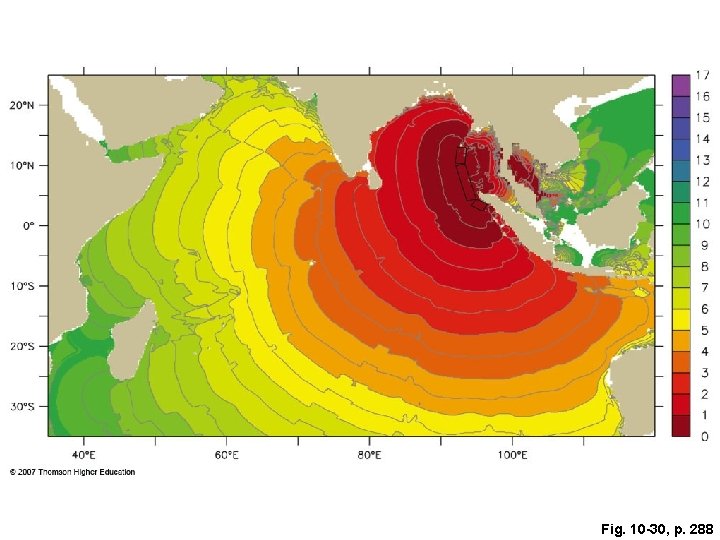
Fig. 10 -30, p. 288
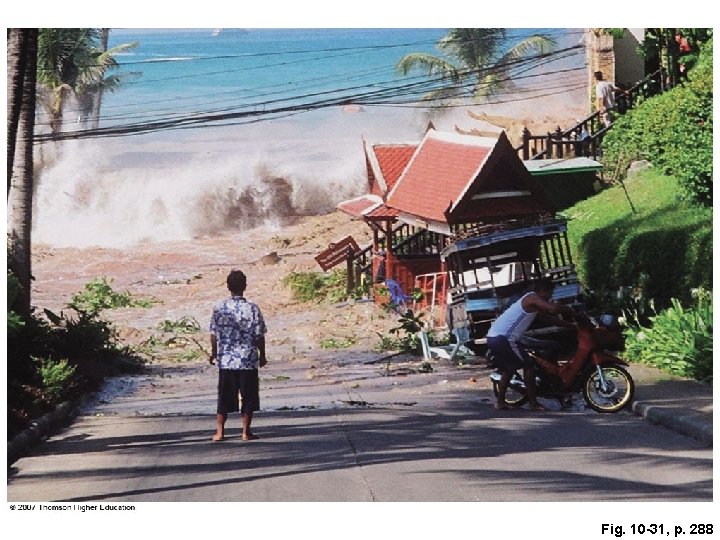
Fig. 10 -31, p. 288
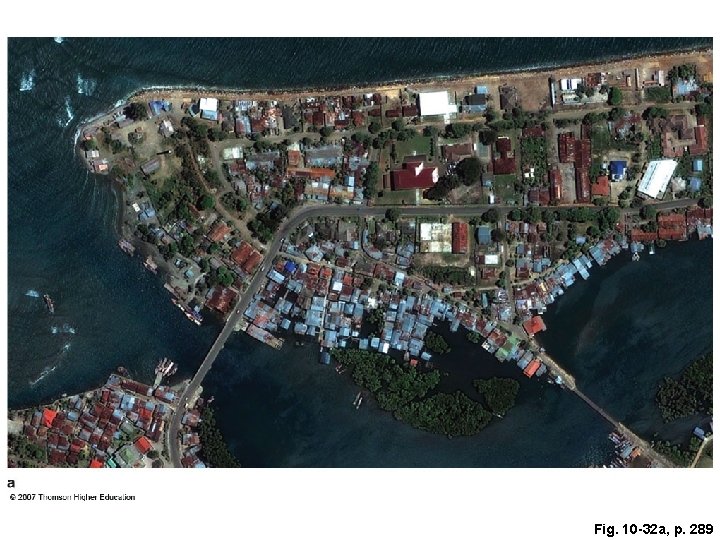
Fig. 10 -32 a, p. 289
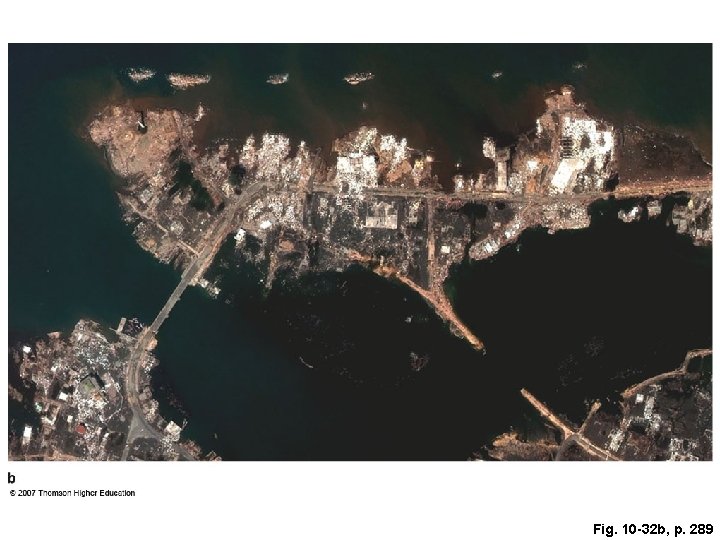
Fig. 10 -32 b, p. 289
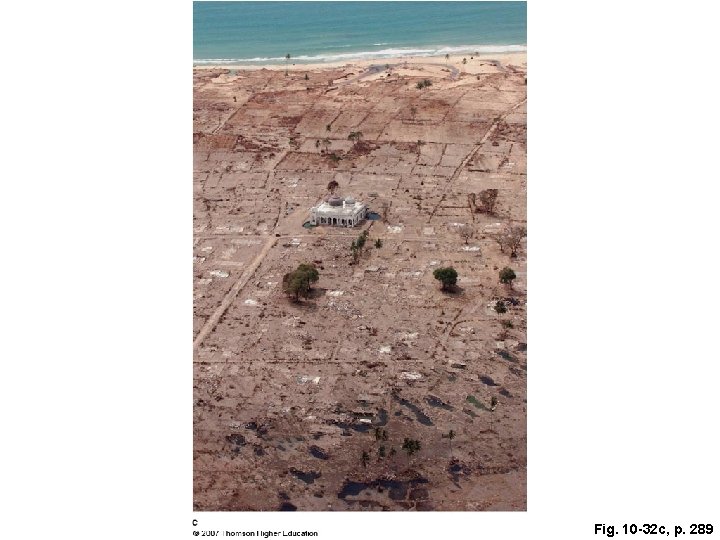
Fig. 10 -32 c, p. 289
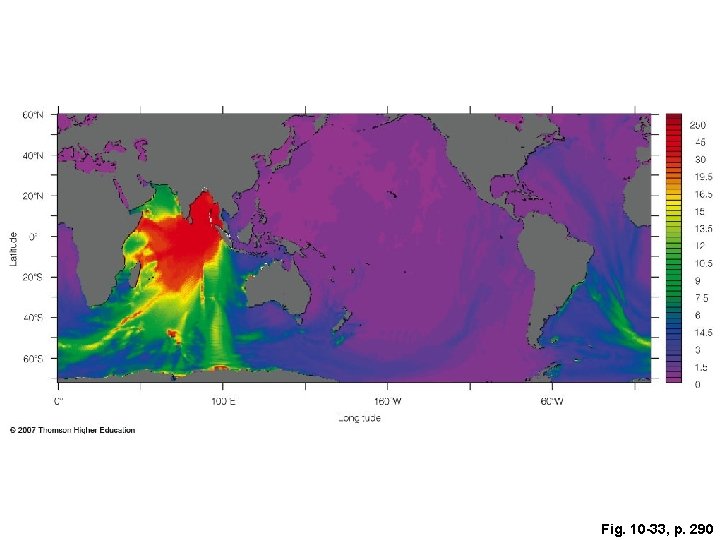
Fig. 10 -33, p. 290
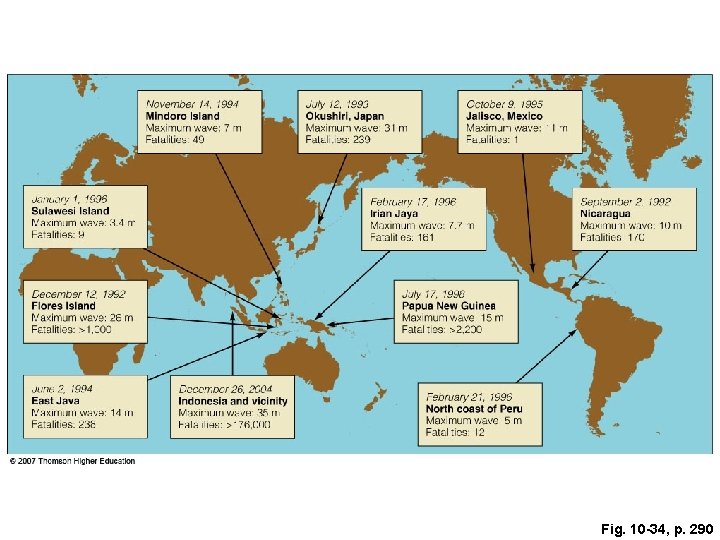
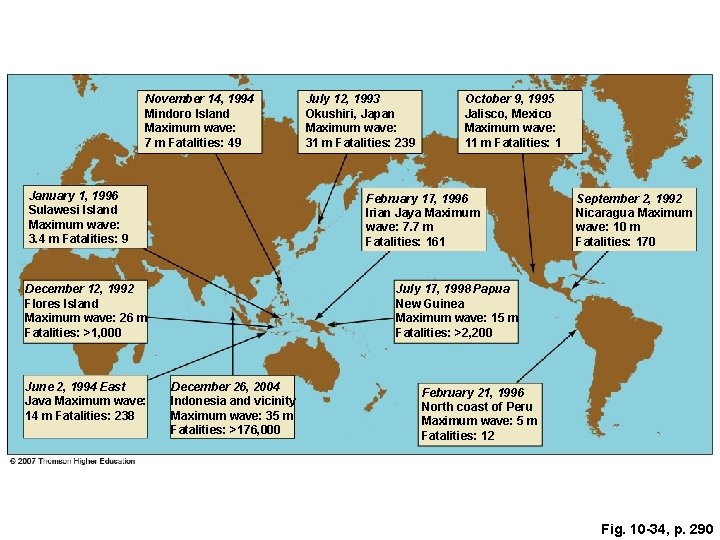
Fig. 10 -34, p. 290
November 14, 1994 Mindoro Island Maximum wave: 7 m Fatalities: 49 January 1, 1996 Sulawesi Island Maximum wave: 3. 4 m Fatalities: 9 October 9, 1995 Jalisco, Mexico Maximum wave: 11 m Fatalities: 1 February 17, 1996 Irian Jaya Maximum wave: 7. 7 m Fatalities: 161 December 12, 1992 Flores Island Maximum wave: 26 m Fatalities: >1, 000 June 2, 1994 East Java Maximum wave: 14 m Fatalities: 238 July 12, 1993 Okushiri, Japan Maximum wave: 31 m Fatalities: 239 September 2, 1992 Nicaragua Maximum wave: 10 m Fatalities: 170 July 17, 1998 Papua New Guinea Maximum wave: 15 m Fatalities: >2, 200 December 26, 2004 Indonesia and vicinity Maximum wave: 35 m Fatalities: >176, 000 February 21, 1996 North coast of Peru Maximum wave: 5 m Fatalities: 12 Fig. 10 -34, p. 290
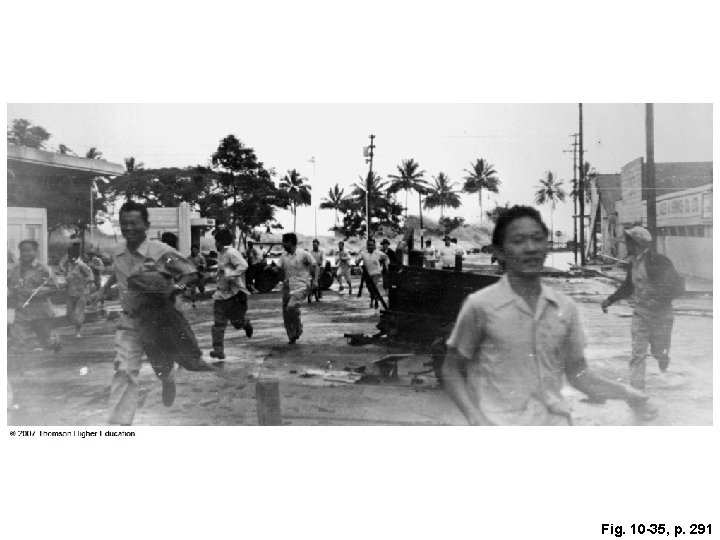
Fig. 10 -35, p. 291
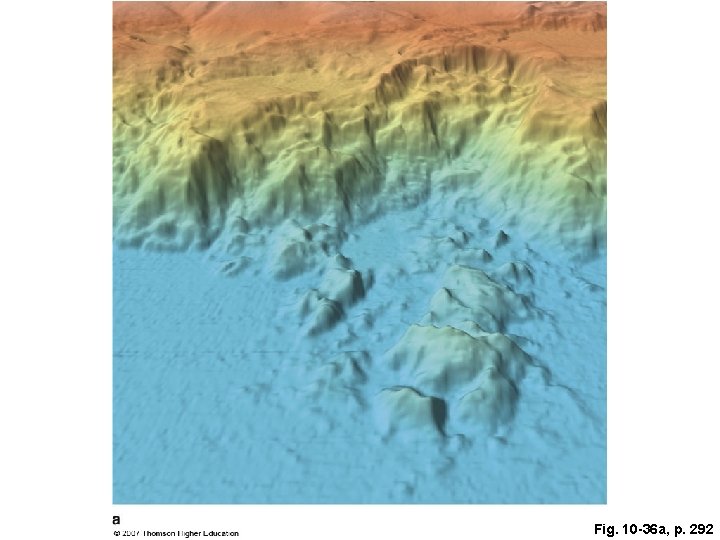
Fig. 10 -36 a, p. 292
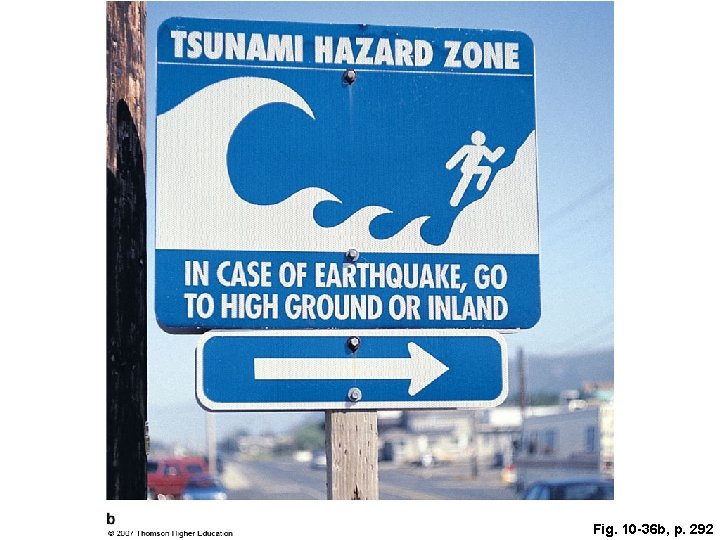
Fig. 10 -36 b, p. 292
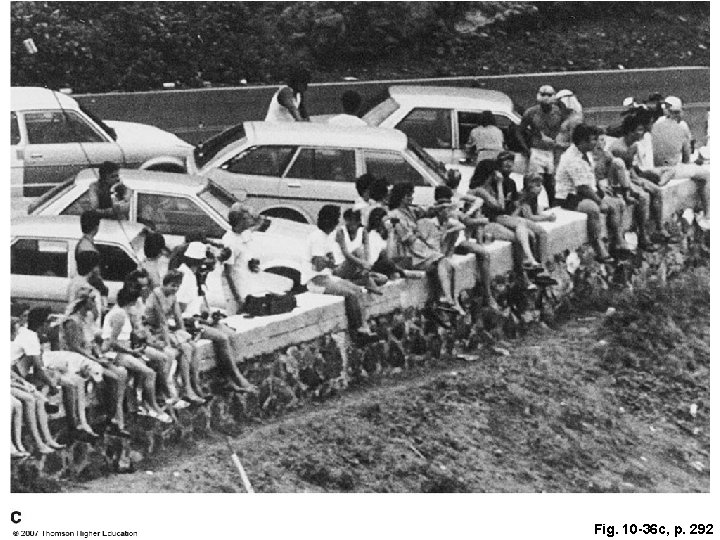
Fig. 10 -36 c, p. 292
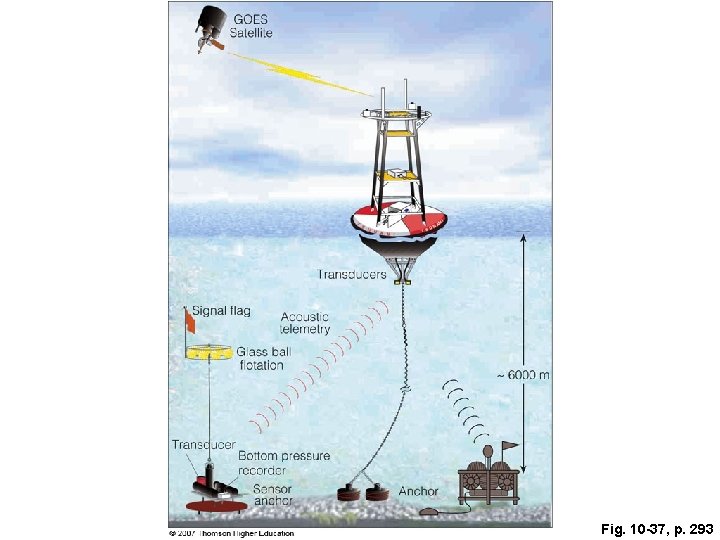
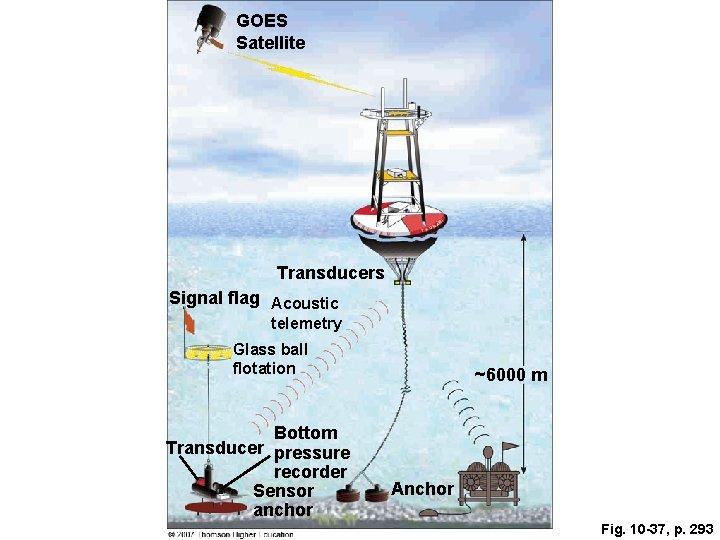
Fig. 10 -37, p. 293
GOES Satellite Transducers Signal flag Acoustic telemetry Glass ball flotation Bottom Transducer pressure recorder Sensor anchor ~6000 m Anchor Fig. 10 -37, p. 293
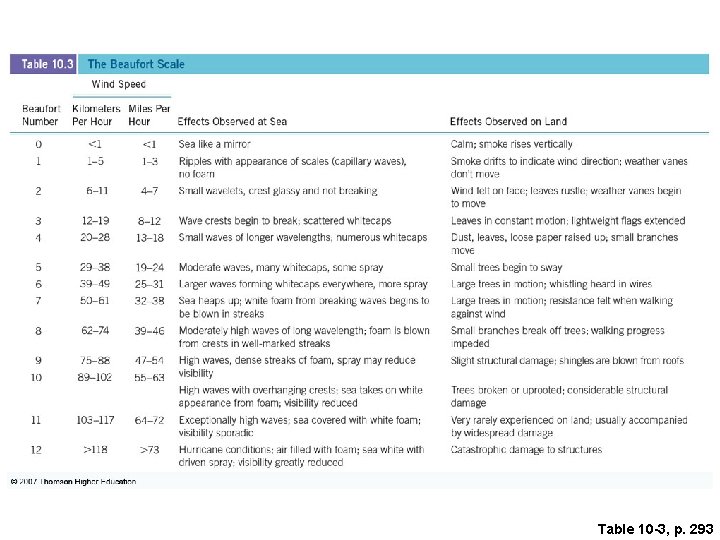
Table 10 -3, p. 293