Fig 16 CO p 447 Fig 16 1
- Slides: 40
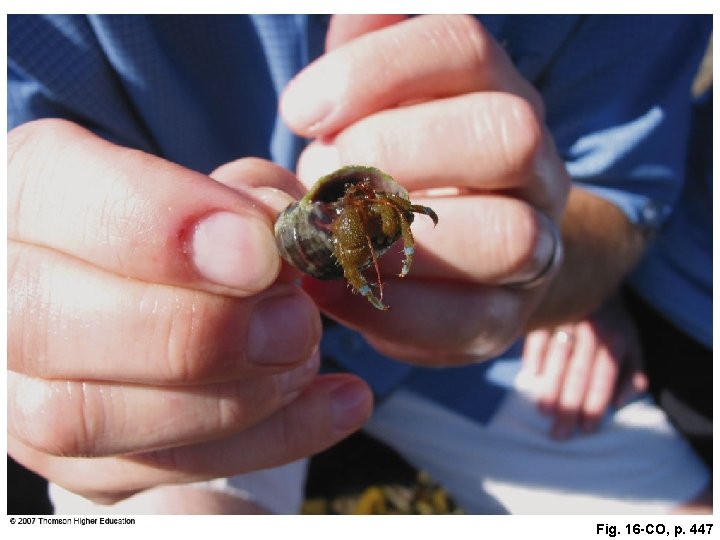
Fig. 16 -CO, p. 447
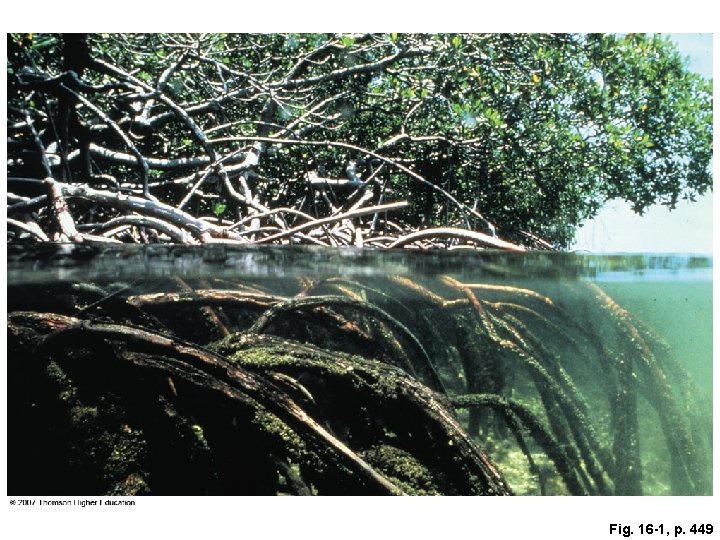
Fig. 16 -1, p. 449
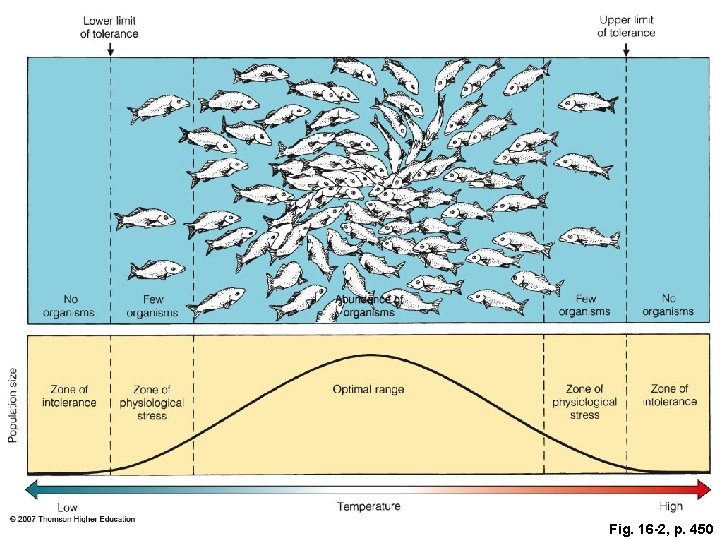
Fig. 16 -2, p. 450
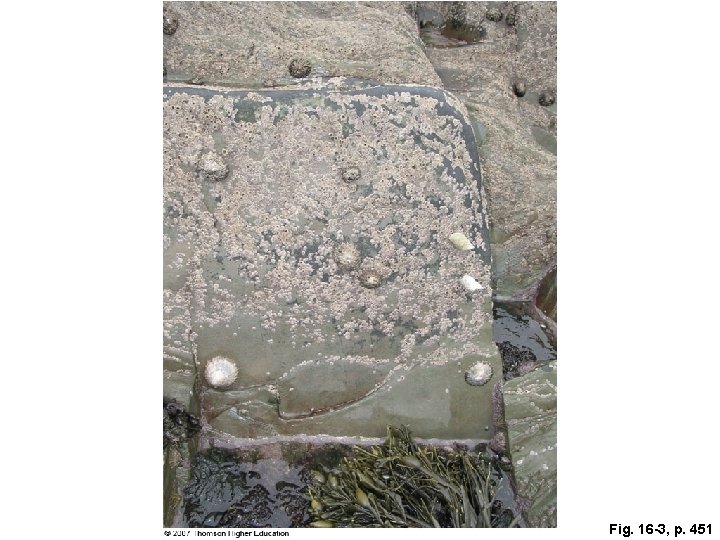
Fig. 16 -3, p. 451
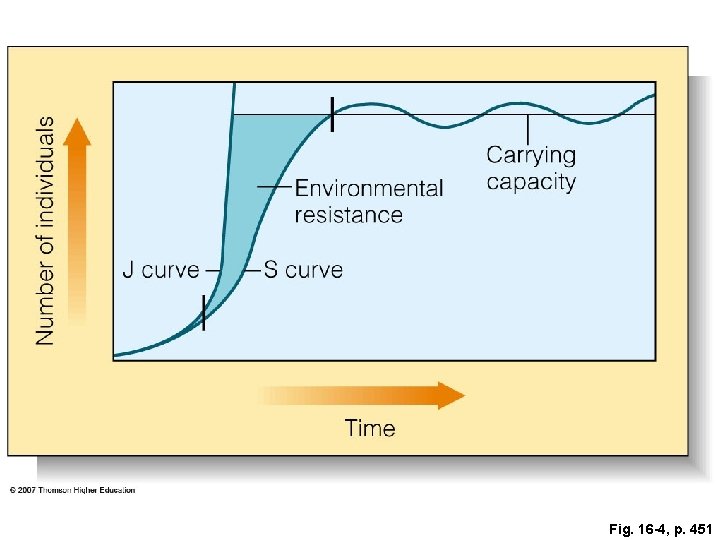
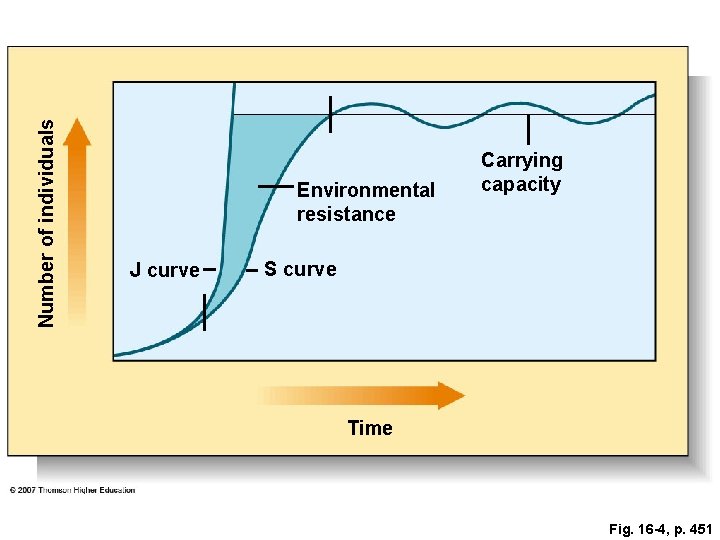
Fig. 16 -4, p. 451
Number of individuals Environmental resistance J curve Carrying capacity S curve Time Fig. 16 -4, p. 451
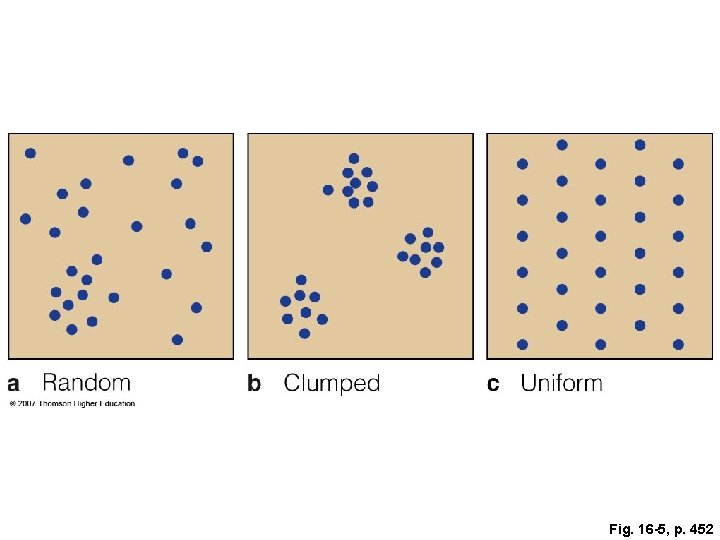
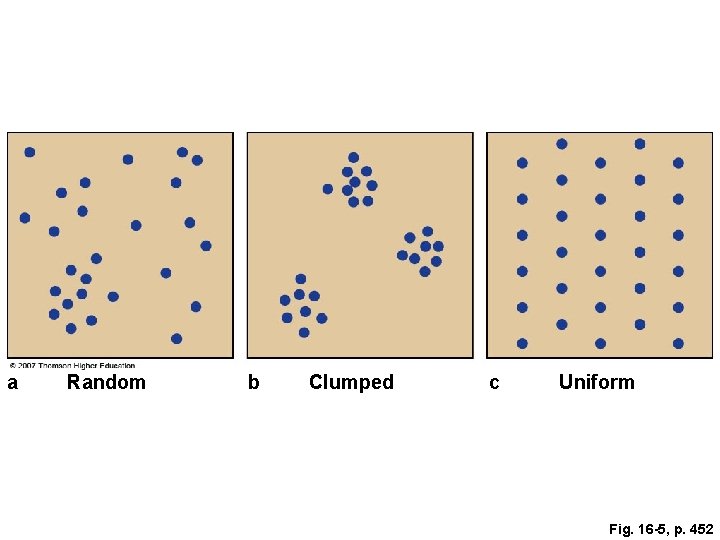
Fig. 16 -5, p. 452
a Random b Clumped c Uniform Fig. 16 -5, p. 452
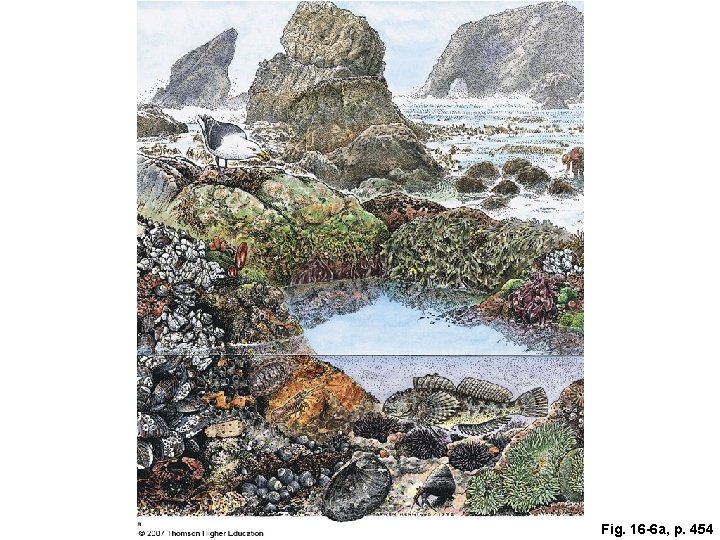
Fig. 16 -6 a, p. 454
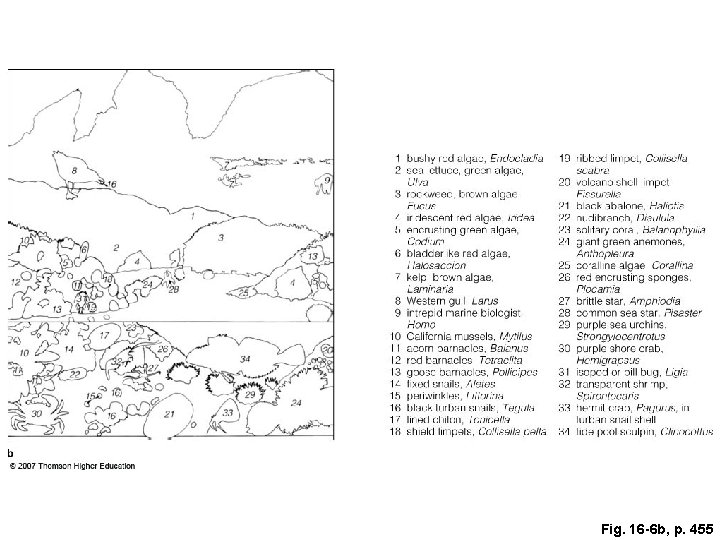
Fig. 16 -6 b, p. 455
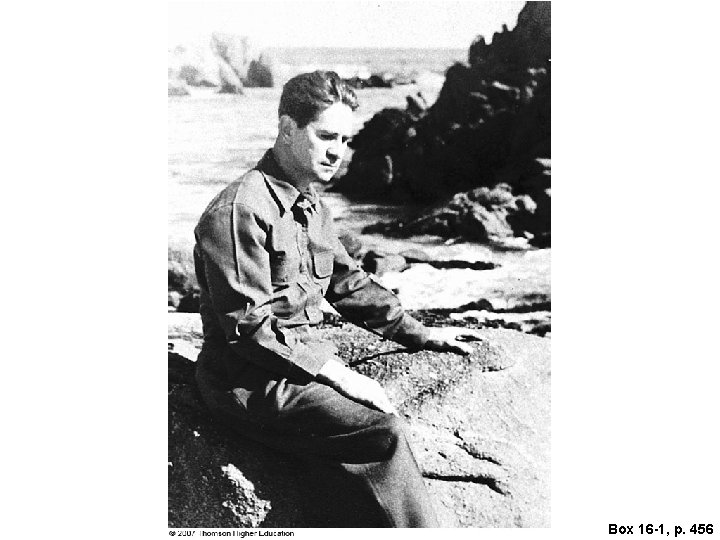
Box 16 -1, p. 456
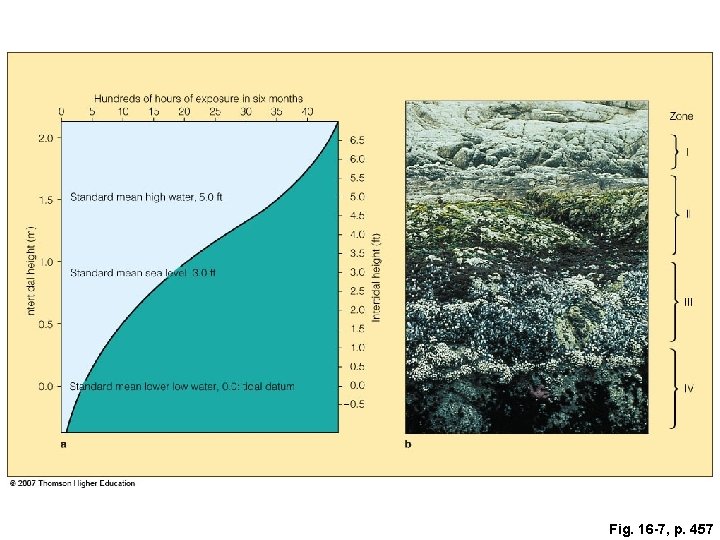
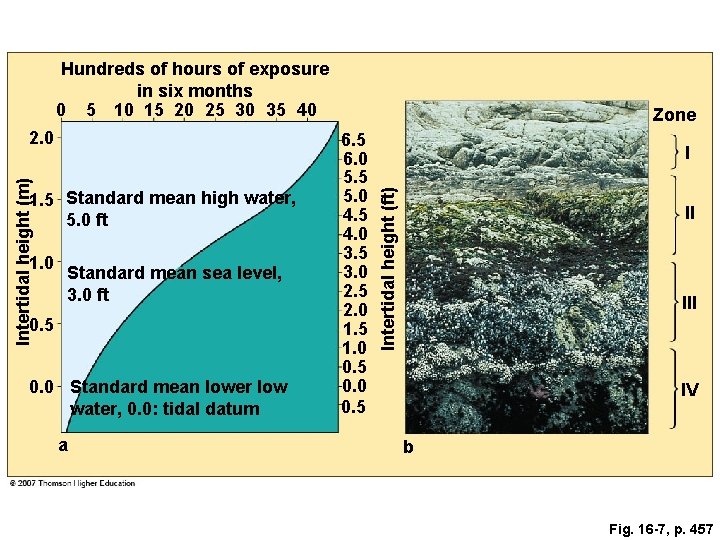
Fig. 16 -7, p. 457
Hundreds of hours of exposure in six months 0 5 10 15 20 25 30 35 40 1. 5 Standard mean high water, 5. 0 ft 1. 0 Standard mean sea level, 3. 0 ft 0. 5 0. 0 Standard mean lower low water, 0. 0: tidal datum a 6. 5 6. 0 5. 5 5. 0 4. 5 4. 0 3. 5 3. 0 2. 5 2. 0 1. 5 1. 0 0. 5 0. 0 0. 5 I Intertidal height (ft) Intertidal height (m) 2. 0 Zone II IV b Fig. 16 -7, p. 457
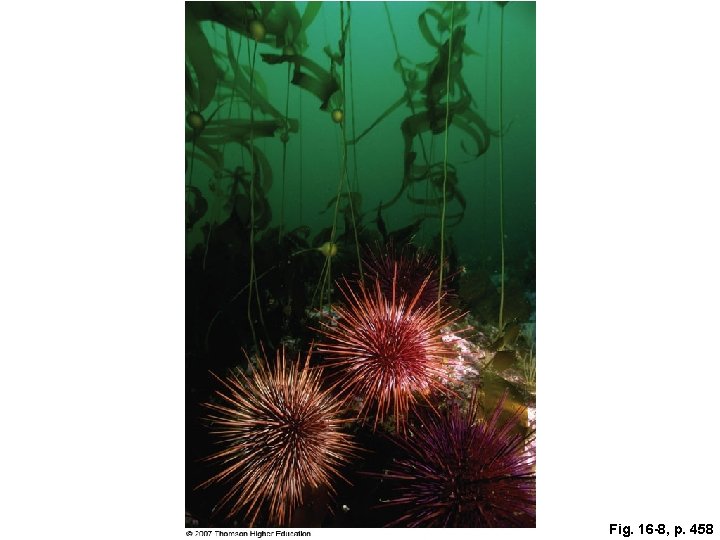
Fig. 16 -8, p. 458
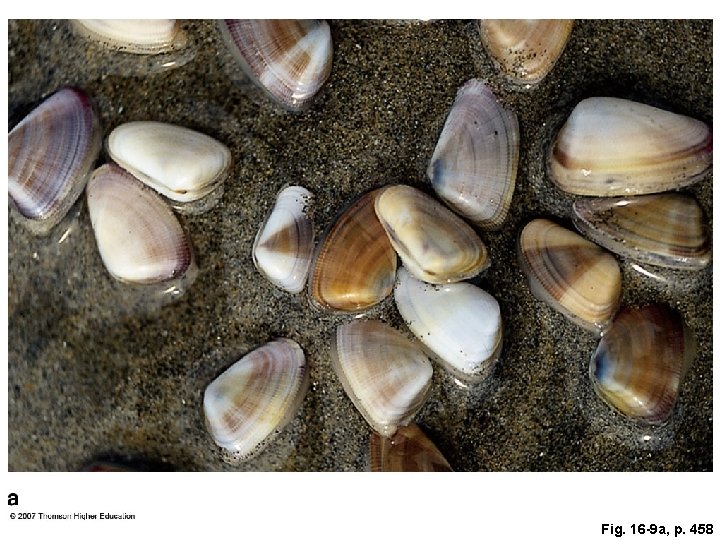
Fig. 16 -9 a, p. 458
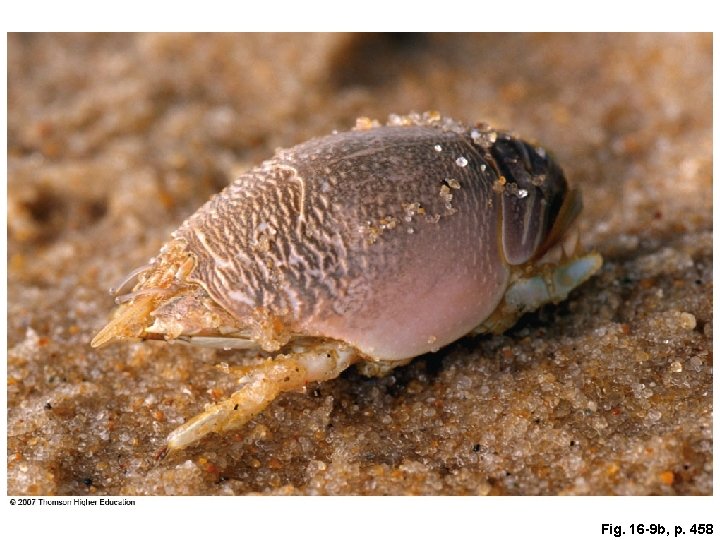
Fig. 16 -9 b, p. 458
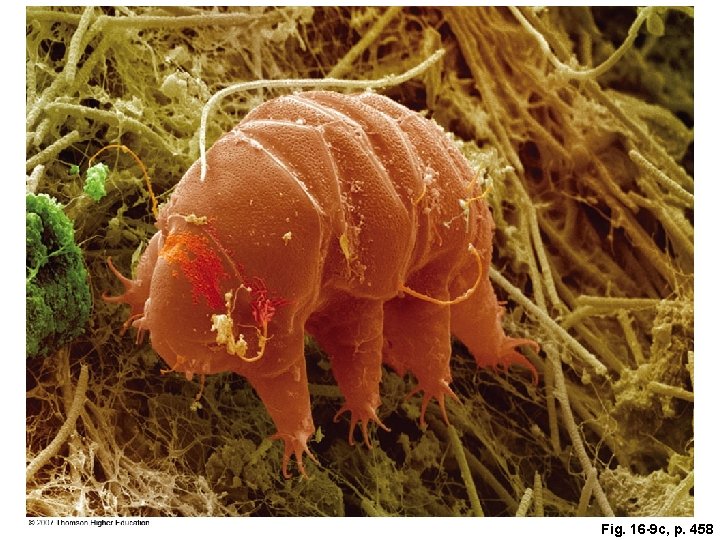
Fig. 16 -9 c, p. 458
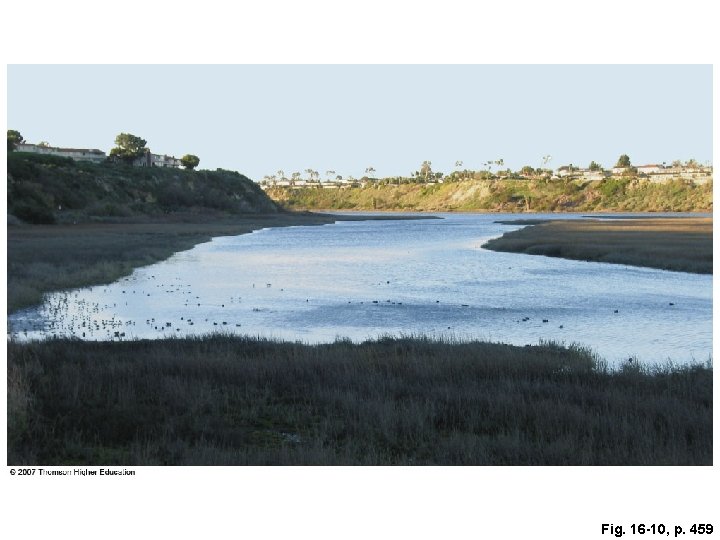
Fig. 16 -10, p. 459
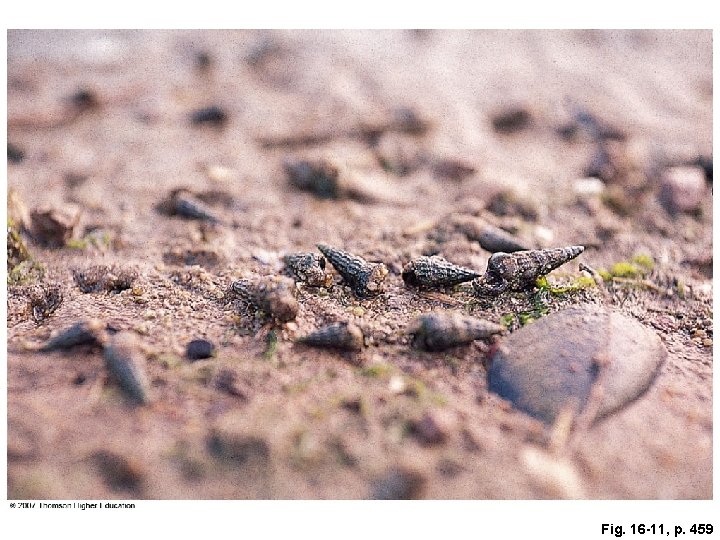
Fig. 16 -11, p. 459
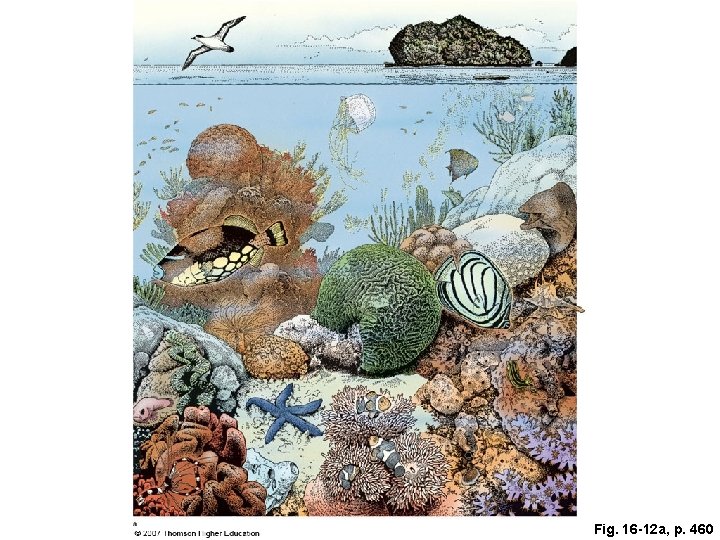
Fig. 16 -12 a, p. 460
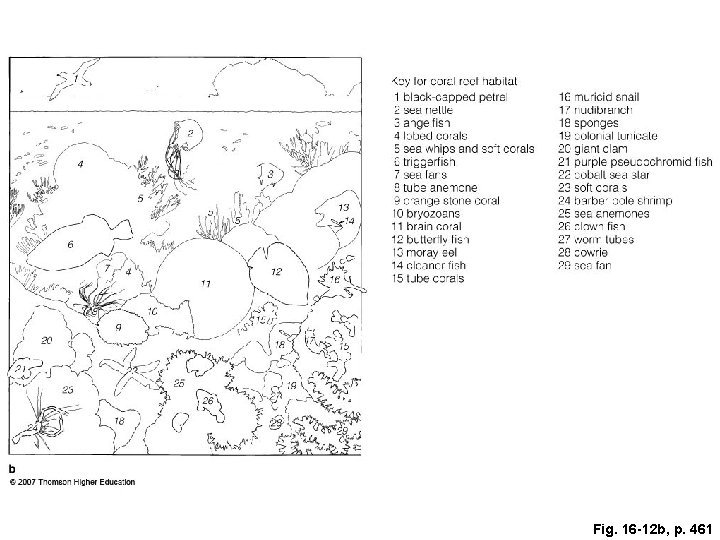
Fig. 16 -12 b, p. 461
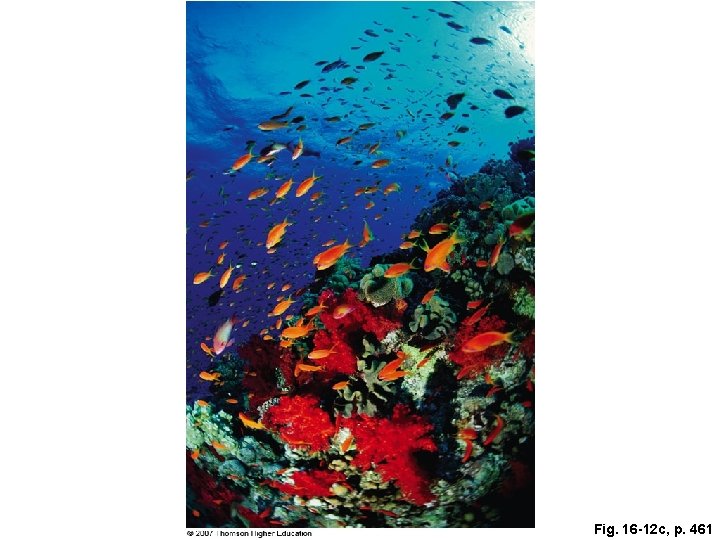
Fig. 16 -12 c, p. 461
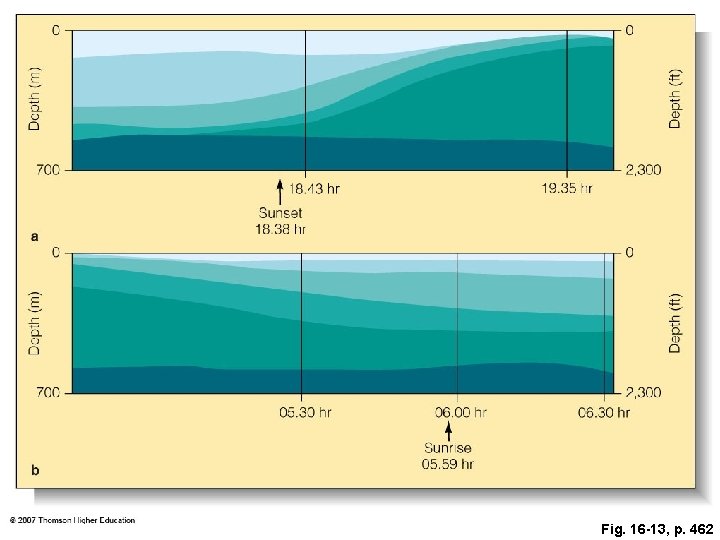
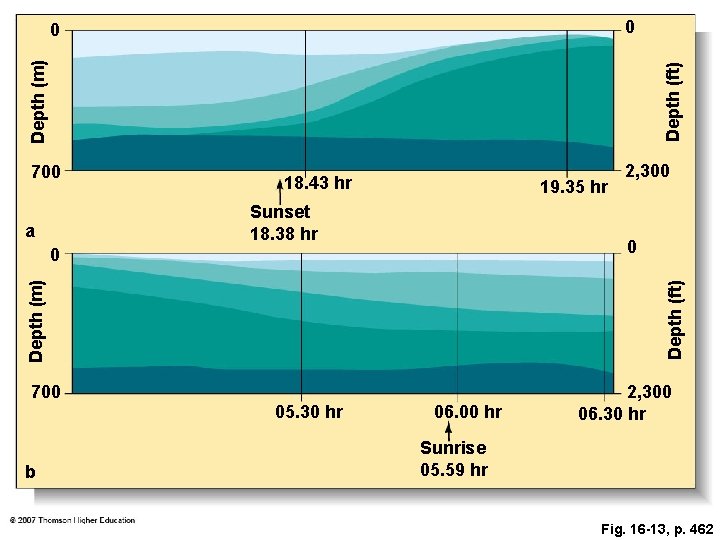
Fig. 16 -13, p. 462
0 Depth (ft) Depth (m) 0 700 18. 43 hr 19. 35 hr Sunset 18. 38 hr a 0 Depth (ft) Depth (m) 0 700 05. 30 hr b 2, 300 06. 00 hr 2, 300 06. 30 hr Sunrise 05. 59 hr Fig. 16 -13, p. 462
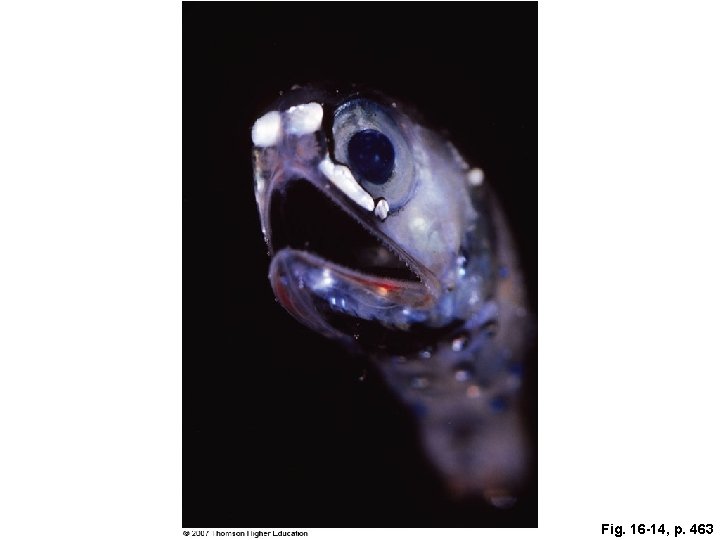
Fig. 16 -14, p. 463
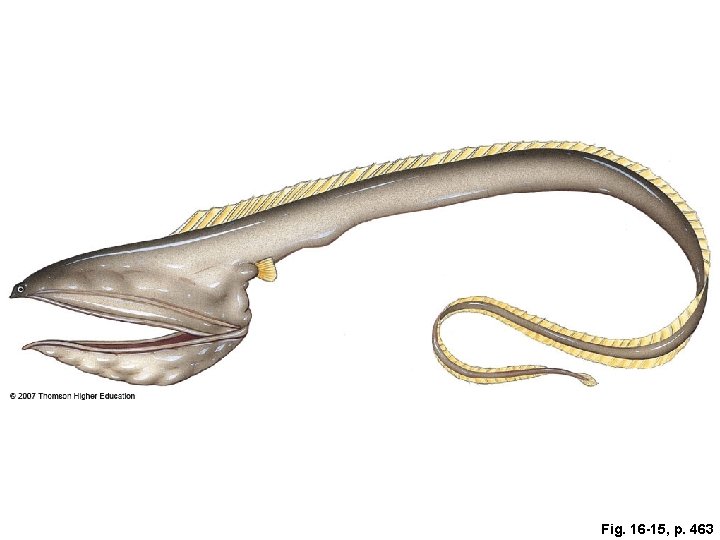
Fig. 16 -15, p. 463
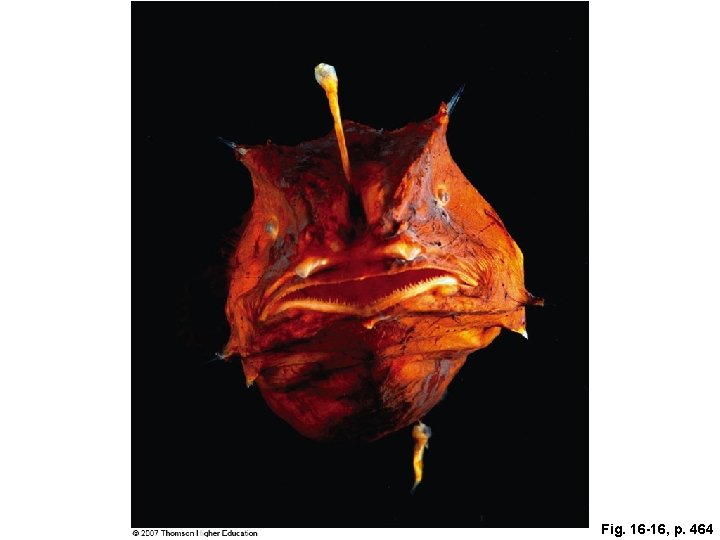
Fig. 16 -16, p. 464
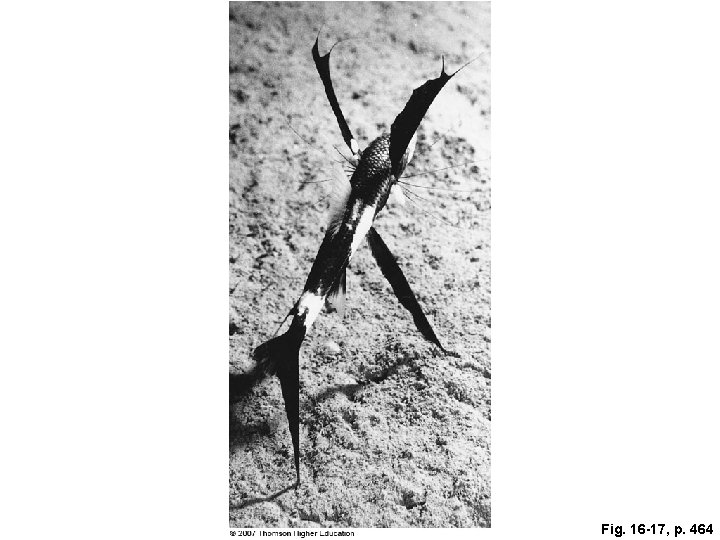
Fig. 16 -17, p. 464
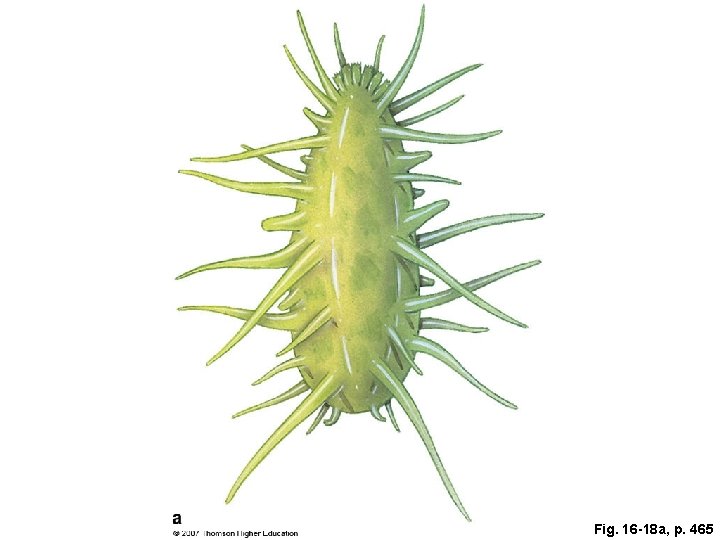
Fig. 16 -18 a, p. 465
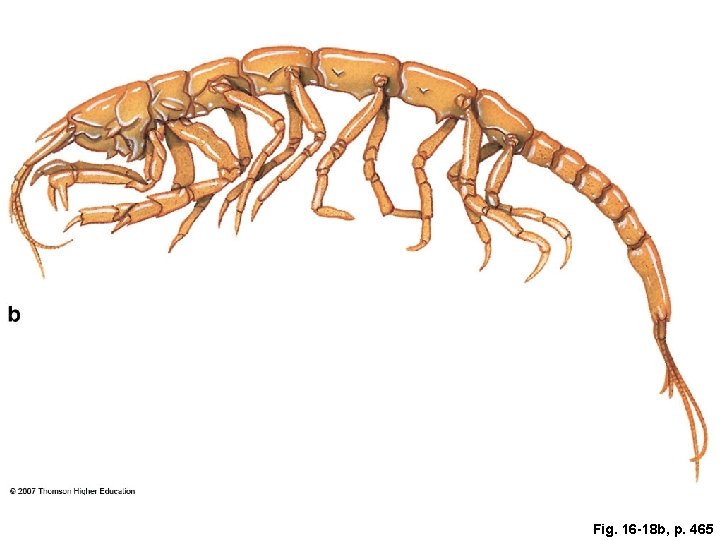
Fig. 16 -18 b, p. 465
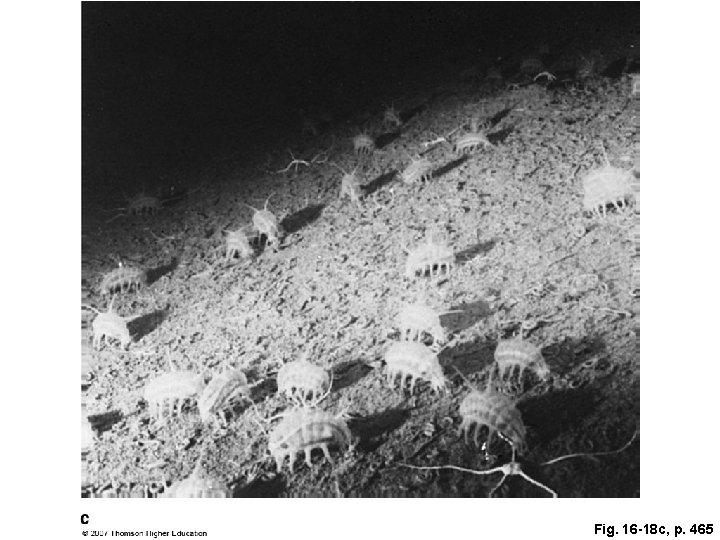
Fig. 16 -18 c, p. 465
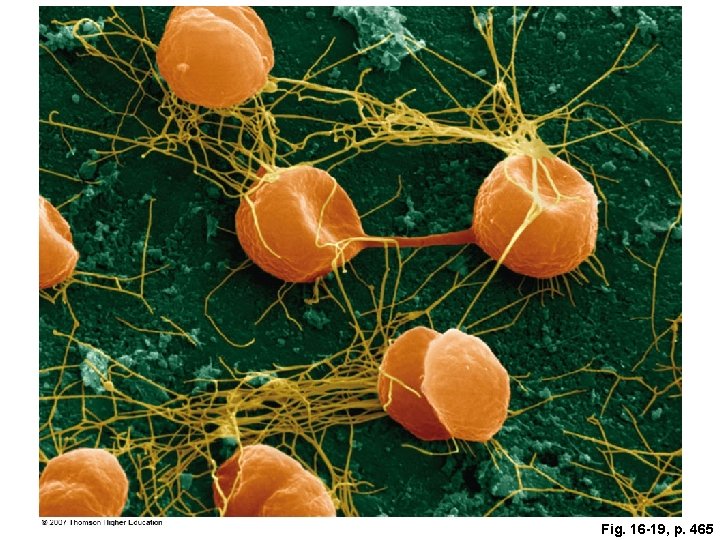
Fig. 16 -19, p. 465
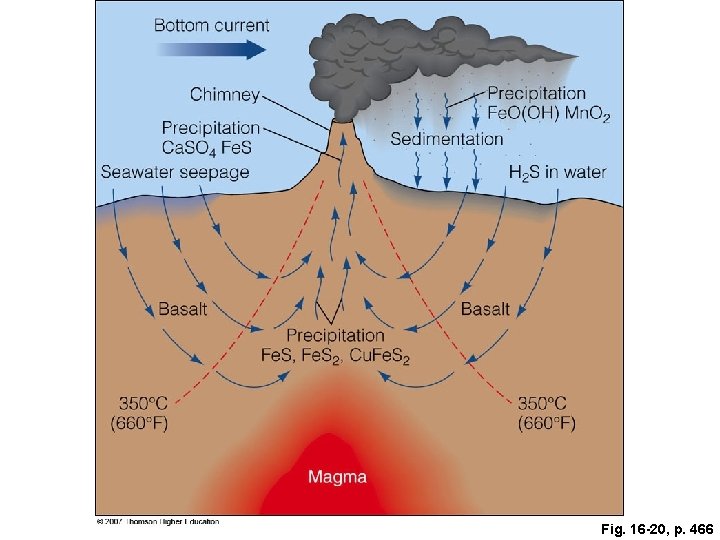
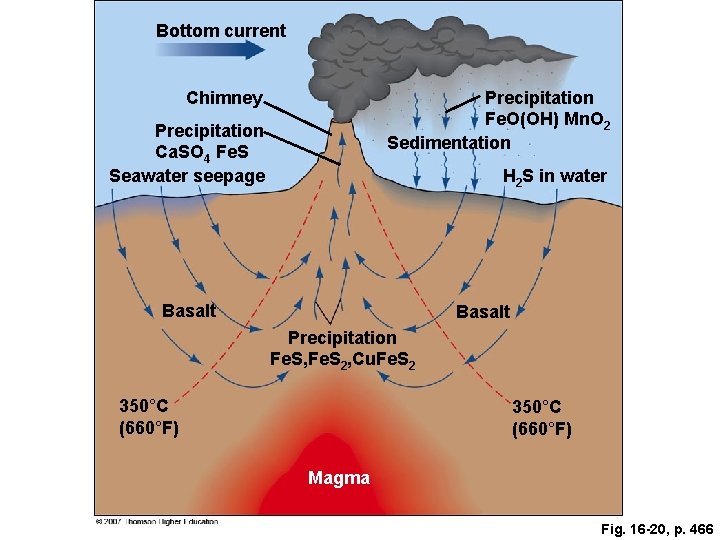
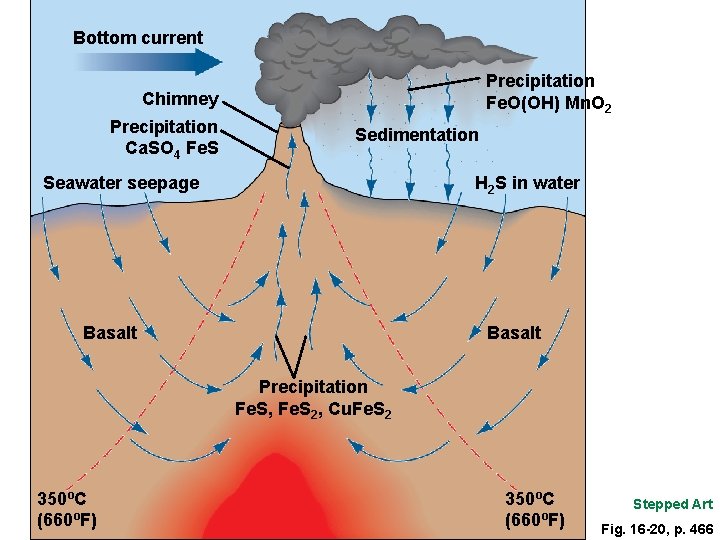
Fig. 16 -20, p. 466
Bottom current Chimney Precipitation Fe. O(OH) Mn. O 2 Sedimentation Precipitation Ca. SO 4 Fe. S Seawater seepage H 2 S in water Basalt Precipitation Fe. S, Fe. S 2, Cu. Fe. S 2 350°C (660°F) Magma Fig. 16 -20, p. 466
Bottom current Precipitation Fe. O(OH) Mn. O 2 Chimney Precipitation Ca. SO 4 Fe. S Sedimentation Seawater seepage H 2 S in water Basalt Precipitation Fe. S, Fe. S 2, Cu. Fe. S 2 350ºC (660ºF) Stepped Art Fig. 16 -20, p. 466
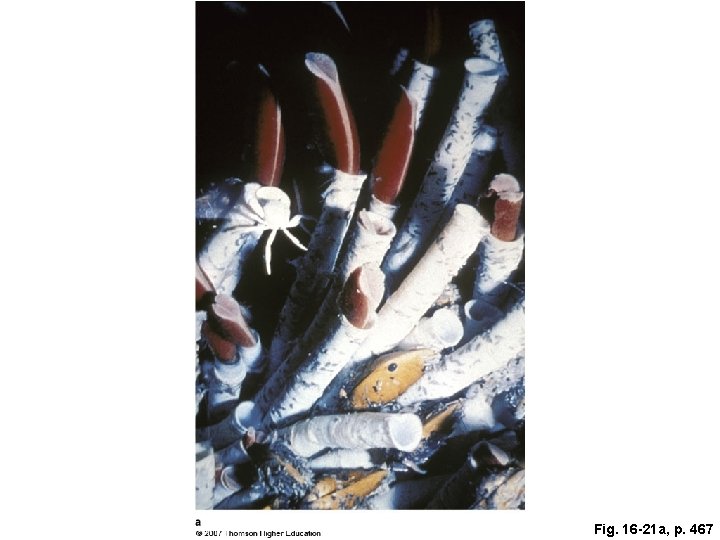
Fig. 16 -21 a, p. 467
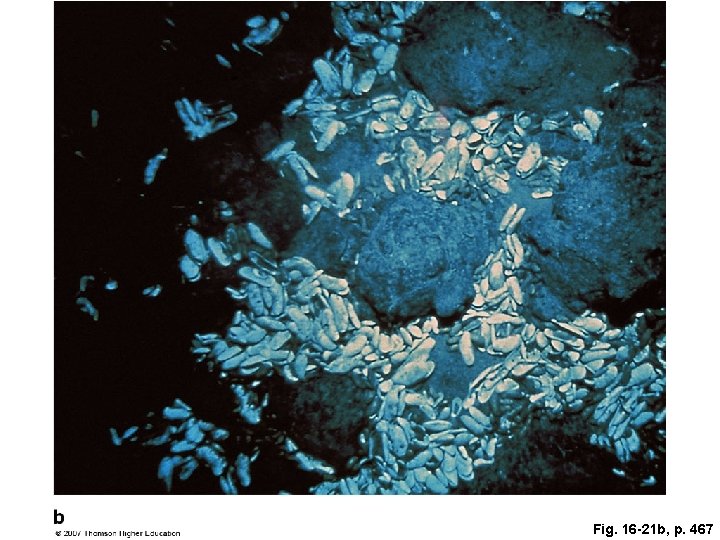
Fig. 16 -21 b, p. 467
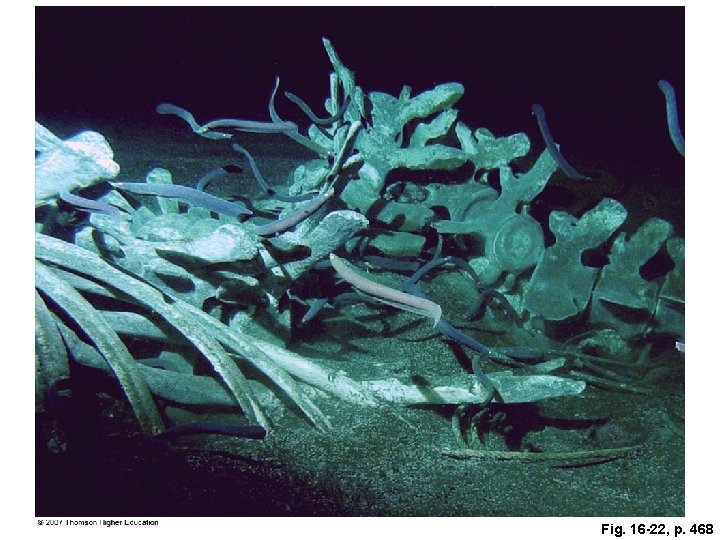
Fig. 16 -22, p. 468
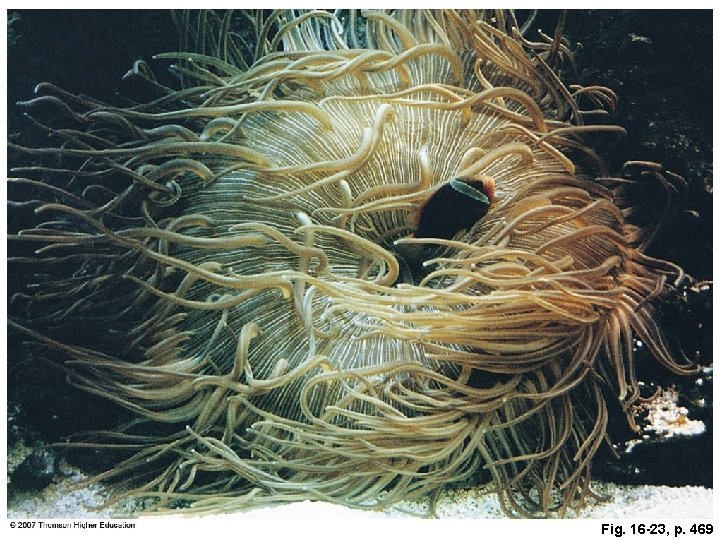
Fig. 16 -23, p. 469
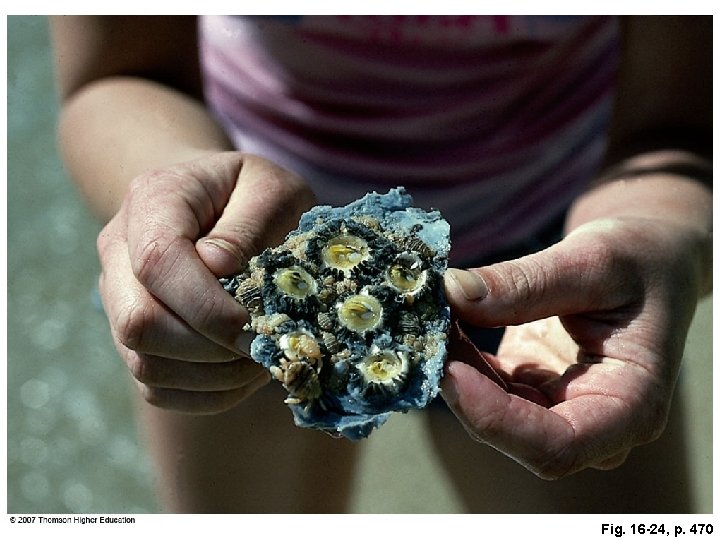
Fig. 16 -24, p. 470