Farmacocinetica ed interazioni farmacologiche dei nuovi anticoagulanti orali


 55: 641– 655")


 all’interno delle cellule. •")
 in pharmacokinetic pathways. T are setting systemic drug levels")


 41: 206–")


 00, 1– 64")
 00, 1– 64")
: 1250 -1259")
- Slides: 41
Farmacocinetica ed interazioni farmacologiche dei nuovi anticoagulanti orali Prof. Alberto Corsini Università degli Studi di Milano
Struttura chimica dei nuovi anticoagulanti orali Ferri N and Corsini A G Ital Cardiol 2015; 16(9 Suppl 1): 3 S-16 S S 1618 2
Parasrampuria DA and Kenneth E. Truitt KE Clin Pharmacokinet (2016) 55: 641– 655
Siti d’azione del warfarin e dei nuovi anticoagulanti orali nella cascata coagulativa Ferri N and Corsini A G Ital Cardiol 2015; 16(9 Suppl 1): 3 S-16 S S 1618 4
Principali caratteristiche farmacocinetiche di warfarin e dei nuovi anticoagulanti orali S 1618 5
Rapid Absorption A single 150 mg dose in 12 healthy males. • Rapid absorption (Cmax in up to 2 hours) • • Food delayed Cmax by 2 hours Surgery delayed Cmax by 4 hours Stangier J. : Clin Pharmacokinet 2008: 47: 285 -295
Foods does not affect the pharmacokinetic profile of apixaban , ◊ Fasted (n = 23); ■ Fed (n = 22 Frost C et al Br J Clin Pharmacol. 2013 Nov; 76(5): 776 -86
Plasma concentrations of edoxaban following single oral doses of 60 mg in volunteers in fed and fasted states Mendell J et al. Journal of Clinical Pharmacology, 2011; 51: 687 -694
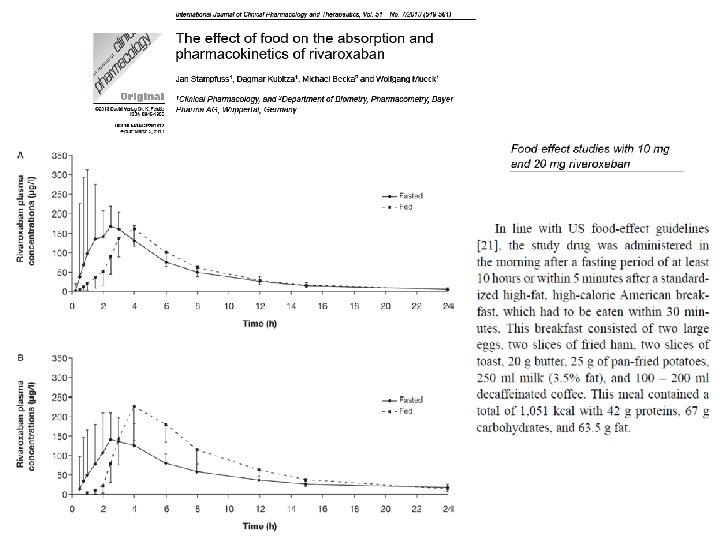
Profilo farmacocinetico dei nuovi anticoagulanti orali in presenza ed assenza di cibo Ferri N and Corsini A G Ital Cardiol 2015; 16(9 Suppl 1): 3 S 16 S
Summary of absorption, metabolism, and excretion of dabigatran, rivaroxaban, and apixaban Gong IY and Kim RB Canadian Journal of Cardiology 29 (2013) S 24 e. S 33 S 1618 11
Le Proteine di Trasporto • Sono delle proteine multifunzionali • Hanno un ruolo fisiologico nella modulazione del trasporto di diverse sostanze quali zuccheri, lipidi, aminoacidi, acidi biliari, steroidi e ormoni.
Le Proteine di Trasporto Captazione: facilitano l’entrata di sostanze (farmaci) all’interno delle cellule. • OATP (organic anion transporting polypeptide) • OAT (organic anion transporter) • PEPT (peptide transporter) Efflusso: esportano sostanze (farmaci) all’esterno delle cellule, anche contro un gradiente di concentrazione. • ABC (ATP binding cassette): – ABCB (P-glicoproteina) – MDR 1 (multidrug resistance protein 1) • BCRP (breast cancer resistance protein)
Roles of membrane transporters (T) in pharmacokinetic pathways. T are setting systemic drug levels Goodman and Gilman’s. The Pharmacological Basis of Therapeutics, 12/E, 2011
Classification of membrane transport mechanisms. Red circles depict the substrate. Size of the circles is proportional to the concentration of the substrate. Arrows show the direction of flux. Black squares represent the ion that supplies the driving force for transport (size is proportional to the concentration of the ion). Blue ovals depict transport proteins. Source: Membrane Transporters and Drug Response, Goodman & Gilman's: The Pharmacological Basis of Therapeutics, 13 e Citation: Brunton LL, Hilal-Dandan R, Knollmann BC. Goodman & Gilman's: The Pharmacological Basis of Therapeutics, 13 e; 2017 Available at: http: //accessmedicine. mhmedical. com/content. aspx? bookid=2189§ionid=166183302 Accessed: February 03, 2018 Copyright © 2018 Mc. Graw-Hill Education. All rights reserved
Model of ABC transporter function. The transporter accepts a solute molecule at the cytoplasmic membrane surface when its nucleotide NBDs are fully charged with ATP. Sequential hydrolysis of the ATP molecules produces steric change and leads to the translocation and release of the solute at the exterior membrane surface. Exchange of ADP for ATP on both NBDs completes the cycle and restores the system for readiness to transport another solute molecule. Source: Membrane Transporters and Drug Response, Goodman & Gilman's: The Pharmacological Basis of Therapeutics, 13 e Citation: Brunton LL, Hilal-Dandan R, Knollmann BC. Goodman & Gilman's: The Pharmacological Basis of Therapeutics, 13 e; 2017 Available at: http: //accessmedicine. mhmedical. com/content. aspx? bookid=2189§ionid=166183302 Accessed: February 03, 2018 Copyright © 2018 Mc. Graw-Hill Education. All rights reserved
P-gp TISSUE DISTRIBUTION C. Marzolini et al. , Clin. Pharmacol. Ther. , 75: 13 -33, 2004
HUMAN DRUG TRANSPORTERS Ho R. H. et al. , Clin. Pharmacol. Ther. 78: 260 -77, 2005
Wessler JD et al. J Am Coll Cardiol 2013; 61: 2495– 502
Wessler JD et al. J Am Coll Cardiol 2013; 61: 2495– 502
FDA 2012
P-gp effect on drug exposure Burnett AE et al J Thrombolysis (2016) 41: 206– 232 S 1618 22
What is P-gp and how does it work? Intestinal apical cell Drug P-gp Blood circulation Metab Gastrointestinal lumen “GUT” Adapted from: J Lin Adv Drug Deliv Rev 2003; 55: 53
Dabigatran etexilate and P-gp When high concentrations of a strong P-gp inhibitor are present in the gut at the time Dabigatran is ingested, this can lead to increased systemic delivery of Dabigatran Intestinal apical cell Dabigatran plasma level Blood circulation Dabigatran etexilate P-gp Metab Gastrointestinal lumen “GUT” Adapted from: J Lin Adv Drug Deliv Rev 2003; 55: 53
Dabigatran etexilate and P-gp - Standard of such DDI studies is to build a study design to show the maximal possible effect - Therefore the results of such DDI studies need to be interpreted with caution Digoxin Amiodarone Verapamil Quinidine Clarithromycin (P-GP substrate) (moderate to strong P-gp inhibitor) (strong P-gp inhibitor)
P-GP Inhibitors Amiodarone: Dabigatran exposure in healthy subjects was increased by 60 % in the presence of amiodarone Verapamil: When dabigatran 150 mg was coadministered with oral verapamil, the Cmax and AUC of dabigatran were increased, but the magnitude of this change differs, depending on timing of administration and formulation of verapamil Clarithromycin: Dabigatan exposure (AUC) in healthy subjects was increased by about 19 % in the presence of clarithromycin without any clinical safety concern Current US labeling for dabigatran with rifampicin a P-GP inducers should be avoided Pradaxa – Summary of Product Characteristics
FDA 2012
Plasma concentration–time profiles of dabigatran after 150 mg dabigatran alone or with co-administration of 120 mg verapamil S. Härtter et al. Br J Clin Pharmacol 75: 1053– 1062 -2012
JA C C VO L. 6 4, 2 0 1 4 Flaker et al. OCTOBER 14, 2014: 1541– 50
Adjusted outcomes of rivaroxaban vs warfarin stratified by amiodarone use at baseline Steinberg BA et al. Heart Rhythm 2014; 11: 925– 932)
Efficacy of edoxaban vs. warfarin in patients with and without amiodarone at baseline
Safety of edoxaban vs. warfarin in patients with and without amiodarone at baseline European Heart Journal (2015) 36, 2239– 2245
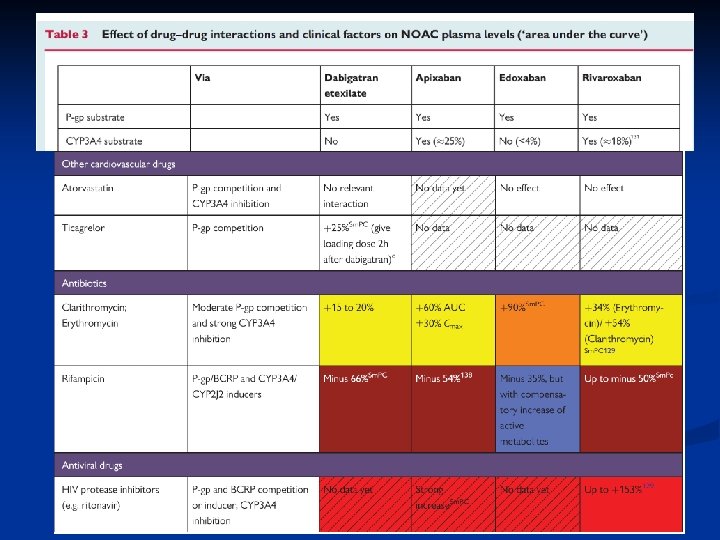
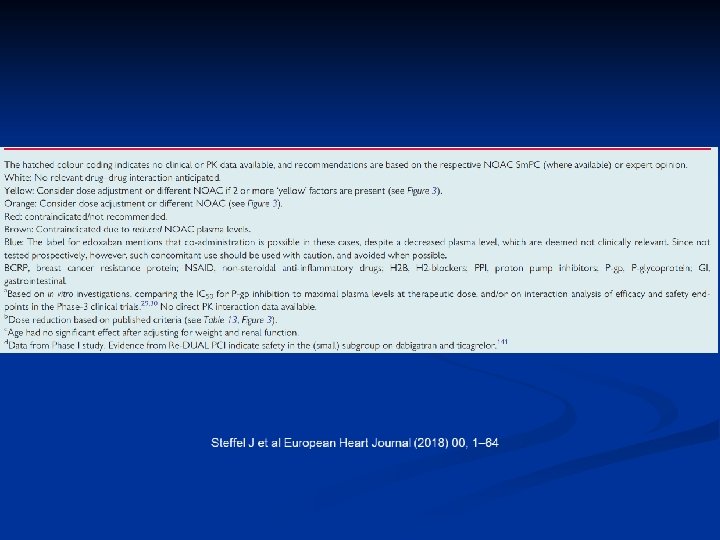
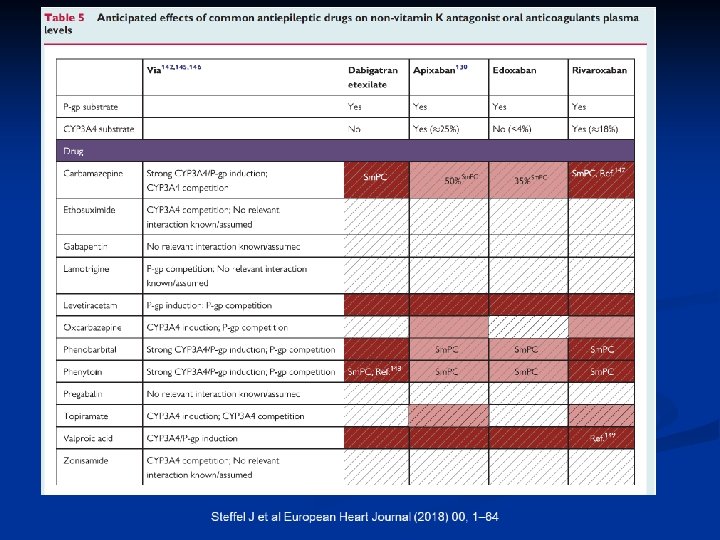
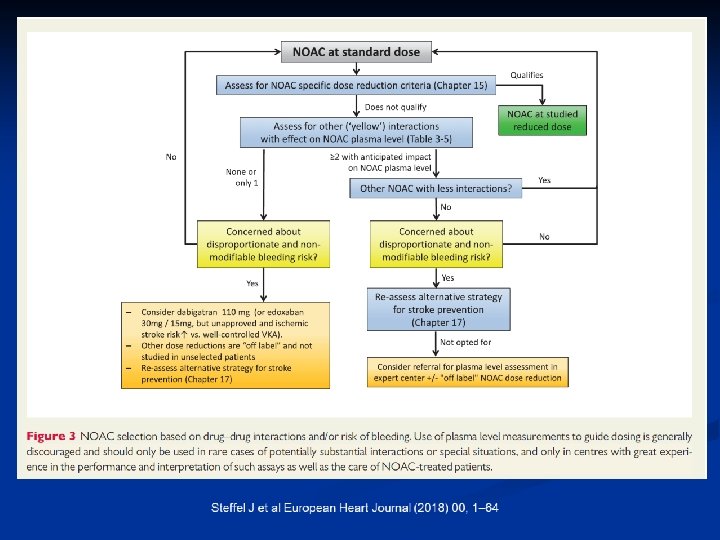
Steffel J et al European Heart Journal (2018) 00, 1– 64
Steffel J et al European Heart Journal (2018) 00, 1– 64
Chang S et al JAMA. 2017; 318(13): 1250 -1259