El Nio Monitoring and Prediction in JMA Contents


 B:Normal (November) band of")
 A-B: Anomaly B:Normal (November)")
")
 (4 S-4 N, 150 W-90 W) Sea Surface")

 : Trade Wind Strong Fluctuation in SST")

 Small (large) value = active (inactive) convective activity Normal (1979")


 Mature stage")
 = vertically averaged temperature in the top 260 m =>")


 Eastward shift of convective precipitation")
 (12 event in 1951~ 1996) D")
 (12 event in 1951~ 1996) Climate")


 OHC Anomaly SST Anomaly")
 E W Tropical Intraseasonal Oscillation (20 N-20 S max. : EQ)")
 OHC Anomaly Westerly burst")


 Since July 2003 Atmospheric GCM ・T 42")
 Cgcm 02 is higher than Cgcm 01 especially up to 5")
 SST Gravest contributor Predictor: Initial")


 Current Diagnosis Region. B +0. 2 (S) => +0.")
 Current Diagnosis")
 The Region B (Nino 3) SST")
 is a interannual climate variation of the")


 : 70 buoys Observation is insufficient Data Assimilation")

- Slides: 73
El Niño Monitoring and Prediction in JMA Contents 1. What is El Niño ? 2. Evolution of 2002/03 El Nino 3. Current system for monitoring and prediction of El Niño in JMA 4. Current El Niño condition and outlook
What is El Nino ?
What is “El Niño” ? “The Boy” in Spanish = “The Chist child” ⇔ “La Niña” = “The girl“ in Spanish (1)warm current each year around Christmas along the coast of Ecuador and Peru : lasting only a few weeks to a month or more (2)condition warmer than normal in the eastern equatorial Pacific at intervals of several years: lasting about 12 -18 months El Nino 1997/98 November 1997
Mean Sea Surface Temperature in equatorial Pacific 1. West > East throughout year, almost constant in West 2. Autumn = Annual minimun in East => Largest difference 3. Largely increase and reach peak in Spring January July April October
Normal condition of the equatorial Pacific Low sea level pressure SST contribute ascending motion to tropical Active Convection rainfall and convective Warm activity High sea level pressure decending motion Walker Circulation water Heavy rain Least rain Mixed Layer (warm) Deep Water (cool) Deepest in the west Westerly Easterly = Trade wind Equator Upwelling Colder water up from deeper level to replace surface water Thermocline Slopes upward the surface farther east From : NOAA homepage
SST in El Niño vs Normal A:El Niño (November 1997) B:Normal (November) band of warm water were A-B: Anomaly Cooler water in East observed along the eq. El Niño : Warmer than normal in the eastern equatorial Pacific
SST in La Nina vs Normal A:La Niña (November 1988) A-B: Anomaly B:Normal (November) Similar pattern as normal warmer than normal in west , cooler in east La Niña : Cooler than normal in the eastern equatorial Pacific
El Niño La Niña El Niño Monitoring Area (4 S-4 N, 150 W-90 W) JMA’s definition The departure of the monitoring area SST from the 1961 -1990 average with five months running mean ・ above +0. 5 C for six months or longer : El Niño ・ beneath – 0. 5 C for six months or longer : La Niña
El Nino Monitoring Area (Region B) (4 S-4 N, 150 W-90 W) Sea Surface Temperature deviation from 1961 -1990 mean (℃) 3 1982/83 La Nina 0 -3 1980 1985 1990 1995 (℃) 3 0 -3 El Nino (℃) 3 0 -3 2000 El Nino / La Nina: ・develop every 2~ 7 years ・last for 12 months ~ 2005 half a year 1997/98
Southern Oscillation = Large-scale fluctuations in air pressure occurring between the western and eastern tropical Pacific other site Pattern reverse every few DARWIN TAHITI Sea surface pressure anomaly at Darwin and Tahiti Sea surface pressure High pressure at one site is almost always concurrent with low at Clearest sign = inverse relationship between of Psea at TAHITI and DARWIN Standeng wave Sea-saw = mass of air oscillation back and forth across the date line in tropics
Atmosphere SOI ( Southern Oscillation Index ) : Trade Wind Strong Fluctuation in SST during El. Nino and La. Nina are accompani ed by SO weak Ocean Region B SST deviation from 1961 -1990 mean warm Negative SO = D>T positive r. B. Positive SO = D<T negative r. B. = Oppsite phase El Nino and SO are deferent manifestati on of single phenomeno cool El Nino Southern Oscillation (ENSO) n
Atmosphere - ocean condition of El Nino Normal El Nino EQ El Nino Weaken trade wind Warm water move eastward From : NOAA homepage Walker Circulation is displaced Active convection area move eastward Upwelling weaken, gradient of thermocline reduced SST increase in the east
Outgoing Long-wave Radiation (OLR) Small (large) value = active (inactive) convective activity Normal (1979 -2000) El Nino (Nov. 1997) Inactive Active
850 h. Pa Wind Weak Trade wind
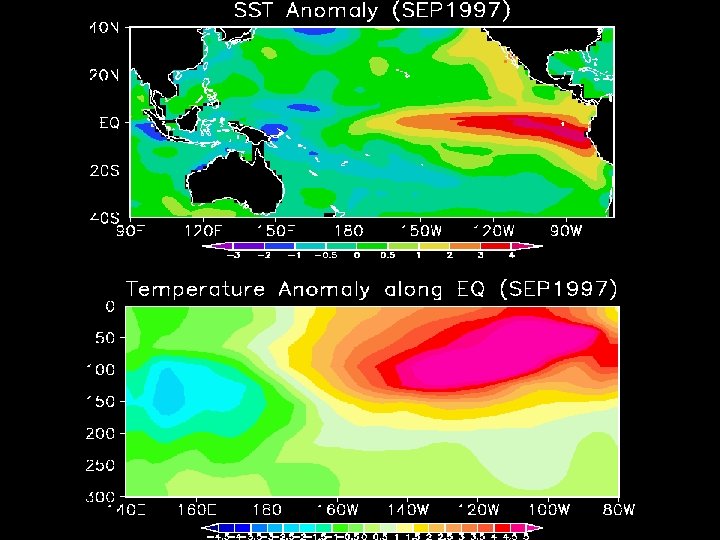
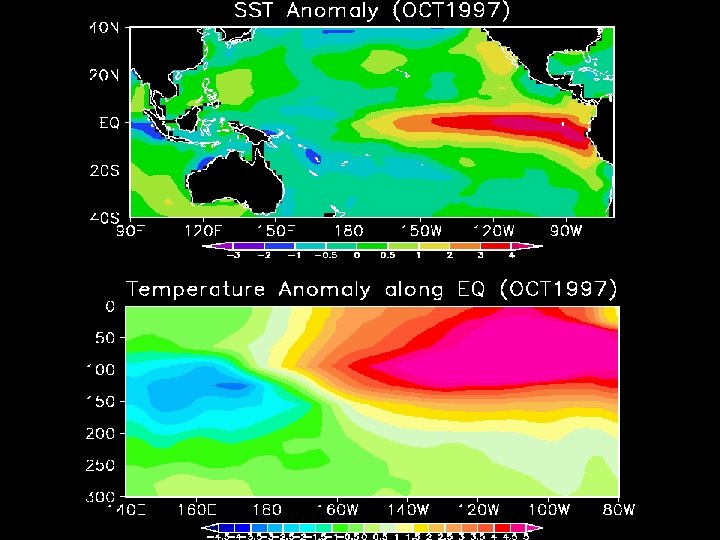
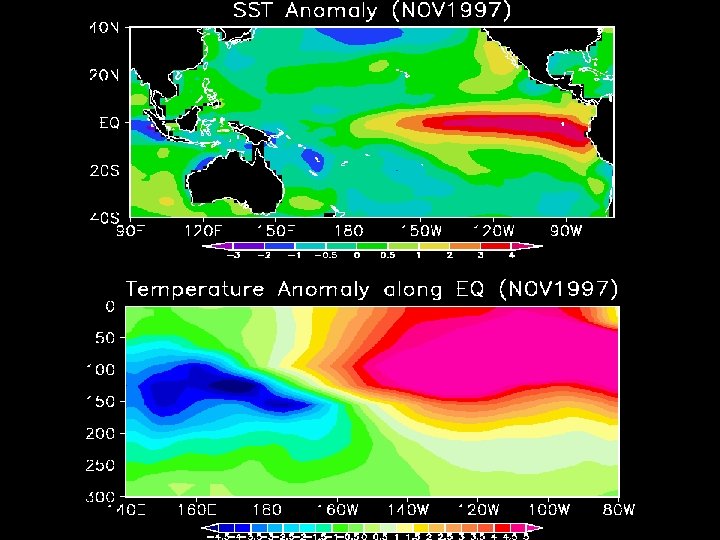
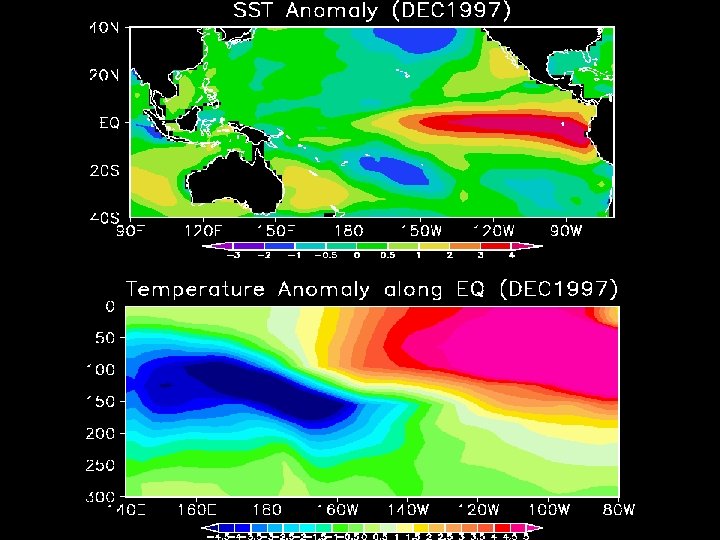
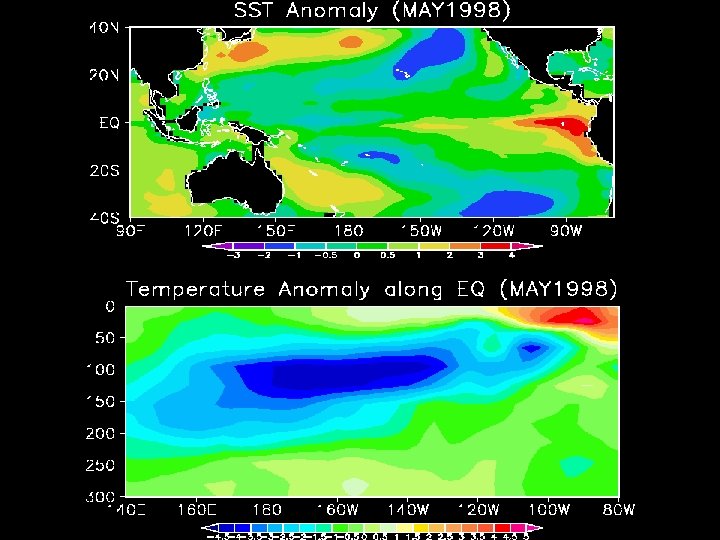
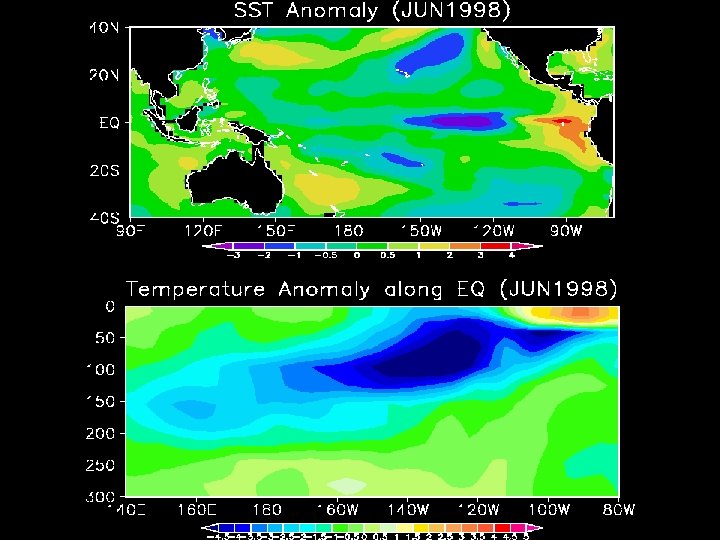
Subsurface temperature along EQ in El Nino Normal Nov. 97 Anomaly Sea surface temperature Subsurface temperature
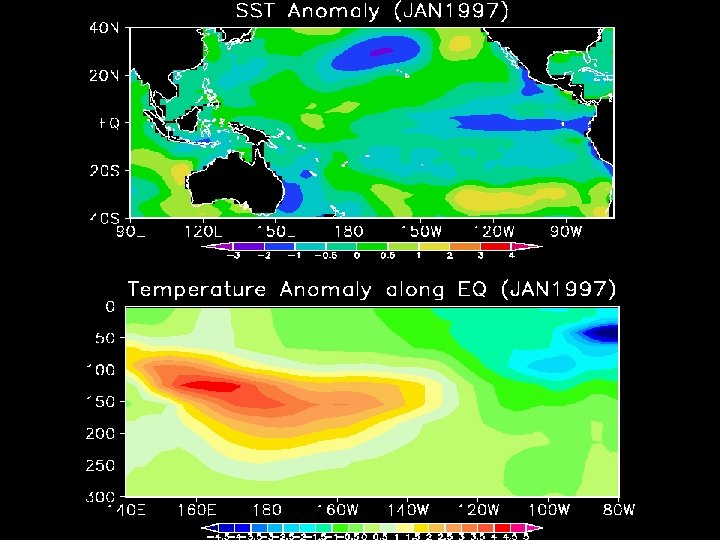
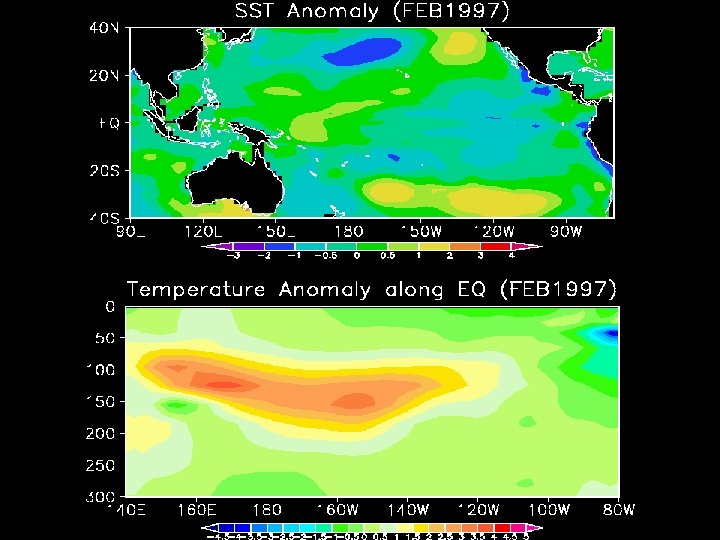
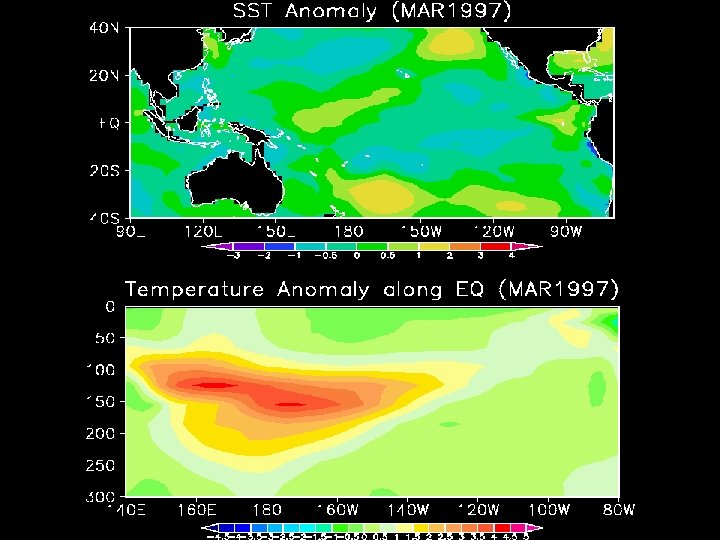
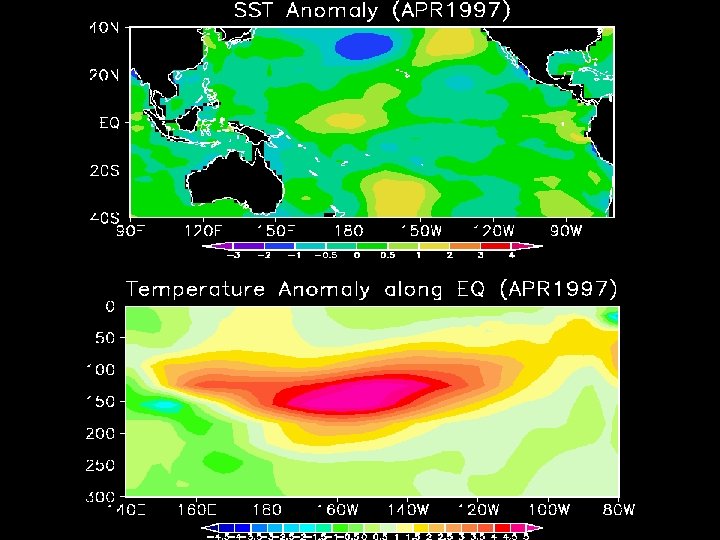
Subsurface temperature along EQ in El Nino Temperature Early stage (Jan 97) Mature stage (Nov 97) Latter stage (May 98) Thermocline is where Anomaly contour is crowed (green) Themocline is deeper than normal in western and central eq. Pacific = deep pool of warm ocean Depth of themocline reduce in western and central eq. Pacific and increase in East subsurface temp. increase in central and eastern Pacific Depth of themocline and subsurface temp. reduce throughout most of eq.
OHC (Ocean Heat Content) = vertically averaged temperature in the top 260 m => depth of thermocline OHC anomaly
Ocean and Atmosphere in Normal vs El Nino SST Normal El Nino Warm in West Cool in East Increase in East convective western Pacific Move to precipitation central Pacific Trade wind Strong (easterly) weak Walker Circulation Over western Pacific Displaced eastward Warm water Deep in West Move eastward Thermocline Slant from East to West Reduced gradient
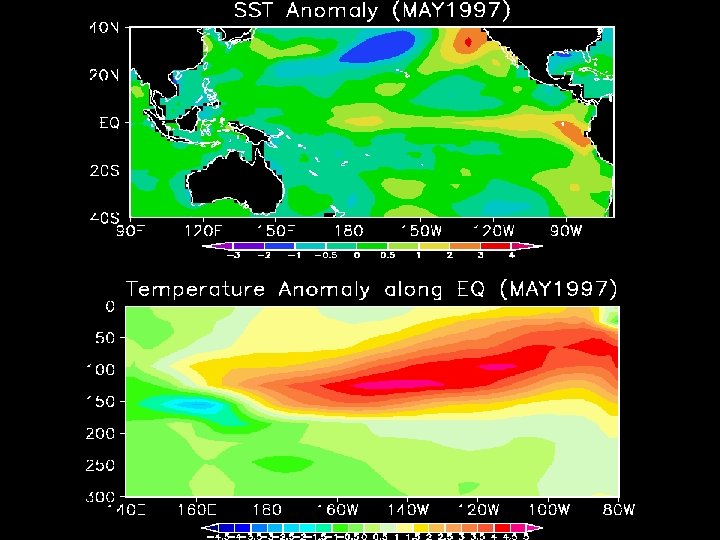
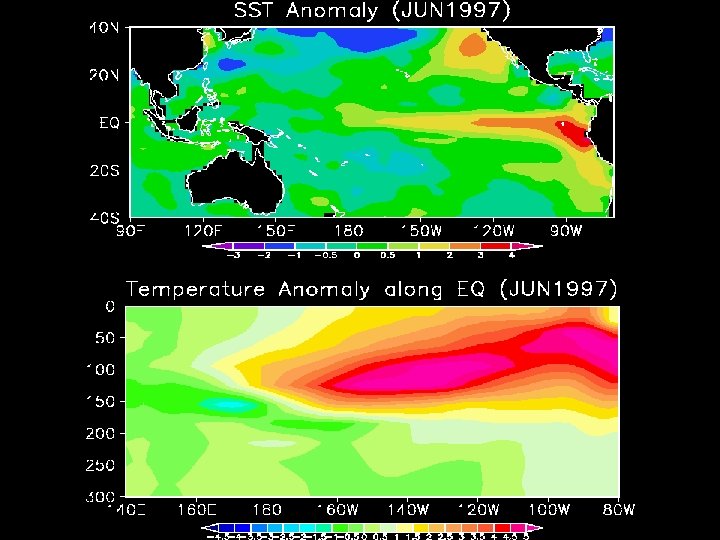
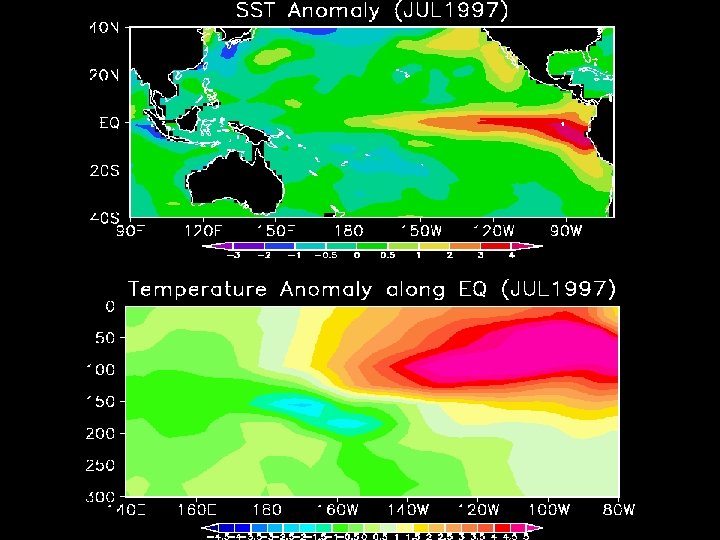
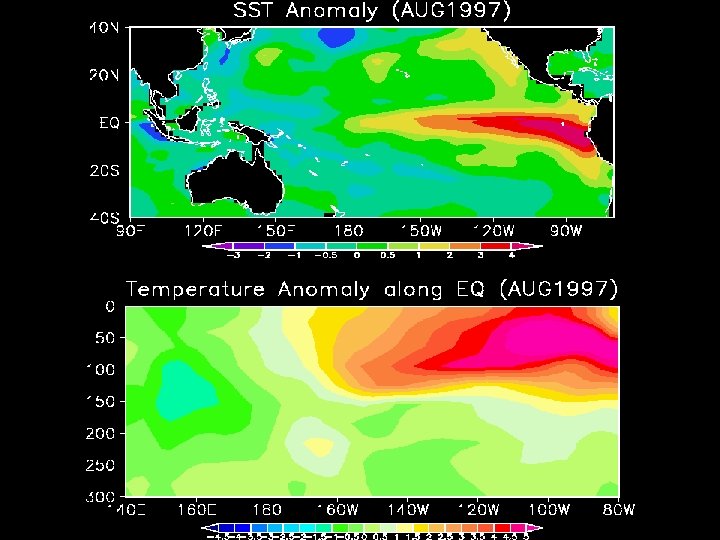
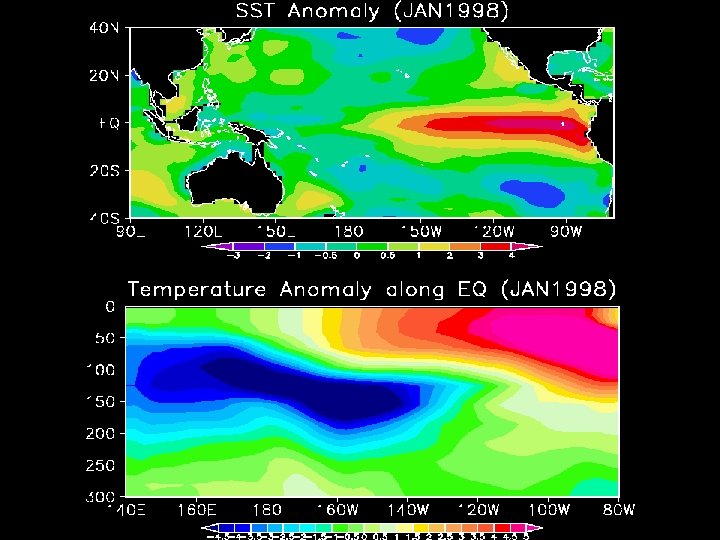
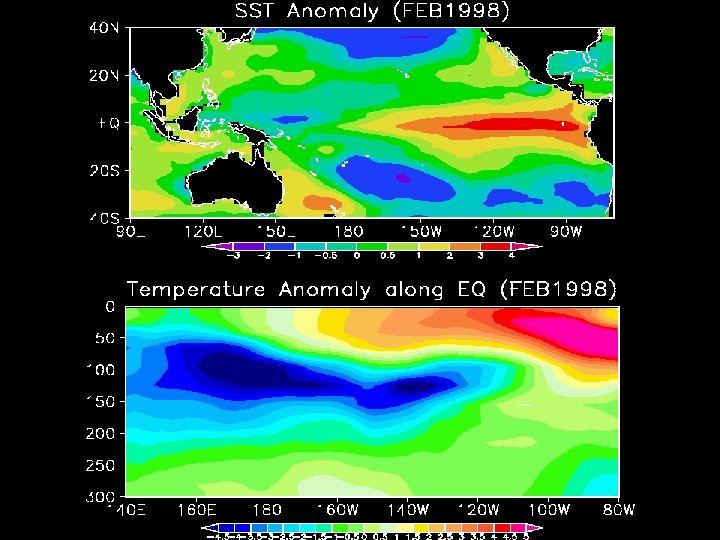
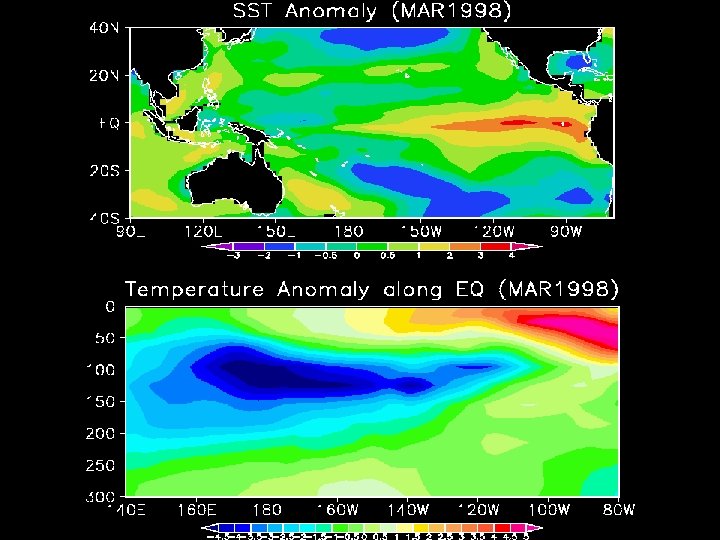
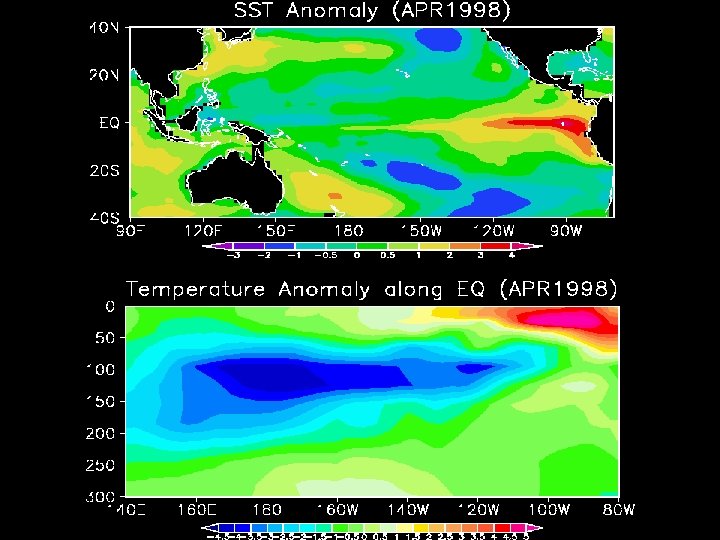
Mature Stage of 1997/98 El Niño animation Sea Surface Temperature Ocean Temperature along Equator Ocean Subsurface changes lead to El Niño evolution
Back to START Next
El Nino impact to the world climate • Tropics(Directly) Eastward shift of convective precipitation → Dry condition in the west and flood in the west Indian monsoon precipitation less than normal (northern summer) Normal El Nino EQ • Mid-latitude (Indirectly)
World Climate in El Nino (December - February) (12 event in 1951~ 1996) D A TA A DAT NO N O NO A DAT Climate characteristics i n E N S O W a r m E v e n t s Hot Cold Wet Dry Comvective precipitation area move eastward = Dryer in the central eq. Pacific, wetter in the western eq. Pacific Warm in almost the tropical region
World Climate in El Nino (June - August) (12 event in 1951~ 1996) Climate characteristics i n E N S O W a r m E v e n t s Drier than normal in west and wetter in the central. Hot Cold Wet Dry Indian monsoon is weak increased heat over central and eastern eq. Pacific affect atmosphere circulation in subtropics and mid-latitude (ex. jet-stream move southward in boreal summer)
How does El Nino influence the climate in your country ?
El Niño and Climate in Japan Late End of the Rainy Season (June - July) Cool Summer Warm Winter
Evolution of El Nino 2002/03
Time Series of Region A and Region B SST anomaly Compared with past events +1. 4 C Nov. 02 4 seasons 2002/03 El Nino: • Moderate in Region. B • Highest in Region A +1. 2 C Nov. 02
SST anomaly in equatorial Pacific • Mar 2002 … negative anomalies Mar. 02 were found in east and temporally positive anomalies off South America Nov. • Late May 2002… due to MJO 02 (strong westerly wind), SST anomaly in East increase (> +1 C appeared) • Nov 2002 … positive anomalies > +1 C was widely found in the Mar. center and east. 03 • Mar 2003 … negative anomalies appear in east and positive anomaly shrink in central.
Subsurface Temperature anomaly • Mar 2002 …positive anomalies Mar. 02 (occurred by MJO in Dec. 01) reached coast of South America • July, August, October 2002… MJO induced eastward propagation of Kelvin wave. SST Nov. 02 anomaly in East increase • Nov 2002 … negative anomalies spread in west and contrast between E and W was distinct. • Mar 2003 … positive anomalies Mar. 03 shrank in east and negative anomalies partly appeared.
OLR anomaly December. 2002 120 E Consistent with ongoing El Nino 180 90 W Only for 2 months Drier than normal : Indonesia, northern and eastern Australia Wetter than normal : central equatorial Pacific, southeast South America
2002/03 El Nino evolution along the equator (time-longitude cross section) OHC Anomaly SST Anomaly time mature
Madden-Julian Oscillation (MJO) E W Tropical Intraseasonal Oscillation (20 N-20 S max. : EQ) These fluctuations in tropical rainfall often go through an entire cycle in 30 -60 days => Assiciated global –scale, zonally oriented circulation cell propagated eastward Convergence at low level Easterly ot Westerly sometimes contribute to El Nino Schematic diagram of lon-time structure of MJO Africa Indonesia America
2002/03 El Nino evolution along the equator (time-longitude cross section) OHC Anomaly Westerly burst associated with MJO induced eastward propagation of Kelvin wave time U 850 Anomaly
El Nino 2002/03 vs Composite map 2002/03 warmer in Central and cooler than Eastern 2002/03 (SON) composite (SON) SST anom aly OHC anom aly SST: 72, 76, 82, 86, 91, 97 OHC: 86, 91, 93, 97
Current system for monitoring and prediction of El Niño in JMA
JMA EL NIÑO MONITORING AND PREDICTION SYSTEM Observation Sea Surface Height Ocean Initial Cond. TAO/ TRITON XBT Ocean Data Assimilation System (ODAS) Wind Stress Dynamical Seasonal Forecast Atmos. Initial Cond. Argo SST NINO. 3 SST Anomaly Heat and Water Fluxes Coupled Atmosphere Ocean General Circulation Model Analysis of latest atmosphere-ocean conditions Official SST Forecast Model Output Statistics (MOS) El Niño Monitoring Prediction ・ El Nino Monitoring Report ・ “El Nino Monitoring and Outlook” (WMO/DDB & TCC) ・Climate Monitoring Report ・Monthly Ocean Report Public Announcement
New El Niño Forecast Model (JMA-CGCM 02) Since July 2003 Atmospheric GCM ・T 42 L 40 ・Arakawa-Schubert ・Si. B Flux Adjustment One Day Coupling ・ 2. 5 x 0. 5~ 2. 0 L 21 ・Bryan-Cox type ・Closure Mixing Ocean GCM Data Assimilation System T 213 L 40 Run twice a month LAF, 6 initials Coupled GCM 7 Months Forecast Initialization MOS Corrected NINO 3 SSTA IAU (Incremental Analysis Update) Ocean Data Assimilation System Observed Temp, Salinity, Sea Level Height 3 DVAR Assimilated data
Regin. B(NINO 3) Cgcm 02 is higher than Cgcm 01 especially up to 5 -9 months Cgcm 02 is smaller than Cgcm 01 Regin. D(NINO. WEST) Skill of Region B is better than that of Region D ACC ( 1988 Feb-2000 Jan, 96 exps. ) RMSE
MOS: Stepwise Regression Analysis Predictand: Regin B (Nino 3) SST Gravest contributor Predictor: Initial B SST ②OHC (6 S, Eq, 6 N) (160 E, 6 N) Zonal Wind Stress (Eq) SST (Eq) ① B SST Forecast B SST OHC (6 S, Eq, 6 N) Zonal Wind Stress (Eq) SST (Eq) Lead time Choose 11/73 predictor Calendar month
Region B SST Skill Before & after MOS correction ACC MOS remain above 0. 8 until 9 months lead time ACC RMSE(℃) RMSE Lead Time (month) Calculated from 96 hindcast MOS reduce and remain 0. 5 C up to 8 months lead time ACC (CGCM) ACC (MOS) RMSE (CGCM) RMSE (MOS)
El Nino product on TCC Homepage
El Niño Information of JMA • WMO Distributed Data Bases (http: //ddb. kishou. go. jp) • Tokyo Climate Center HP (http: //okdk. kishou. go. jp)
Renewal of TCC Homepage ! December 2003 ~ Main changes : Addition of Summary Enhancement of Atmosphere Component OLR Index (OLR-DL, U 200 -CP, U 850 -CP) 200 h. Pa velocity potential anomaly 850 h. Pa zonal wind anomaly
We recommend JMA El Nino Product, because. . .
ADIOS A EL NIÑO, HOLA A LA NIÑA May 19, 2003 — On the heels of El Niño’s departure the world could soon be facing the return of La Niña say scientists at NOAA. Based on current sea surface temperatures and recent atmospheric and oceanic trends in the tropical Pacific, it is likely that La Niña will develop over the next few months……. Press release of NOAA
After that, how did the equatorial Pacific SST Anomalies change ? • During May to June, a temporary cooling was found in the east. • In the late September to October, positive anomalies appeared across the central and eastern equatorial Pacific. NO La Nina !! Shall we get El Nino products from many sources ? El Nino 2002/03
Current Diagnosis and Outlook
Sea Surface Temperature (October 2003) Current Diagnosis Region. B +0. 2 (S) => +0. 6(O)
Sub Surface Temperature (October 2003) Current Diagnosis
El Nino Outlook (Nov. 2003 – May 2003) The Region B (Nino 3) SST is likely to be around normal in this autumn and winter. It will possibly be slightly warmer than normal afterwards until May 2004.
Summary • El Nino Southern Oscillation (ENSO) is a interannual climate variation of the ocean-atmosphere system in the tropical Pacific. • Each El Nino/La Nina event is different. • Would you check the El Nino product of TCC Homepage, always or sometime ?
Thank you
JMA EL NIÑO MONITORING AND PREDICTION SYSTEM Monthly El Niño Monitoring Report Long- range Forecast of Japan El Niño Forecasting model (Atmosphere and Ocean Coupled Model) Twice a month Ocean Data Assimilation System Every day Global Ocean Surface and Subsurface Data
Subsurface observation data(September. 2003) : 70 buoys Observation is insufficient Data Assimilation
SST Monitoring in Regions A-D Region A: 4 N-4 S, 160 E-150 W Region B: 4 N-4 S, 150 W-90 W Region C: EQ-10 S, 90 W-80 W Region D: 14 N-EQ, , 130 E-150 E