Perceptual Linear Predictive Analysis of Speech Hynek Hermansky


 – 與預強的效果相同? Frequency domain 13")

 – Power spectrum不需要再開平方 • ek")

 Time domain 17")


- Slides: 31
Perceptual Linear Predictive Analysis of Speech Hynek Hermansky, Speech Technology Laboratory, J. Acoustical Society of America, April 1990 報告 : 張志豪
Outline • Linear Prediction Coding • Mel-scale Frequency Cepstral Coefficients • Perceptual Linear Predictive 2
Introduction • Feature Extraction – Speech Production Model • Linear Prediction Coding – Speech Perception Model • Mel-scale Frequency Cepstral Coefficients 3
Linear Prediction Coding • Property – Approximates the areas of high-energy concentration while smoothing out the fine harmonic structure and other less-relevant spectral details. – The approximated high-energy spectral areas often correspond to the resonance frequencies of the vocal tract (formants). 4
Linear Prediction Coding • Autocorrelation – Levinson-Durbin Recursion • Impulse Response Speech Time domain LPC Time domain Speech and LPC Frequency domain 5
Linear Prediction Coding • Disadvantage – LPC approximates speech equally well at all frequencies of the analysis band. This property is inconsistent with human hearing. Beyond about 800 Hz, the spectral resolution of hearing decreases with frequency. – The amplitude levels typically encountered in conversational speech, hearing is more sensitive in the middle frequency range of the audible spectrum. – The spectral details of speech are not always preserved or discarded by LPC analysis according to their auditory prominence. 6
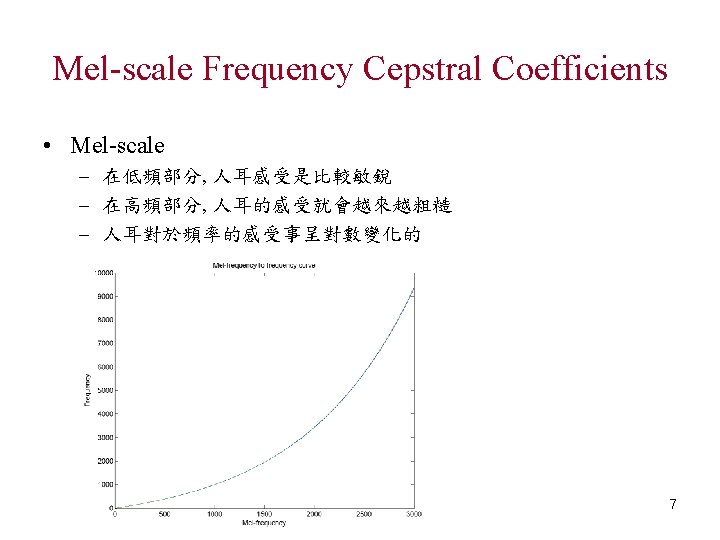
Mel-scale Frequency Cepstral Coefficients 8
Mel-scale Frequency Cepstral Coefficients • Discrete cosine transform – 由frequency domain轉回time domain – frequency of frequency 9
Perceptual Linear Predictive MFCC LPC 11
Perceptual Linear Predictive • Equal-Loudness Preemphasis 12
Perceptual Linear Predictive • Equal-Loudness Preemphasis (count. ) – 與預強的效果相同? Frequency domain 13
Perceptual Linear Predictive • Intensity-Loudness Power Law – Frequency domain 14
Perceptual Linear Predictive • Intensity-Loudness Power Law (count. ) – Power spectrum不需要再開平方 • ek = (float)sqrt((double)(t 1*t 1 + t 2*t 2)); – Filter bank後的值不需要取log • bins[bin] = log((double)t 1); 15
Perceptual Linear Predictive • Inverse Discrete Fourier Transform – 由frequency domain轉回time domain Frequency domain Time domain 16
Perceptual Linear Predictive • Autoregressive Modeling (LPC) Time domain 17
Experiment 3 6 9 MFCC 54. 21 55. 11 55. 37 PLP_05 39. 01 39. 32 39. 88 PLP_10 52. 55 53. 02 PLP_12 53. 79 54. 49 54. 94 PLP_14 53. 62 53. 94 54. 27 *PLP_12 31. 65 32. 08 32. 03 18
Thanks 19
Thanks 20
Choice Of The Order Of The Autoregressive PLP Model • Introduction • Spectral distortion measure of PLP • Single-frame phoneme identification • Isolated-word identification 21
Choice Of The Order Of The Autoregressive PLP Model • Introduction – With increasing model order the spectrum of the all-pole model asymptotically approaches the auditory spectrum. 22
Choice Of The Order Of The Autoregressive PLP Model • Spectral Distortion Measure of PLP – group-delay distortion measure • The spectral peaks of the model are enhanced and its spectral slope is suppressed. • The group-delay metric is more sensitive to distance between narrow peaks. • The group-delay measure is more sensitive to the actual value of the spectral peak width. – Exponential measure • Allows for various degrees of peak enhancement. 23
Choice Of The Order Of The Autoregressive PLP Model • Single-Frame Phoneme Identification – As is evident, the PLP identification accuracy increases up to about the 5 th order of the autoregressive model and then starts decreasing with further increases in the model order. 24
Choice Of The Order Of The Autoregressive PLP Model • Isolated-Word Identification 25
Choice Of The Order Of The Autoregressive PLP Model • Discussion – The advantage of the PLP over the LP is that it allows for the effective suppression of the speaker-dependent information by choosing the particular model order. – The linguistically relevant speaker-independent cues lie in the gross shape of the auditory spectrum. This gross shape can be characterized by the one or two spectral peaks of the 5 th-order PLP model. 26
PLP and Human Hearing • Introduction • Formant Frequency Changes • Sensitivity to Bandwidth Changes • Sensitivity to Spectral Tilt • Sensitivity to F 0 • Discussion 27
PLP and Human Hearing • Introduction – The first three formant frequencies is approximately constant in relative frequency. The LP analysis is in conflict with it. 28
PLP and Human Hearing • Formant Frequency Changes 29
PLP and Vowel Perception • Introduction • The effective second formant • Spectral peak integration theory • The significance of the bandwidth B 2 • Discussion 30
31