Coupling TRIGRS and TOPMODEL in shallow landslide Prediction


 By combining an infinite-slope stability calculation with a transient, one-dimensional analytic")
 Consider the lateral flow 2) Compare the result of")

 Grid-based Regional Slope-")
(Beven. et al. , 1979) a: Specific area tan β :slope")


 地質區 Kz(m/s) D 0(m 2/s) Iz(m/s) zone 1 9× 10 -4")


 地質區 γs(k. N/m 2) Cmax(k. Pa) ψ(°) zone 1 18. 2")

 success curve and prediction curve")
 Stable (FS ≧")


- Slides: 26
Coupling TRIGRS and TOPMODEL in shallow landslide Prediction 報告者:李浩瑋 指導教授:李錫堤 2011. 5. 19
Out line n. Introduction n. Literature review n. Objective n. Methodology n. Result and discussion n. Conclusion 2
Landslide Susceptibility Analysis Qualitative analysis: Ø Empirical method Quantitative analysis: ØStatistic method -based upon long-period landslide inventories ØDeterministic analysis -strength parameters, -failure depth -groundwater conditions 3
Literature review 1) By combining an infinite-slope stability calculation with a transient, one-dimensional analytic solution for pore pressure response to transient rainfall infiltration. [Iverson, 2000; Baum et al. , 2002; Savage et al. , 2003; Godt, 2004] 2) TRIGRS models were used for slope stability analysis. [吳佳郡, 2006;王姵兮,2007;鐘欣翰,2008] 1) Concept of topographic index, ln(a/tanβ). [Beven and Kirby, 1979] 2) A hydrological simulation based on a modified version of TOPMODEL was developed to estimate the temporal groundwater level for conducting the slope-instability analysis. [李光敦, 2009] 4
Objective rainfall-triggered shallow landslide 1) Consider the lateral flow 2) Compare the result of trigrs in shallow landslide prediction Lat era l 5
Research Process Start Precipitation T=0, Input initial groundwater table Hydrological model KZ、D 0、IZ TRIGRS (1 -D infiltration) Simulating groundwater table Infinite slope model Prediction of shallow landslide T=t+dt TOPMODEL (Modification of water table) T=final t End 6
TRIGRS (Transient Rainfall Infiltration stability Model (Baum et al. , 2002) Grid-based Regional Slope- Infiltration model (Iverson, 2000) D 0 = Ksat/C 0 D 0 =飽和水力擴散率 Ksat = 飽和水力傳導係數 C 0 =土壤最小之含水量 Z= z/cos α Conceptual sketch of the hydrological model Z =鉛直方向 in TRIGRS(after Godt 2004) z =垂直坡面方向 7
TOPMODEL(TOPgraphy based hydrological MODEL)(Beven. et al. , 1979) a: Specific area tan β :slope Zj Zj :Depth to groundwater table Z: Average depth of the groundwater table m : Recession constant λ : mean value of the Topographic index 8
Infinite slope 文獻回顧 FS>1 Stable FS<1 Unstable 未來 作 TOPMODEL Calculate Zj Schematic diagrams of the coupled hydrologicalslope instability model(after Lee 2009) 9
Study area 文獻回顧 10
Event Analysis Event-based Triggered Landslide Inventory Typhoon Aere Rainfall Records 2004/8/23~8/25 GAOYI Station 11
hydrological parameters 鍾(2008) 地質區 Kz(m/s) D 0(m 2/s) Iz(m/s) zone 1 9× 10 -4 1. 8× 10 -3 10 -8 zone 2 10 -3 2× 10 -3 10 -8 zone 3 2× 10 -3 4× 10 -3 10 -8 12
Event Analysis Antecedent rainfall 2004/8/20 Initial water table 2004/8/22 Typhoon Aere 13
Groundwater level simulation Rainfall period 14
Geologic parameters 鍾(2008) 地質區 γs(k. N/m 2) Cmax(k. Pa) ψ(°) zone 1 18. 2 8 36 zone 2 19. 6 9 28 zone 3 18. 9 9 27 15
Model result Rainfall period 16
Model validation Model validate • Error matrix (Stehman, 1997) success curve and prediction curve (Chung and Fabbri, 1999) 全區資料 網格數 Unstable (FS < 1) Stable (FS ≧ 1) Unstable N 1 N 2 stable N 3 N 4 總體正確率=(N 1+N 2)/(N 1+N 2+N 3+N 4) Success rate 分類結果網格數 Area in percentage Different rainfall situations for validation ─Using Typhoon Masta Rainfall(2005)
Result Success Rate Curve Predict 121809 Actual Unstable (FS < 1) Stable (FS ≧ 1) Unstable 625 446 stable 11530 108488 山崩組正確率58. 35%、非山崩組正確率89. 59%,總體正確率89. 10% 18
Model validation Typhoon Aere Typhoon Masta Prediction Success Rate Curve Typhoon Aere Mastalandslidemap 19
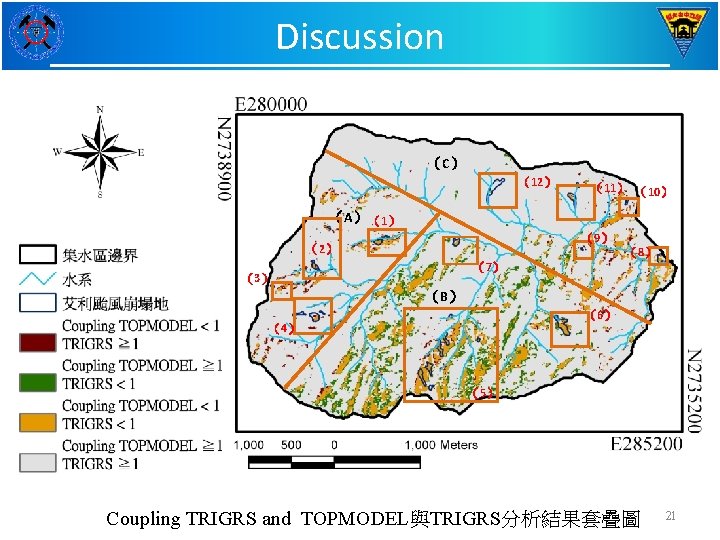
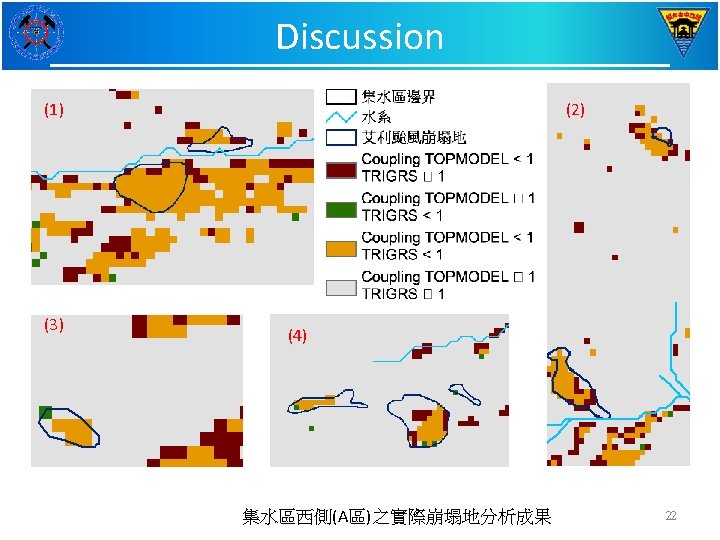
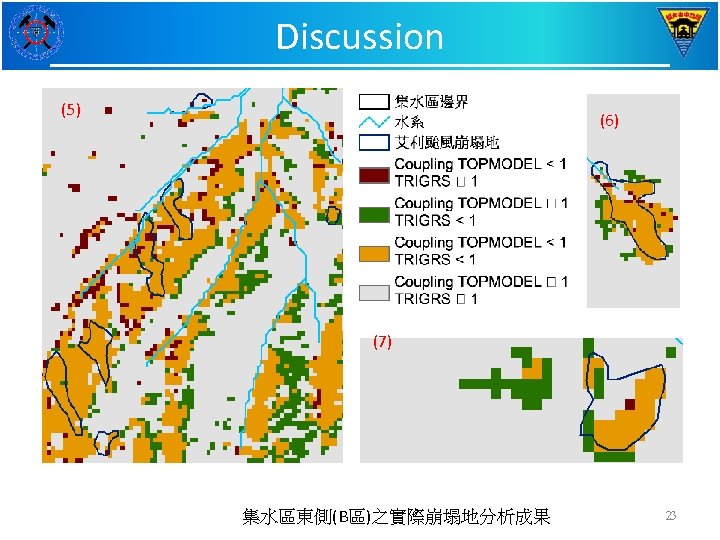
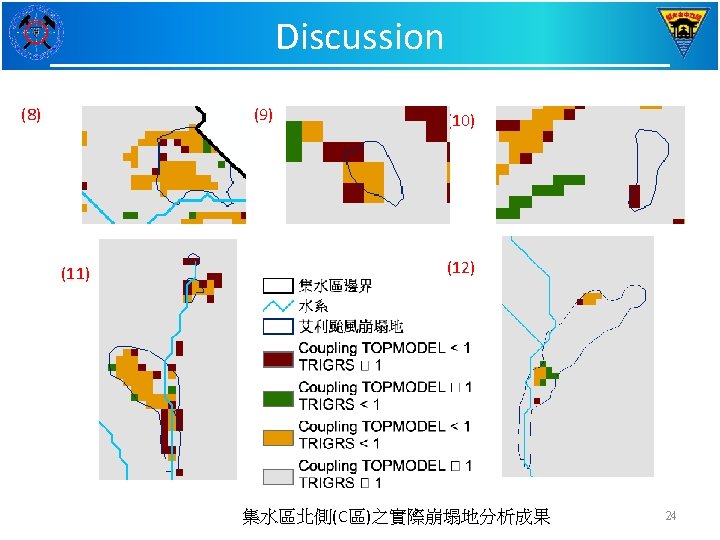
Discussion Success Rate Curve TRIGRS 山崩組正確率 非山崩組正確率 總正確率 Success Rate Curve Coupling TRIGRS and TOPMODEL TRIGRS 結合TRIGRS 與TOPMODEL 56. 7% 87. 4% 87. 2% 58. 4% 89. 5% 89. 1% 20
Thank you for your attention