CHILD POVERTY REPORT OVERVIEW AND MAIN FINDINGS Jeffrey


")
")

")


 Age <15")

 BY CONSUMPTION QUINTILE (PCT SUFFERING) Disability")
 Consumption quintile Disability 1")

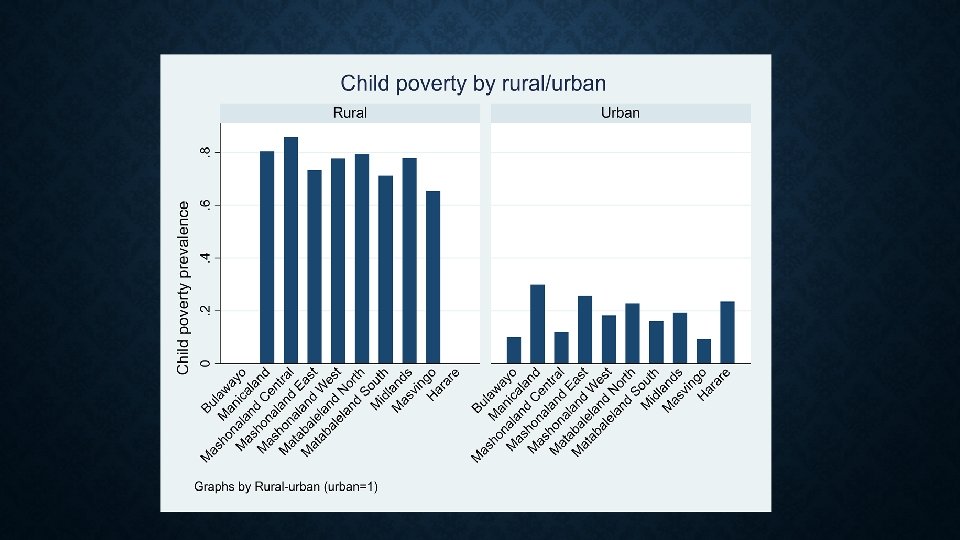
 Rural Urban")


 • Schooling attendance and")
- Slides: 49
CHILD POVERTY REPORT: OVERVIEW AND MAIN FINDINGS Jeffrey Alwang Harare, Zimbabwe 20 January 2020
OUTLINE OF PRESENTATION • Brief background • Methods for quantitative measurement of child poverty • Data and ability to measure deprivations • Analysis & findings • Summary • Suggestions for policy • Comments on analysis
BACKGROUND • UNICEF employs the following definition of child poverty: • Children living in poverty are those who experience deprivation of the material, spiritual, and emotional resources needed to survive, develop and thrive • Material resources include income, liquid and non-liquid assets, daily food consumption and its variability, access to services, and other factors affecting child well-being • UNICEF has worked on improving child poverty profiles to robustly identify poverty across money- and non-money- dimensions • New approaches include multiple overlapping deprivation analysis (MODA) and other multidimensional indicators • These approaches reflect the thinking that a single dimension, such as income or consumption is inadequate in properly characterizing the multiple deprivations faced by poor children
QUANTITATIVE APPROACHES TO MEASURING POVERTY 1. Descriptive analyses of “deprivations” or indicators of access (or lack thereof) to “rights” (e. g. the Bristol Indicators, see UNICEF 2006) • Examine how deprivations are distributed and how distributions of depravations change over time • Provide a rich and nuanced picture of poor children and the obstacles they face in surviving, developing and participating in human interactions 2. Directly quantify poverty across one or many of several dimensions • Can be money metric or use indices constructed of depravations or access to assets or rights • The money metric approach to poverty analysis is based on a monetized conception of well-being (usually consumption or income) and examines how failure to attain a minimum level (the poverty line) of well-being is distributed among children • The poverty reports produced by ZIMSTAT are good examples of the money-metric approach. They rely on detailed surveys of households to construct a welfare measure
HOW DO WE MEASURE POVERTY? 1. A welfare measure for children, used to derive a distribution of welfare Number of children 2. A poverty line, threshold below which children are classified as poor 3. A poverty measure, summary statistics of poverty in population Welfare Indicator
METHODS • The indicator of welfare is monthly consumption expenditures on market-purchased and homeproduced goods for each household • Adjustments are made to account for the value of housing, consumption value of durable assets owned by the household, and differences in real costs of living over space and over time • Price data collected by the Prices Unit at ZIMSTAT used to adjust for differences in real cost of living • Also includes the value of consumption from own production, gifts, and in-kind transfers • Real consumption expenditures per capita is compared to the ZIMSTAT money poverty line (ZIMSTAT 2019 b) to identify poor households • Poor children are those living in households that are poor • The analysis focuses on children in these poor households using the accepted definition of a child as anyone under the age of 18 (UN 1989)
INCORPORATING DEPRIVATIONS • The PICES dataset contains detailed information on access to services and, when combined with the money-metric measure, help us analyze deprivations faced by poor children • Questions include school enrolment, child labour, use of health care services (including publicly provided health care), health outcomes, housing conditions associated with deprivations (such as water, sanitation, shelter and information) • The report provides a profile of poor children and an analysis of the deprivations they face
DATA • A single cross-section is used: 2017 Poverty Incomes Consumption and Expenditures Survey • ZIMSTAT collect data from >30, 000 households in two waves: • Initial interview: Household demographics, education, employment, health, international migration, housing & WASH, assets owned • End of month: Household consumption expenditures, credit, property sales, agricultural production account, home business and stocks • Child-specific intake is not available, nor is typical diet—all we know is how much was consumed in last month by the entire household • Information on changes in well-being & inequality over time would need to be gathered from other sources (ZIMSTAT poverty reports)
ANALYSIS OUTLINE • Basic statistics: child poverty prevalence, depth and severity by geography (national, urban/rural, province, and district). Measure extent and location of child poverty • Profile of poor children: family structure, including size, headship and whether children live with their parents; illnesses suffered, access to health care and reasons for not using health care; schooling indicators. • Profile of deprivations suffered by poor children: water, sanitation, shelter, information, education. • Decomposition of poverty by deprivations suffered. This analysis shows what proportion of observed child poverty is due to each deprivations.
CHILDREN AND HOUSEHOLDS IN ZIMBABWE • Nationally, 78. 9% of households have children (younger than 18 years old) • 52. 8% have at least one child in the 0 -5 age range • Subsequent analysis: Poor children are those living in households whose consumption is below the poverty line; food poor live in households with consumption below the food poverty line • The poverty gap is computed as in Ravallion (1992) and reflects the mean shortfall in per-capita expenditures for households below the poverty line. The poverty severity index is the square of the poverty gap and reflects inequality among poor households and children in poor households
GEOGRAPHY OF CHILD POVERTY • Higher poverty indices in rural areas • Child poverty is more prevalent in Mashonaland Central, Manicaland Matabeleland North • Relatively low child poverty in Bulawayo • Manicaland has the highest percentage of poor children • In rural areas, all land use areas have high prevalence of poor children, but communal and resettlement areas are slightly worse; urban areas in rural provinces also have high rates of child poverty
CHILD POVERTY AND CHILD POVERTY INDICES BY RURAL/URBAN Area Percent poor Percent food poor Poverty gap Poverty severity Rural 76. 3% 47. 5% 0. 398 0. 194 Urban 20. 0% 5. 1% 0. 237 0. 081 Total 61. 3% 36. 1% 0. 384 0. 184
DISTRIBUTION BY PROVINCE % of all poor Province children Bulawayo 0. 7 Manicaland 18. 6 Mashonaland Central 13. 2 Mashonaland East 12. 2 Mashonaland West 12. 1 Matabaleland North 7. 2 Matabaleland South 5. 9 Midlands 12. 2 Masvingo 13. 5 Harare 4. 3 % all children 4. 4 15. 5 9. 8 11. 2 11. 4 5. 8 5. 4 11. 6 13. 6 11. 3 Total 100
DISTRIBUTION OF POOR CHILDREN, MANICALAND PROVINCE District Buhera Chimani Chipinge Makoni Mutare Rural Mutasa Nyanga Mutare Urban Rusape Chipinge Urban % of all poor children 20. 3 8. 2 18. 5 16. 4 15. 6 8. 1 2. 3 0. 8 1. 1 Total 100 % all children 17. 2 8. 7 15. 7 16. 5 15. 1 8. 3 7. 5 7. 7 1. 6 1. 7 100
POOR CHILDREN BY LAND USE AREAS
CHILD POVERTY BY RESETTLEMENT TYPE
HOUSEHOLD STRUCTURE AND CHILD POVERTY • Child poverty is closely related to household size (number of members); large households are far more likely to be poor • Household size falls across the welfare distribution, even in urban areas • Very young children are particularly vulnerable to poverty • Child poverty not strongly related to orphan hood • Headship and age of household head not strongly related to child poverty; slightly lower child poverty indices are found in female-headed households
CHILD POVERTY BY HOUSEHOLD SIZE
NUMBER OF CHILDREN BY WELFARE DECILE
LIVING WITH PARENTS BY WELFARE QUINTILE
CHILD POVERTY BY HOUSEHOLD HEADSHIP Rural Household headship Urban Poor Food poor Male 78. 4 50. 0 22. 1 5. 4 Female 72. 7 43. 2 15. 8 4. 5 De-jure 71. 1 41. 5 15. 1 4. 8 De-facto 73. 9 44. 5 16. 4 4. 3
CHILD POVERTY BY AGE OF HOUSEHOLD HEAD
EDUCATION • Poverty of children is closely tied to the education of the head of the household in which they live • School attendance is, in part, determined by the economic status of the household • Vicious circle: Poor children less likely to be enrolled in school • Public assistance for poor children’s education is not well targeted • Children in high-welfare households also receive assistance
CHILD POVERTY AND HOUSEHOLD HEAD EDUCATION Education of household head Rural Urban None 84. 0 31. 7 Primary 77. 5 23. 7 Secondary 24. 6 5. 0 Tertiary 33. 3 0. 0 Total 76. 3 20. 0
FAILURE TO ATTEND SCHOOL BY WELFARE QUINTILE
FAILURE TO ATTEND SCHOOL BY WELFARE QUINTILE, GIRLS ONLY
RECEIPT OF EDUCATION FUNDING ASSISTANCE Rural Urban Consumption quintile 1 2 3 4 5 Received assistance (mean number per household) 0. 10 0. 08 0. 07 0. 06 0. 04 Share ageeligible 0. 03 Received assistance (mean number per household) 0. 05 0. 04 0. 05 0. 03 0. 02 Share ageeligible 0. 02 0. 01 Total 0. 08 0. 03 0. 01
RECEIPT OF GOVERNMENTAL ASSISTANCE FOR SCHOOLING BY WELFARE QUINTILE
HEALTH AND ACCESS TO HEALTH CARE • No strong relationship between household economic status and the likelihood that a child (or any family member) reports being ill • Likelihood of reporting illness increases moderately by consumption quintile • Urban poor children face more obstacles to health care access than those in rural areas • Public spending on health care assistance for the poor and poor children is not well targeted • Economic barriers to health care particularly pronounced in urban areas
ILLNESS BY WELFARE QUINTILE (NUMBERS)
ILLNESS BY WELFARE QUINTILE (PROPORTION)
ILL NOT RECEIVING CARE, BY WELFARE QUINTILE
ILL NOT RECEIVING CARE, BY WELFARE QUINTILE (PROPORTION)
ECONOMIC FACTORS AND CHILD HEALTH CARE
PREGNANCY AND DISABILITIES • Child and young adult pregnancy more common in rural areas • Poor children more likely to suffer from disabilities than non-poor (difference is fairly large) • Hearing and learning disabilities most common among children from lower-welfare households • Children in poorest households are more than two percentage points more likely to suffer from a disability than those from the best-off households
CHILD PREGNANCY BY AGE AND MARITAL STATUS Married to head? All Age range women <15 0 15 -18 0. 3 19 -22 1. 0 23 -26 1. 0 27 -30 1. 3 31 -34 1. 4 34 -38 0. 9 >39 0. 3 Total 0. 6 No 0 0. 3 0. 9 1. 0 0. 5 0. 8 0. 3 0. 4 Yes 0 1. 2 1. 3 0. 9 2. 0 1. 9 0. 4 1. 0
PREGNANCY, AGE AND MARITAL STATUS, BY RURAL/URBAN Rural Overall rural (pct pregnant) Age <15 15 -18 19 -22 23 -26 27 -30 31 -34 34 -38 >39 Total 0. 0 0. 4 1. 1 1. 3 1. 1 1. 5 1. 0 0. 4 0. 6 Married to head? No Yes 0. 0 0. 3 1. 0 1. 4 1. 1 0. 7 1. 4 1. 2 1. 7 0. 6 1. 3 0. 5 0. 4 1. 0 Urban Overall urban (pct pregnant) 0. 0 0. 1 0. 8 0. 6 1. 4 0. 7 0. 3 0. 6 Married to head? No Yes 0. 0 0. 1 2. 3 0. 7 1. 2 0. 5 0. 6 0. 3 2. 7 0. 3 2. 3 1. 2 0. 3 0. 4 0. 1 0. 4 1. 1
PERCENT CHILDREN DISABLED BY AGE AND POVERTY STATUS Poor? Age of child No Yes Total <19 1. 27 2. 16 1. 75 >6<19 1. 03 1. 69 1. 38 <6 0. 25 0. 46 0. 36
DISABILITIES SUFFERED BY OLDER CHILDREN (1018 YEARS OLD) BY CONSUMPTION QUINTILE (PCT SUFFERING) Disability Movement Eyesight Speech Hearing Learning Any Consumption quintile 1 2 3 1. 10 1. 00 0. 80 1. 30 1. 00 1. 20 0. 60 1. 10 0. 70 1. 50 1. 30 1. 10 1. 50 1. 70 1. 50 7. 30 7. 60 6. 10 4 0. 90 1. 70 0. 80 1. 10 0. 90 6. 20 5 0. 60 1. 90 0. 40 0. 50 0. 90 5. 00 Total 0. 90 1. 40 0. 70 1. 20 1. 30 6. 60
DISABILITIES SUFFERED BY YOUNG CHILDREN BY WELFARE QUINTILE (PCT SUFFERING) Consumption quintile Disability 1 2 3 4 5 Movement 0. 80 0. 70 1. 20 Eyesight 0. 60 0. 40 0. 30 0. 50 Speech 1. 30 1. 00 0. 80 Hearing 0. 80 0. 40 0. 20 Learning 0. 60 0. 40 0. 50 0. 70 Any 4. 60 4. 10 2. 70 3. 10 3. 90
DEPRIVATIONS • Poor children face enormous obstacles to information and ability to benefit from ICT • Vicious cycle? • TV and radio access is limited in rural areas • Rural children have less access to cellphones, but cellphone penetration is fairly strong even in rural areas • Asset ownership is positively related to household welfare • Poor children much less likely than the non-poor to have access to good housing, good water sources and good sanitation
ACCESS TO INFORMATION RESOURCES BY CHILDREN (% IN HOUSEHOLDS WITH ASSET PRESENT) Rural Urban Asset Non-poor Poor Television 32. 08 11. 78 85. 37 57. 74 TV dish 13. 78 2. 32 55. 33 17. 79 Radio 41. 07 34. 96 26. 37 24. 31 Computer 4. 71 0. 35 15. 68 1. 51 Cell phone 88. 63 78. 73 94. 78 90. 36 Landline phone 0. 59 0. 40 5. 07 0. 42 Information (sum of assets) 1. 809 1. 285 2. 826 1. 921
SUM OF ASSETS OWNED BY WELFARE QUINTILE
HOUSING CONDITION INDEX BY WELFARE QUINTILE
SANITATION BY WELFARE QUINTILE
CONCLUSIONS • While child poverty is widespread and deep in Zimbabwe • Not evenly distributed • Rural/urban differences are substantial (welfare and deprivations) • Children in rural areas face severe challenges • Inadequate access to information and low-quality housing and sanitation are common • Many urban children also face challenges; high population densities, large numbers of children in urban households • In urban areas, investments in services will generally have a higher impact on the poor (due to high densities of poor children in urban areas) • Education assistance programs have not been effectively targeted; children in higher-welfare households benefit from many types of education assistance • Health fee programs are better targeted toward the poor than education programs • The report shows association and should be used to inform targeting efforts; it does not reveal causal relationships
THANK YOU!
ADDITIONAL RESEARCH • Within household differences (would need different data) • Schooling attendance and long-term outcomes