Child Poverty in Massachusetts A Tale of Three


- Slides: 45

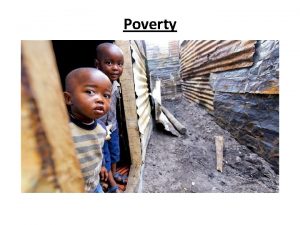
Child Poverty in Massachusetts: A Tale of Three Cities Lawrence, New Bedford and Springfield Focus on New Bedford Massachusetts Citizens for Children Massachusetts KIDS COUNT 2010

New Bedford: The Whaling City New Bedford shares common elements with other lowincome cities -- isolation, demographic change - including a rise in immigrant households and/or a rise in single-parent families - and lack of workforce readiness.

Economic and Workforce Shifts: Two Views of New Bedford There are not enough jobs in New Bedford. People lose hope. They might be able to cobble a job at Dunkin' Donuts or Burger King. They are probably living in substandard housing unless they are lucky enough to be in public housing. Ironically, there are tremendous amounts of natural resources in New Bedford has experienced a revitalization with emerging sectors companies in medical devices manufacturing and renewable energy investing in more than $100 million dollars that will generate over 600 new jobs. More than 8 dozen city planning initiatives underscore the commitment to strategic development planning.

Labor Force, Employment and Unemployment Child poverty persists because parents do not have enough work, and are not paid enough wages to support a family. Note: Not Seasonally Adjusted Source: Massachusetts Department of Labor Unemployment Data

Poverty by Census Tracts The Census tracts with highest rates of family poverty in New Bedford (2000 Census) are in the Southeastern parts of the city.

Age Distribution of Population New Bedford has the 6 th largest number of children under 18 in the state. n About one-quarter, or 23, 603 of its total population of 95, 272 are children. n Median age is 36 years.

Child Race and Ethnicity n n 9 th largest number of Hispanic Children in the state. 7 th largest number of African-American children in the state. New Bedford Massachusetts Source: The Annie E. Casey Foundation, KIDS COUNT Data Center, www. kidscount. org 2005 -2007 Data

Type of Households for Children Under 18 n Nearly half of New Bedford’s children (48%) live in households headed by a single female. In comparison 23% of children live in these households across the state. n Just under half of African-American and Hispanic households are headed by single females. n One-third of White households are headed Source: American Community Survey 2006 -2008. Table B 09005

Educational Attainment of Adults The percentage of New Bedford residents 25 years and over with high school diplomas is lower than the state’s average. Source: American Community Survey 2006 -2008 Table S 1501 n From 2006 -2008, 64% of New Bedford residents had at a high school degree or more. Of these, 33% had at least some college or more. n In Massachusetts, 89% graduated from high school and 61% have had at least some college. n Over half of residents who speak another language do not have a high school degree, compared with 25% of people who speak only English.

Trends in Foreign Born Population New Bedford is a gateway city for immigrants. Foreign born residents continue to make up a significant share of the population. Source: 2000 U. S. Census and American Community Survey 2006 -2008, Social Data Profiles

Percent of all Children who are Immigrants and Percent Living with at Least One Parent who is Foreign Born 2005 -2007 New Bedford has the 15 th largest number of children in the state residing with at least one foreign born parent, and a larger percentage of children than the state (35% compared with 24%). Source: The Annie E. Casey Foundation, KIDS COUNT Data Center, www. kidscount. org 20052007 Data

Languages Spoken at Home (Population 5 years old and over) n 37% of residents over five years old speak a language other than English at home, compared with 20% statewide. n Of those who speak a language other than English, 17% report that they do not speak English "very well", compared with 42% in Massachusetts. n Children in immigrant families grow up in complex language environments that can help promote the development of English language skills. English Only Speak Language Other than English at Home Linguistically Isolated: Speak English Less than Very Well New Bedford 55, 288 63% 33, 006 37% 14, 880 17% 88, 294 100% Massachuset ts 4, 841, 69 7 80% 1, 246, 0 37 20% 523, 29 4 42% 6, 087, 7 34 100% Total Source: American Community Survey 2006 -2008 Social Profile

Child Economic Well-Being in New Bedford

Children in Poverty at 100% Federal Poverty Level n New Bedford child poverty: one of the largest percentages of children who are poor – the 4 th highest percentage in Massachusetts. n While 23% of all New Bedford residents are at the poverty level, 36% or 8, 286 children under 18 are at that level. City/Town Child Poverty Number Child Poverty Percent of State Poverty New Bedford 8, 286 36% 5% Massachusetts 177, 912 12. 6% 100% Source: American Community Survey 2006 -2008

Percent of Children in Poverty under 18 by Race While Hispanic and African-Americans have similar median incomes, a higher percentage of Hispanic children under 18 are poor, at the FPL or below, compared with African-American children — 53% compared to 36%. Source: American Community Survey 2006 -2008. Table C 17020 B, C 17020 H,

Poverty of Related Children Under 18 by Family Type Source: American Community Survey 2006 -2008. Table C 17006 n Children in single-parent households score worse on measures of health, education, and behavior than children living in twoparent families. More likely to drop out of school, become heads of singleparent families, and experience low socioeconomic status. n A child raised by a single mother in New Bedford is over 7 times more likely than children raised by two parents to grow up in poverty.

Percent of School Children in Low-income and Poor Families 2002 to 2009 n School-age children in poverty are 3 to 4 times more prevalent in New Bedford than in the state. n The percentage increased from 63% to 70% between 2002 and 2009; the number of poor/low-income children decreased during this time, from 9, 144 in 2003 to 8, 768 children. Source: Massachusetts Department of Elementary and Secondary Education

Percent of Students on Free or Reduced Lunch Plans 2006 -2009 n New Bedford has the 7 th highest number of children on the free lunch program in Massachusetts. 59%, or 7, 451 children are on the free or reduced lunch program. n School meals are first line of defense in protecting them from hunger. n Students who eat breakfast and have significantly higher math and reading scores, fewer absences, improved attentiveness and lower incidences of social and behavioral problems. Source: Massachusetts Department of Elementary and Secondary Education

New Bedford Household Income (2008 Inflation-Adjusted Dollars) Source: American Community Survey 2006 -2008 Table C 19001 n Nearly two-thirds of all New Bedford residents earn under $50, 000 annually. The reverse is true statewide, where nearly two-thirds of residents earn over $50, 000 annually. n The median household income of $36, 809 in New Bedford just exceeds half of the state’s median household income of $64, 684.

Median Household Income By Race (2008 Inflation-adjusted Dollars) Race/Ethnicity New Bedford Massachusetts Hispanic $26, 473 $32, 031 African-American $26, 489 $42, 095 Asian $73, 532 $72, 168 White/Non. Hispanic $39, 819 $69, 226 $36, 809 $64, 684 Median Household Income Source: American Community Survey 2006 -2008. Table S 1903 n The median income of White/Non. Hispanics in New Bedford is about 1. 5 times more than Hispanics and African. Americans. n For minorities, disparities in assets are far greater than disparities in income.

Cost of Living Item Bristol County Housing $753 Child Care $1, 220 Food $503 Transportation $290 Health Care $312 Miscellaneous $308 Taxes $731 Child Care Tax Credit (-) -$100 Child Tax Credit (-) -$167 Monthly Total $3, 852 Hourly Equivalent $21. 88 Annual Equivalent $46, 220 Source: Crittenton Women’s Union Self-Sufficiency Calculator http: //www. liveworkthrive. org/calculator. php A family of three (one parent and two children) must earn $46, 220 annually to cover basic expenses (housing, child care, food, transportation, and health care) in Bristol County. NB Median Family Income = $45, 743

Percent of Families with Children under 18 who are in Poverty by Type of Family n Poverty varies by population group and by type of family. n Within families with children under 18, a larger percentage of families headed by single mother are poor than families with children under 18 overall. Source: American Community Survey 2006 -2008. Table S 1702

Percent of Single Mothers in Poverty Single mothers in poverty increased five percentage points, from 50% of all single mothers in 2000 to 55% in 2008. Source: American Community Survey 2006 -2008 Table S 1702

Poverty Status of Families by Educational Attainment of Householder (Percent of Poor Families) n Lack of education is a systemic root of intergenerational poverty. Source: American Community Survey 2006 -2008. Table C 17018 n Of all families that are poor at 100% of FPL in New Bedford, nearly 80% have a high school diploma or less. n Parents and schools share responsibility to create environments where children can learn and thrive.

Percent of Residents Below Poverty Level by Language Spoken at Home n The waves of immigrants who worked in the New Bedford fishing industry have historically been and continue to be mostly poor and uneducated, even while looking for more opportunity. Language, lack of employment and skills, and mobility contribute to poverty. n The poverty level for New Bedford residents speaking only Spanish at home is 1. 5 times as high as for those that speak English at home. Source: Census and American Community Survey 2006 -2008. Table

New Bedford Child Health New Bedford children are disproportionately vulnerable to negative health outcomes because of low income, leading to a greater likelihood of poor nutrition and inadequate access to preventive health care.

Percent of Mothers with a High School or Equivalent Degree n Mother’s education is an indicator of child health. Women with higher levels of education are more likely to receive adequate prenatal care, to breastfeed, and to be married. Source: Massachusetts Department of Public Health Massachusetts Community Health Profile (Mass. CHIP) www. masschip. state. ma. us n The percentage of New Bedford mothers with at least a high school degree is less than the state but has increased since 2000. n In 2006, 79% of birth mothers in the city compared with 94% statewide had a high

Trends in Teen Birth Rate - Number of Births per 1, 000 Females Ages 15 to 19 n n n Adolescent pregnancy is associated with a number of serious health, educational, and economic consequences. 4 th highest teen birth rate in the state, at 67 per 1, 000 births. Teen birth rate in Massachusetts decreased 10%, from 26 births per 1, 000 to 22 births per 1, 000 between 2000 and 2007. Massachusetts ranks 2 nd best in the nation. Source: Massachusetts Department of Public Health Massachusetts Community Health Profile (Mass. CHIP) www. masschip. state. ma. us

Percentage with Adequate Prenatal Care Source: Massachusetts Department of Public Health Massachusetts Community Health Profile (Mass. CHIP) wwww. masschip. state. ma. us n A baby’s development before birth can have a significant impact on learning. Brain development during the prenatal period and in the first year of life is rapid and vulnerable to environmental influence. n The percentage of New Bedford pregnant women with adequate prenatal care declined from 78% to 67% between 2000 and 2007. Statewide, it improved slightly from 81% to 83%.

Low Birth Weight (percent of infants born weighing less than 5 Lbs 8 oz) n Increased risk of low birth weight is associated with maternal poverty, smoking and low levels of educational attainment. n Infant health problems are a strong predictor of lower preschool cognitive abilities. Linked to behavioral disorders and visual and auditory impairments. n Eleven percent (11%) of babies in New Bedford are born with low birth weight, 3% higher than the state’s rate of 8%. Number of Babies Percent New Bedford 143 11% Massachusetts 6, 138 8% Source: Massachusetts Department of Public Health Massachusetts Community Health Profile (Mass. CHIP) www. masschip. state. ma. us 2007

Trends in Infant Mortality The infant mortality rate of 8. 7 deaths per 1, 000 births in New Bedford is almost twice the state rate of 4. 9. n Associated with women’s health, quality of and access to medical care, socio-economic conditions and public health practices. n In New Bedford, infant mortality nearly doubled between 2000 and 2007, from 4. 6 deaths to 8. 7 deaths per 1, 000 births. Source: Massachusetts Department of Public Health Massachusetts Community Health Profile (Mass. CHIP) www. masschip. state. ma. us

New Bedford Child Education Well-Being The job market has become something of a dead end for less-educated workers. Once upon a time, a high school graduate could find good paying work in a factory and support a middle- class family. Such jobs, mostly replaced by machines or sent overseas, have gone away. A good education in today’s global economy means at least some type of postsecondary degree. An Old Battle Rejoined, National Center for State Legislatures, January 2009 n Young children (starting with infants) who receive high quality services show better cognitive development at 24 months of age and better language development at 36 months. n 30% more likely to graduate from high school than children from similar backgrounds who don’t have the same exposure to high quality early education.

Percent of Age Group Enrolled in School Enrollment is indicator of success in school, to completing high school, moving on to postsecondary school, and earning more over a lifetime. n n Enrollment drops in New Bedford as children reach age 15. By ages 18 and 19, only 56% of New Bedford students are enrolled in school compared with 82% across the state. Source: American Community Survey 2006 -2008. Table S 1401

Trends in Dropout Rates Dropout rates increased between 2003 and 2006 from 7% to 11% of 9 th through 12 th graders. Source: Massachusetts Department of Public Health Massachusetts Community Health Profile (Mass. CHIP) www. masschip. state. ma. us

MCAS Scores Reading and math proficiency are fundamental to the development of academic competencies and basic life skills. n n Students with poor reading skills have difficulty completing coursework, graduating, and finding/maintaining employment. Steady improvement between 2000 and 2008 in 4 th grade. MCAS Math Grade 4: Percent of Students Receiving a Proficient or Advanced Proficient Score Source: Massachusetts Department of Elementary and Secondary

MCAS Score (Continued) MCAS English Grade 4: Percent of Students Receiving a Proficient or Advanced Proficient Score Source: Massachusetts Department of Elementary and Secondary Education

Graduation Rates n Just over half (56%) of New Bedford students graduated from high school in 2008. Statewide, graduation rates improved from 80% in 2006 to 85% in 2008. n The path to high school graduation begins early; repeating grades, failing one or more subjects in 9 th grade, ongoing patterns of absenteeism or tardiness, suspension, poor grades, and high mobility are linked to a student's likelihood of dropping out. Source: Massachusetts Department of Education, Elementary and Secondary Education

Population 18 -24 Enrolled in College or Graduate School 26% of 18 to 24 years olds are enrolled in postsecondary programs in New Bedford; 51% are enrolled in college or graduate school in Massachusetts. Location Percentage New Bedford 26% Massachusetts 51% Source: American Community Survey 2006 -2008. Table S 1401

Child Safety

Homelessness There are other homeless families that are living with friends, or in their cars, that we just don’t see. n Children who end up homeless may suffer twice as many ear infections, diarrhea and stomach problems, anemia, eczema, headaches, and other chronic illnesses. n Go hungry at twice the rate of other children. n Newborns have higher rates of low birth weight and need special care after birth four times as often as other children. n More likely to have academic problems due to changing schools frequently. Nearly half have problems such as anxiety, depression or withdrawal. Over one-third manifest delinquent or aggressive behavior. n As of January 2009 in New Bedford, there were 35 sheltered families with 67 people; one unsheltered family with 4 people; and 11 transitional or long-term homeless families with 30 people -- Boston Emergency Shelter Program.

Child Maltreatment Reporting And Victimization Rates (2008) Families who are poor are not inherently more abusive than families who are not. n n The National Incidence Study of Child Abuse and Neglect found that children from families with annual incomes below $15, 000 were 44 times more likely to experience some form of maltreatment than children from families with annual incomes above $30, 000. Child maltreatment in the city increased 14% from the previous year, compared to 11% statewide. Supportive family environments, stable family relationships, parental employment, adequate housing, and access to health care and social services lessen the risk of child abuse and maltreatment. Children younger than four years old are at the greatest risk for severe injury or % # All Cha # # death due to abuse or neglect. Ma Location New Bedfor d ltreatme nt nge 2007200 8 2, 415 Source: Massachusetts Massachusett 41, 125 s 14% Ne gle ct 2, 270 % Change 2007 -2008 15% Phy sica l 247 % Change 2007 -2008 # Sexual Abuse % Change 2007 -2008 - 2% 60 33% Department of Children and Families Statistics 11% 37, 973 10% 5, 167 2008 Child 12% Maltreatment 988 16%

Ending Child Poverty in New Bedford One program or one neighborhood group doing something on an individual basis will not make a difference. Addressing poverty has to be a coordinated effort among many programs, from economic development and social services to family literacy. Old ways of fixing things are not going to work anymore due to the economic climate. We are impacting just one family at a time. There needs to be more discussion across disciplines about what does work to make larger improvements in poverty. Program Coordinator, New Bedford Family Center n n Organize the infrastructure. Establish priorities, targets, timetables and benchmarks. Examine promising programs and policies. Engage the public.

New Bedford’s Future People Acting in Community Endeavors (PACE) New Bedford Early Literacy Consortium Greater New Bedford Workforce Investment Board Coalition Against Poverty Gateway Cities Coalition Immigrant Assistance Center Community Foundation of Southeastern Massachusetts YMCA Chamber of

End Child Poverty.

Child Poverty in Massachusetts: A Tale of Three Cities was written and produced by Massachusetts KIDS COUNT a program of Massachusetts Citizens for Children, Inc. The report was made possible through a grant from The Annie E. Casey Foundation. For more information Massachusetts Citizens for Children 14 Beacon St. , Suite 706 ~ Boston, MA ~ 02108 (617) 742 -8555 www. Mass. Kids. org © Massachusetts Citizens for Children 2010. All rights reserved.
 Child poverty in massachusetts
 Relative and absolute poverty
 Folk character
 이진트리 복사 순회
 The tale of 3 trees
 How is the pardoner's tale ironic
 Fractured fairy tales three little pigs
 Types of poverty
 Structural poverty
 What are the theories of poverty
 Ways to reduce poverty
 Sharecropper cycle of poverty
 Hidden rules of poverty
 The gilded age quotes
 Poverty of the stimulus
 Sailmaker poverty quotes
 Types of poverty in economics
 Defined poverty
 Solution
 Poverty causes
 Song about poverty
 No poverty meaning
 Relative and absolute poverty
 What is relative poverty
 Mental model of poverty
 Mental model of poverty
 Ruby k payne a framework for understanding poverty
 Ruby payne hidden rules chart
 Poverty index formula
 Generational poverty
 Poverty brainstorming
 Poverty and juvenile delinquency
 St vinny
 Esperanza’s house symbolizes poverty and
 Social qs
 Symbolic interactionist perspective on poverty
 Poverty proofing
 Human poverty index calculation
 St john chrysostom on wealth and poverty pdf
 Situational poverty definition
 What groups were experiencing poverty in the 1950’s?
 The causes of poverty
 Poverty and hunger solutions
 Situational poverty definition
 Keywordtool.lo
 My experience with poverty

