1 Poverty Elements of Historical Definition 19 th


 provided a real socialist option and model")


 had also acquired two meanings,")


")


 1. The “space” of poverty: what is")
 n n MONETARY Measure CAPABILITY Approach SOCIAL EXCLUSION PARTICIPATORY METHOD (MM)")


 Cost of basic food needs")


 on")


 is less than the")


 Aggregate short-fall of the poor relative to the poverty line")

 Region B = (2, 2, 2,")
 Mean of the squared proportionate poverty gap Reflects severity")


- Slides: 87
1. Poverty: Elements of Historical Definition 19 th -20 th centuries
Oxford English Dictionary The condition or quality of being poor. The condition of having little or no wealth or material possessions; indigence, destitution, want (in various degrees) Deficiency, lack, scantiness, dearth, scarcity; smallness of amount. Want of or deficiency in some property, quality, or ingredient; the condition of being poorly supplied with something; (of soil, etc. ) the condition of yielding little, unproductiveness. Poor condition of body; leanness or feebleness resulting from insufficient nourishment, or the like. III. 8. attrib. and Comb. , as ……… poverty programme U. S. , a programme or policy designed to alleviate poverty; poverty trap, a situation in which an earned increase to a low income is offset by the consequent loss of means-tested state benefits;
The OED indicates that in the English language, concepts of “poverty” from the 14 th century onward stress the idea of lack, absence, deficiency, and ALSO more specific framing of “poverty” as “market income poverty” ====> “having little or no wealth. ”
Creating a measure for “market income poverty” n n Benjamin Rowntree formalized a market-based measurement definition in the early 1900 s, when he established the concept of “poverty line. ” “Poverty Line” ==> the income level beneath which a person cannot buy goods and services that constitute a socially acceptable minimum standard of living.
Poverty lines can be set at any level appropriate for the purpose at hand. Higher lines designate higher “minimum” living standards; lower lines, lower minimum standards. The Millennium Development Goal “line” of $US 1/day at 1985 US prices put about 1. 3 billion people “in poverty” in 1990.
The CONCEPT of a poverty line depicting a global minimum standard for a socially acceptable minimum standard of living for the whole world came into existence only after 1945. This GLOBAL conceptualization of POVERTY as an object of measurement EVERYWHERE is a feature of WORLD ORDER in the later 20 th century.
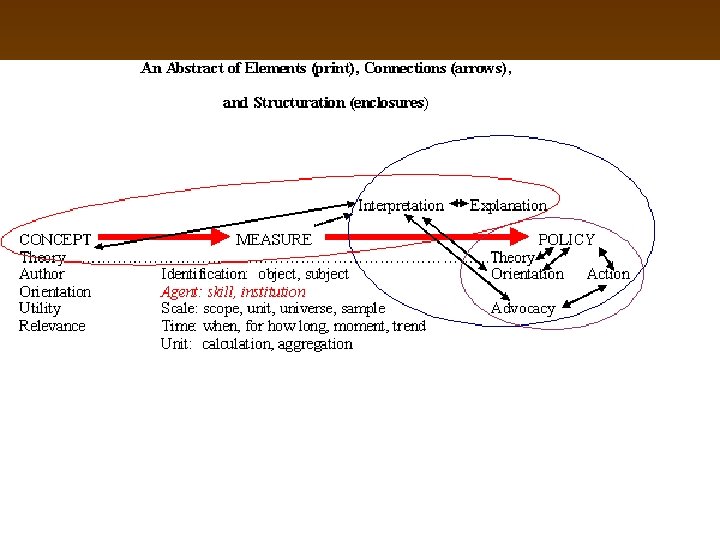
Concept => Measure => Policy n n n The original CONCEPT of poverty guiding MEASUREMENT and POLICY was nationality. The modern problem of poverty, hence the idea of a “poverty line, ” appeared FIRST inside territories of national state authority, where NATIONAL norms prevailed, NATIONAL governments made policy, and NATIONAL elites and institutions debated policy options.
Conceptualizing Poverty, Nationally n n In England, the IRISH famine and mounting URBAN poverty became prominent features of public life, in the 1840 s, when the first modern studies of poverty appeared, one influential study by Fredrick Engels, Karl Marx’s close associate. Modern ideas about socialism appeared at this time, to express the demand that the STATE protect the poor from poverty induced by early industrial capitalism (in England). The Irish famine followed by INDIAN famines in 1870 s brought to light massive VULNERABILITY to catastrophe among poor people living under the authority of the BRITISH EMPIRE From the 1870 s, PROTECTING AGAINST FAMINE became official government policy in much of Europe and also in British India.
Increasing Inequality Made Poverty a Pressing Problem As economic growth accelerated under industrial capitalism, in the nineteenth century, states took more interest in “the poverty problem. ” Growing inequality generated demands to address poverty, in England also in British India.
Nationalism and Socialism Nationalism in British India and Socialism in Europe both made strong claims that states had the responsibility to protect the poor from calamity. These claims became political challenges to states based on support for English national business interests promoting laissez faire market policies.
Revolution and Depression The Russian Revolution (1917) provided a real socialist option and model for national movements in Asia, including British India. The Great Depression (1929 -1934) forced states to take responsibility for protecting whole national populations against severe market fluctuations.
Poverty Line and Cold War The mid-20 th century made concepts of poverty more political First: by introducing TWO conflicting meanings for the POVERTY LINE, one associated with capitalism, the other, with socialism. Second: by giving INEQUALITY (measured around the poverty line) two meanings, with the same conflicting associations.
Poverty Lines & Entitlement in Socialism and Welfare States Under socialism and in welfare states, the “poverty line” marked an income level below which people became entitled to STATE provisioning of goods and services that people could not buy. The assumption here is that the state is at the very least the provider of LAST RESORT of necessary goods and services for citizens.
Market Entitlement n n By contrast, the market economy by itself provides no such last resort entitlement Amartya Sen defines entitlements of three kinds (Poverty and Famines) 1. Self-Production (as on peasant farm) n 2. Personal Property (legal ownership) n 3. Exchange (purchase for money) n
Shifting Paradigms After 1970, the socialist and welfare definitions of poverty entitlement became less politically popular in many states. v This trend accelerated with the dismantling of many socialist regimes and state policies. v The NATIONAL STATE became less active as guarantor of ENTITLEMENTS for the poor. v
Meanings of Inequality INEQUALITY (measured around the poverty line) had also acquired two meanings, with the same conflicting associations. In market-based capitalism, it retained its meaning as UNEQUAL WEALTH among disparate individuals. Under socialism, it acquired the meaning of UNEQUAL POWER over the distribution of goods and services among social classes.
UNEQUAL WEALTH among individuals became more broadly defined over time. [Kanbur et al, Laderchi et al] Poverty = n income insufficiency (market buying power) n lack of access (to goods and services in general provisioning, not just market, e. g. courts, welfare programs, family, community) n lack of assets (ownership, social capital, to use to acquire necessities, or to produce, e. g. land, animals, credit) n lack of capacity to do things (abilities), n lack of entitlement (rights to resources), Hence: insecurity, vulnerability (lack of protection, safety), lack of prospects or opportunities (e. g. education), hence poverty outcomes (symptoms) =>lack of health, food, shelter, hunger, disease, early death, misery, etc
Implications of viewing poverty as UNEQUAL WEALTH among disparate individuals q q q The fact that non-poor people have what poor people do not have is irrelevant to poverty. Income inequality is just a ranking of attributions, from greater to lesser, from wealth to poverty. Targeting poverty can mean provisioning, providing, or endowing the poor with means to ends (i. e. money or jobs to buy food) or with ends directly (e. g. food, housing, shelter, etc).
By contrast The UNEQUAL POWER concept of INEQUALITY makes poverty an outcome of inequality. This approach considers “lack” or “insufficiency” of wealth (by any definition) the outcome of denial; it applies the active verb meaning of “deprivation, ” indicating that things people need are taken away, deprived, BECAUSE poor people do not have the power to sustain themselves. A lack of empowerment, in this view, is not just a lack, but a loss, as in disempowerment or oppression (an active reduction of prospects and freedom of action).
So when we see poverty as UNEQUAL POWER among social classes. q q q The fact that non-poor people have what poor people do not have is very relevant to poverty. Wealth inequality represents the production of poverty by the systematic use of power to provide wealth to some groups and not others. Targeting poverty can mean removing obstacles to their empowerment, including a reduction of the power of the non-poor to accumulate wealth.
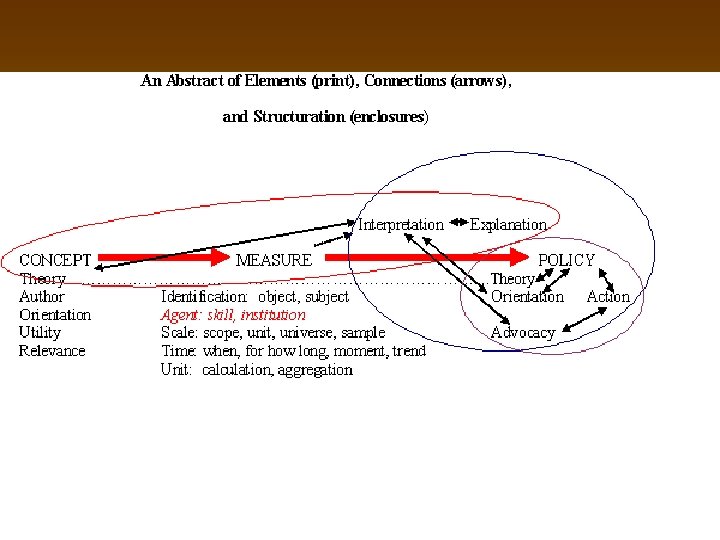
Concept <=> Measure <=> Policy • • The DEFINITION of poverty is thus a complex, changing process. In which concepts and measures derive from policy orientations, • • which are in turn formed within a changing world environment, where people in state, regions, and localities engage poverty as a problem today.
2. Poverty in Global Frames Since 1945
From International to Global Poverty Conflicting meanings of POVERTY LINE, ENTITLEMENT, and INEQUALITY became part of international policy dispute and conflict after 1945, When for the first time, THE WHOLE WORLD of Poverty became an object of policy attention.
From International to Global Poverty remains fundamentally national: Concepts, Measures, and Policies differ from state to state. Statistics remain state products. State politics still determine state policies. But the international system has become more and more powerful as a context for state activities.
From International to Global Poverty A World Development Regime came into being after 1945 The World Bank, IMF, United Nations agencies, GATT/WTO, and major “donor countries” set the tone for development These organizations actively shifted the POVERTY paradigm away from that of welfare/ socialism toward that of market/capitalism
Universal Norms, Concepts n n n The Universal Declaration of Human Rights was the first of many UN documents to formulate standards, norms, and concepts for all member states. Member states eventually embraced almost all the world population. The Millennium Development Goals are now the most GLOBALLY influential statements about POVERTY
Poverty as a global problem n Though policies focus on individual countries, each operates inside a global regime n composed of states and inter-state organizations that set the tone for the dominant operative matrix of n n CONCEPT => MEASURE => POLICY
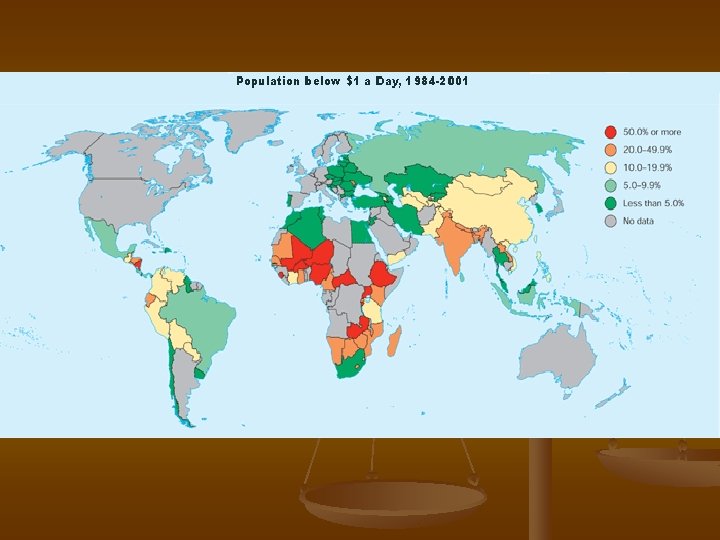
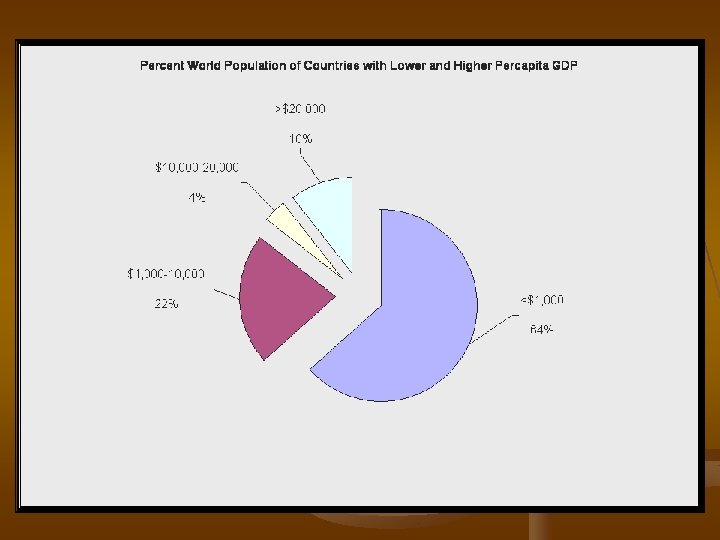
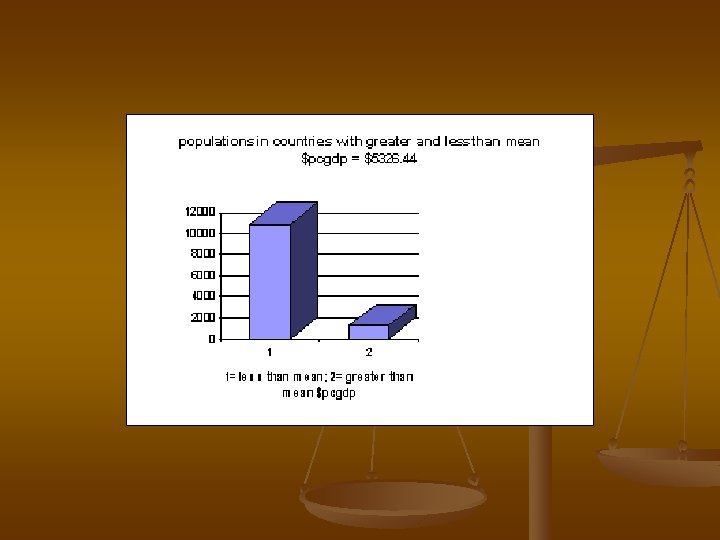
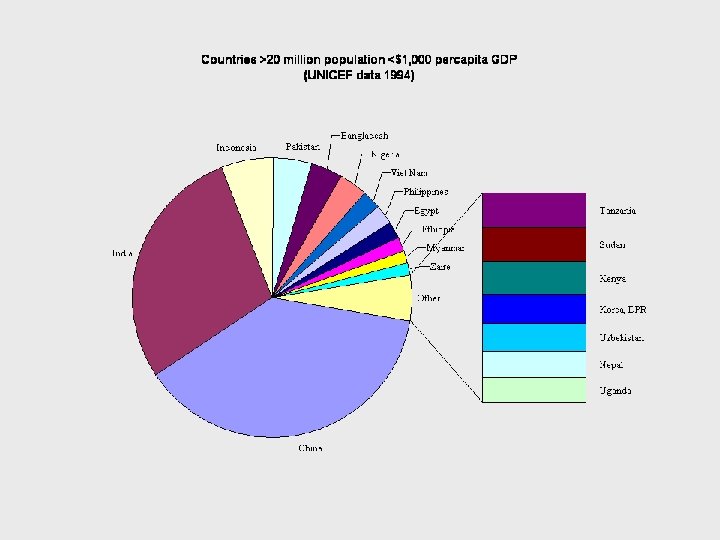
National Poverty, Global Inequality The following slides indicate: n PERCAPITA GDP for each national territory (total product/total population) is the measure of global inequality; n people in poor countries are the global majority n people in the richest countries, which set the tone for global development, are a small minority n most of the world’s poor live in Asia. n poverty correlates with life expectancy (among other quality of life variables
Wealth inequality is life inequality (Based on 1996 UNICEF data)
3. Measuring Poverty Institutions and practices
Spatial frames for approaching poverty
Concept <=> Measure <=> Policy n n Policy orientations shape concepts and measures Concepts and measures influence from policy orientations Policy orientations take shape inside a changing world environment, where people in state, regions, and localities engage poverty as a problem.
A Matrix of Interactions in the Politics of Knowledge About Poverty n n n Policy orientations inform policy within structured institutional settings These settings tend toward self-justification, They structure research, interpretation, explanation accordingly Concepts, measures, and analysis rarely operate free of institutional structures. We all operate within structured conceptual limitations … that said, we can proceed:
From definition to measurement: basic problems (Laderchi) 1. The “space” of poverty: what is possible now under current conditions or what is possible under altered conditions. 2. Universality: do definitions translate or move across contexts. 3. Subjective versus Objective: Values, Judgments, and Agency 4. Setting Poverty Line: Dividing Poor and Non-Poor 5. Units of analysis: e. g. person, family, area, population 6. Multidimensionality: how to evaluate elements 7. Time: month, year, lifetime, or longer 8. Do measures explain?
Four Approaches (Laderchi) n n MONETARY Measure CAPABILITY Approach SOCIAL EXCLUSION PARTICIPATORY METHOD (MM) (CA) (SE) (PM)
Definitions and Practical Benefits n Monetary Measure: n n Poverty line cuts ranked income groups by level at which money income insufficient to acquire necessary goods and services n n Parsimony Statistics Objectivity Translatable Economic Theory Levels of Scale
Definitions and Practical Benefits n CAPABILITY n n Poverty line distinguishes people without “freedom to live a valued life, ” denied capacity to “realize human potential” n n n Multidimensional Substantive Adaptable Non-Utilitarian Ethical Theory + Economics (HDI)
Definitions and Practical Benefits n SOCIAL EXCLUSION n n Poverty line separates groups marginalized and deprived of basic social assets n n n Relativity Agency Dynamics (process) Non-Individualistic Multi-dimensional
Definitions and Practical Benefits n PARTICIPATORY APPROACH Poverty line defined by people themselves n n n Sensitive Contextual Voice Democracy Relativity
Which measure is best? n n n Money measure is ubiquitous Its practical benefits attract most support Its theoretical attachment to economic theory implies explanatory and thus predictive power for policy makers But diversity of measures better captures realities of poverty and
“ … large discrepancies in those defined as poor according to different methods mean that one cannot rely on the monetary indicators to identify those in other types of poverty, nor conversely. ” -- Laderchi et al.
Poverty Elements and Orientations The diversity of definitions emerges from entanglements among technical analysts, institutions, and “poverty issues. ” Definitions of poverty do not emerge independently of theories, ideologies, statistical methods, and analytical procedure that inform policy, but rather inside them.
Specialist orientations and prior commitments generate definitions, procedures, priorities n n n n Human Rights Education Environment Law Housing Sanitation Health Care n n n n Gender Nationalism Globalization Economics Anthropology Cultural Studies Etc etc
World Bank, World Development Report, 2000/1, Attacking Poverty. Introduction. n n n Poverty is multidimensional: it includes inadequate food, shelter, health, education; vulnerability to disease, dislocation, disaster; and often mistreatment by state and society. “Poor people live without fundamental freedoms of action and choice that the better-off take for granted. ” (capabilities, rights? ) “The experience of multiple deprivations is intense and painful. ” The Voices of the Poor study, which informs this report, gives a first-hand glimpse of poverty. (participatory approach) “Of the world’s 6 billion people, 2. 8 billion – almost half – live on less than $2 a day, and 1. 2 billion – a fifth – live on less than $1 a day, with 44 percent living in South Asia. ” (monetary poverty) “In rich countries, ” less than 1 in 100 children die before age 5; while “in the poorest countries, ” as many as 20% do. In rich countries, <5% children < 5 yrs old are malnourished; in poor countries, as many as 50% ten times the percentage. n (Inequality, comparison, as definition of poverty)
Poverty Measurement and Analysis Suresh Babu International Food Policy Research Institute IFPRI
What is Poverty? Poverty is “welfare level below a reasonable minimum. ” Poverty has various dimensions Income poverty Security poverty Education poverty Health – Nutrition Poverty Multiple deprivation Poor people’s perception of poverty level IFPRI
What do we mean by “Poverty”? The primary focus is on individuals or groups suffering from multiple deprivations Education poor Health Poor Core Poor Security Poor Income Poor IFPRI
Poverty Lines and Poverty Measurement Two Issues in Generating Poverty Estimates Fixing a poverty line: Identification Measuring poverty: Aggregation IFPRI
Methods of Fixing Poverty Lines Cost-of-basic-needs method (Food-share method) Cost of basic food needs Cost of basic non-food needs Food-energy method Expenditure level that meets the food energy requirement Based on calorie-income relationships Fitting and tracing calorie-expenditure graph IFPRI
Cost-of-Basic-Needs Method Total Poverty Line = Z Z=ZF + ZN ZF = Food Poverty Line ZN=Non-food Poverty Line IFPRI
How to calculate the Food Poverty Line 1. 2. 3. 4. Calculate average household (HH) size Find minimum requirement of daily per-capita calories for WHO Find the typical food bundle of the relative poor HH Calculate the calories of this food bundle 5. Determine the cost of this food bundle WHO’s average minimum ZF = calorie requirement calories in average food bundle for relatively poor HH Cost of the * average food bundle IFPRI
How to Calculate the Non-food Poverty Line 1. 2. Find typical Household (HH) on the food poverty line. Calculate the non-food expenditures of the HH. x. F = per capita expenditures on food XN = per capita expenditure on non-food X = total per capita expenditure ZN = E {XN|x. F= ZF} for the poor (Non-food poverty line is the per capita non-food expenditure level when the per capita food expenditure level is equal to the food poverty line) ZN = E {XN|x= ZF} for the ultra (extreme) poor (The non-food poverty line is given by the per capita non-food expenditure when the total expenditure is equal to the food poverty line. The food poverty line in essence becomes the total poverty line for the ultra poor) IFPRI
Minimum daily caloric requirements by sector and gender Urban Rural Age categories Male Female 0 to 1 year 820 820 >1 to 2 years 1, 150 >2 to 3 years 1, 350 >3 to 5 years 1, 550 >5 to 7 years 1, 850 1, 750 >7 to 10 years 2, 100 1, 800 >10 to 12 years 2, 200 1, 950 >12 to 14 years 2, 400 2, 100 >14 to 16 years 2, 600 2, 150 >16 to 18 years 2, 850 2, 150 >18 to 30 years 3, 150 2, 500 3, 500 2, 750 >30 to 60 years 3, 050 2, 450 3, 400 2, 750 >60 years 2, 600 2, 200 2, 850 2, 450 Source: Caloric requirements are from WHO (1985, Tables 42 to 49). Notes: Requirements used are for men weighing 70 kilograms and for women weighing 60 kilograms. Urban individuals are assumed to need 1. 8 times the basal metabolic rate (BMR), while rural individuals are assumed to need 2. 0 times the average BMR. Children under one year of age are assigned the average caloric need of children either 3– 6, 6– 9, or 9– 12 months old. IFPRI
Poverty lines and spatial price indexes by region Food Reference Ultra Relative poverty price Region line index Metropolitan 50. 18 75. 36 129. 19 1. 000 Lower urban 45. 94 101. 72 67. 52 0. 787 Lower rural 44. 29 85. 38 64. 71 0. 661 Upper urban 45. 19 101. 36 67. 51 0. 785 Upper rural 40. 36 82. 81 53. 37 0. 641 Notes: Poverty lines are monthly, per capita figures in Egyptian pounds. The Metropolitan poverty line is used as a base line to create the relative price index, which is simply the ratio of each region's reference poverty line to the base line. IFPRI
Issues in the Poverty Line Does a poverty line exists? Can it be used & is it well accepted? Are international standards for setting poverty lines accepted in all countries? Can we use the same poverty line throughout a country? Can the nutritional basket underlying the poverty line be derived from surveys? IFPRI
Measures of Poverty Incidence of Poverty: poverty rate Use the headcount rate to calculate the poverty rate of the % of population below the poverty line Depth of Poverty – how far a person is below the poverty line Poverty Gap – aggregation of depth of poverty Poverty Severity – aggregation with weights IFPRI
Head-count Index of Poverty Proportion of population whose consumption (y) is less than the poverty line Z Y 1, Y 2, . . …Z, . . …Yn q H =q/n H = Head-count index q = number of poor n = size of the population Eg: if n=100; q=50 then H=0. 5 or 50% Problems Insensitive to the depth of poverty H will not change when a poor persons welfare changes if he/she remains below the poverty line IFPRI
Example of the Head-count Index Calculation Income of 4 individuals in a sample: 1, 2, 3, 4 Poverty Line Z = 3. 0 H = q/n =3/4 = 0. 75 or 75% IFPRI
Head-count of Absolute Poverty for Bangladesh Year Sector BBS Graph* Fitting Method + Ahmed et al. (1991)+ Ravallion & Sen (1994) Rahman & Haque (1988) Hossain & Sen (1992) 1973/ 1974 Rural 82. 9 - - 65. 3 71. 3 n. a. 55. 9 Urban 81. 4 (5. 6) 62. 5 n. a. 63. 2 37. 8 Rural 73. 8 71. 8 79. 1 65. 3 n. a. - Urban 66. 0 65. 3 50. 7 n. a 48. 4 Rural 57. 0 n. a. 53. 8 49. 8 50. 0 n. a. Urban 66. 0 n. a. 40. 9 39. 5 n. a. 42. 6 Rural 51. 0 51. 6 45. 9 47. 1 41. 3 n. a. Urban 56. 0 66. 8 30. 8 29. 1 n. a. 30. 6 Rural 48. 0 - 49. 7 - 43. 8 n. a. Urban 44. 0 n. a. 33. 4 Rural 50. 0 - - 1981/ 1982 1983/ 1984 1985/ 1986 1988/ 1989 1991/ 1992 + food energy method Urban 46. 8 - 35. 9 - 52. 9 - * BSS 1991 and BSS 1995 33. 6 Sen & Islam (1993) Muqtada (1986) - - - 65 IFPRI
Poverty Gap Index (PGI) Aggregate short-fall of the poor relative to the poverty line Z Y 1, Y 2, …, Yq; Yq Z Poorest Least poor q PG = 1/n Σ [(Z-Yi)/Z] = i=1 mean proportionate poverty gap across the whole population (zero gap for the non=poor) IFPRI
Example of Poverty Gap Calculation Income of 4 individuals in a sample: 1, 2, 3, 4 Poverty line = Z = 3; n=4 PG = [(3 -1)/3 + (3 -2)/3]/4 = [(2/3) + (1/3)]/4 = [(3/3)/4] = ¼ or 0. 25 Poverty gap index does not capture differences in severity of poverty. IFPRI
Why? Region A = (1, 2, 3, 4) Region B = (2, 2, 2, 4) Poverty line = Z = 3 HA = 0. 75 PGA = 0. 25 HB = 0. 75 PGB = 0. 25 Poverty gap will be unaffected by an income transfer from a poor person to another poor person who IFPRI
Squared Poverty Gap Index (SPG) Mean of the squared proportionate poverty gap Reflects severity of poverty Sensitive to the distribution among the poor q SPG = 1/n Σ [(Z-Yi)/Z]2 i=1 Eg: Region A = (1, 2, 3, 4) Region B = (2, 2, 2, 4) with Z=3 SPGA = 0. 14 SPGB = 0. 08 Poverty in region A > Poverty in region B IFPRI
Poverty Analysis Income/Consumption Poverty Profile Correlates poverty with: Gender Age Residential location Ethnic characteristics Income source Employment sources Share of food/ non food consumption Education outcomes Malnutrition outcomes IFPRI
Qualitative Analysis of Poverty Role of informal sector? Social analysis of poverty? Institutional analysis of poverty reducing institutions Intra-household distribution of resources IFPRI
Use of Qualitative Methods Subjective meaning of poverty Intra-household dimensions of poverty Poor people’s priorities for action Social, political, and cultural factors, gender roles, and traditional beliefs Participants help in designing household surveys Assess the validity of HHS results at local level IFPRI
Income or Consumption? Consumption reflects income as well as past savings, access to credit markets, and seasonal variation in income No records of income or seasonal fluctuations Large informal sectors Consumption data helps in deriving the poverty line IFPRI
Measuring Income/ Consumption Poverty Household data availability – tools Measurement of income poverty Quantitative analysis tools Qualitative analysis tools Income poverty dynamics – tools IFPRI
Data Needs for Poverty Analysis National level data National accounts – GDP, consumption, savings, investment, imports, exports, etc. Ministry of Finance, Central Statistical Agency Budgets, price surveys, and data collection Monthly, quarterly, and yearly IFPRI
Data Needs for Poverty Analysis cont. Local level data Consumer and producer prices, climatic data, availability and use of markets and services CSA, local service providers, regional departments Price and market surveys Monthly, yearly IFPRI
Data Needs for Poverty Analysis cont. Household – Individual level data Household income, consumption, employment, assets, production, demography, etc. CSA, sectoral ministries, NGOs, academics Household survey, rapid assessments, monitoring and evaluation Yearly, 2 -3 years, every 5 years IFPRI
Data Sources for Poverty Analysis Administrative data Population Census Household surveys – LSMS, I&E, Labor, DHS, RRA Qualitative and Participatory Assessments – ethnographic, village studies, beneficiary assessments, etc. IFPRI
Types of Household Surveys Single-topic surveys Multi-topic surveys Census data Poverty monitoring surveys Times series data Panel data sets IFPRI
THE END n continuations 1. 2. nutrition and poverty markets and poverty
HOW to TACKLE POVERTY GLOBALLY Before the 1970 s, the general assumption internationally was that GOVERNMENTS were responsible to PROTECT people against calamitous vulnerability, to provide SAFETY and SUSTENANCE, which would not otherwise be available. Since then, the IDEA THAT ECONOMIC GROWTH based primarily if not solely on asset allocations in the MARKET could END POVERTY or even curtail it massively has become increasingly popular.
Changing Parameters of Policy => Concept => Measure n n THE NATIONAL STATE has thus lost its formerly presumed role as guarantor of basic welfare entitlements for the poor. A global POLICY orientation that promotes the CONCEPT of market-driven ECONOMIC GROWTH has generated new efforts to measure its impact on wealth and inequality.
Global Trends indicate growing productivity, wealth, and inequality n n n ratios of per capita income between rich and poor countries increased more than six-fold between 1870 and 1985, as income levels dispersed over an ever-widening range of variation and rich and poor economies clustered on either end of a broader spectrum. Today, inequality is increasing. The gap between the richest and poorest countries is growing. The poorest of the poor are an ever -larger proportion of the world population. Absolute poverty increased in the 1990 s most dramatically in Africa, where an average household now consumes 20% less than 25 years ago. From “Divergence, Big Time, ” by Lant Pritchett (a World Bank report)
Markets and Poverty It appears that in general n n Market-based economic development DOES generate increasing WEALTH but also ALLOWS for (if it does not generate) increasing inequality,
Markets Are Pragmatic The following slide indicates that investors would tend to avoid risky economic environments. Many of which would also be poor. Left to itself, therefore, the market would not define poverty as a problem.
Strategic Options for Capital Investment RISK High Low HH: frontiers LH: ideal (proceed with caution) (swarm here) HL: ghettos LL: safety net (don’t go here) (stability option) High YIELD Low
As a result of investor logics non-market mechanisms remain critically important for our GLOBAL DEVELOPMENT REGIME to target poverty as a global problem in each individual country where poverty is prevalent as measured by global standards.