Chapter 19 Applications of Standard Electrode Potentials Calculating


 + 2 Ag+ Cu+2 + 2 Ag(s) The equilibrium constant")


")


 Complexes of Orthophenanthrolines A class of organic compounds known as 1, 10 -phenanthrolines,")

- Slides: 39
Chapter 19 Applications of Standard Electrode Potentials
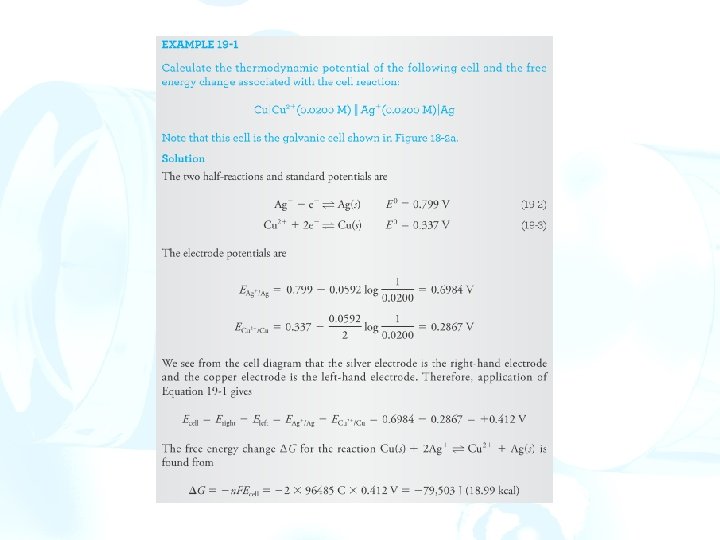
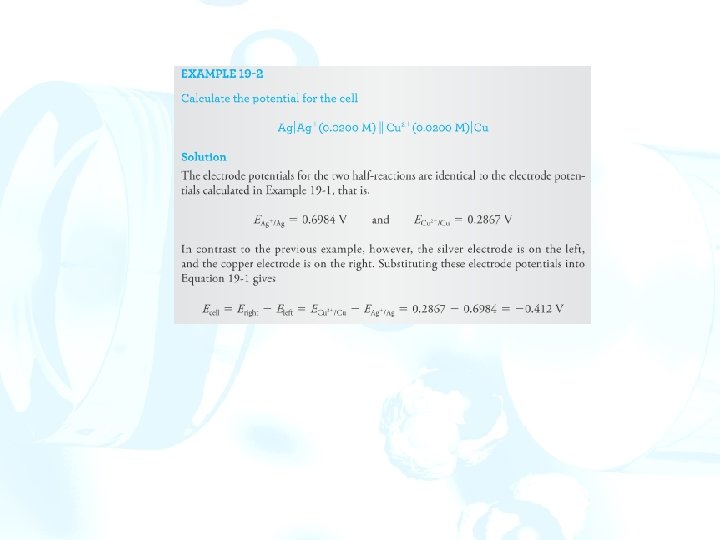
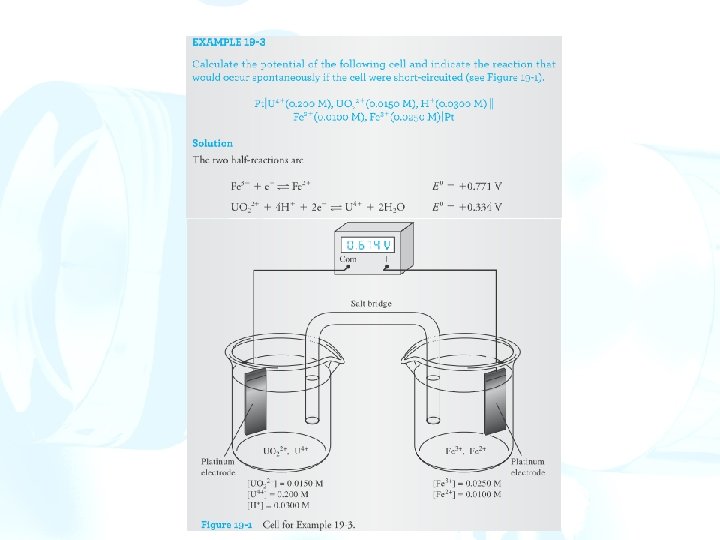
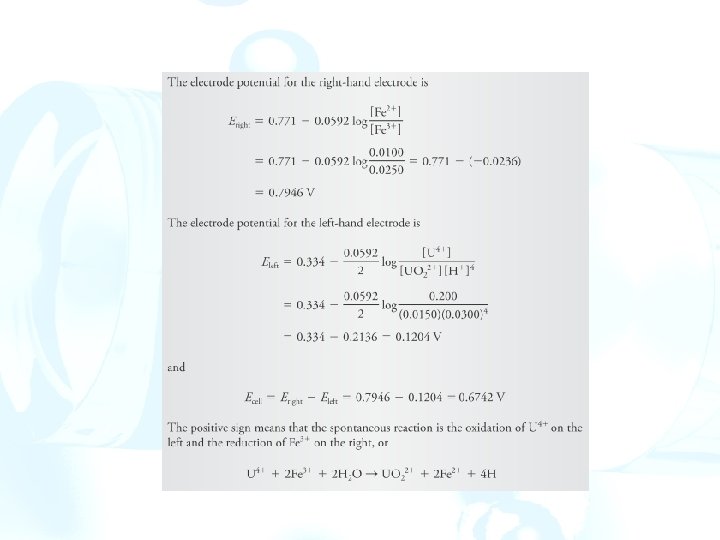
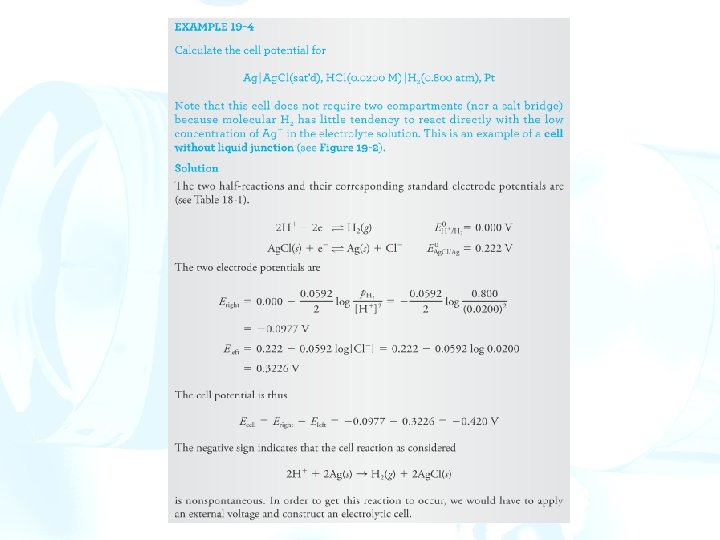
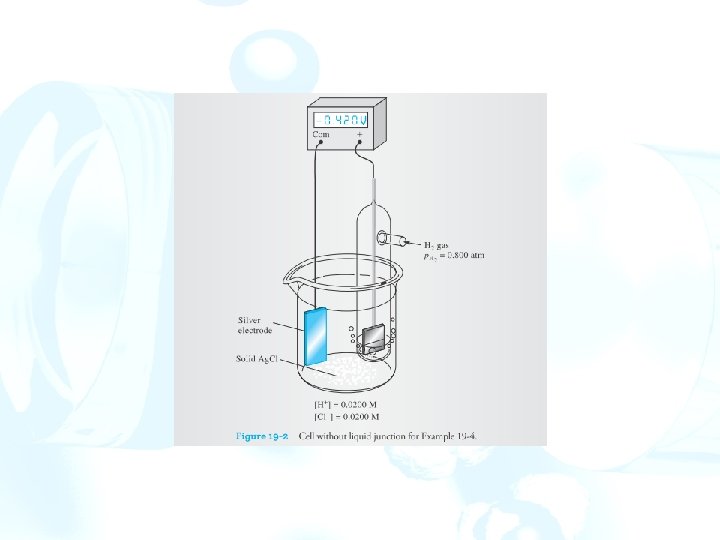
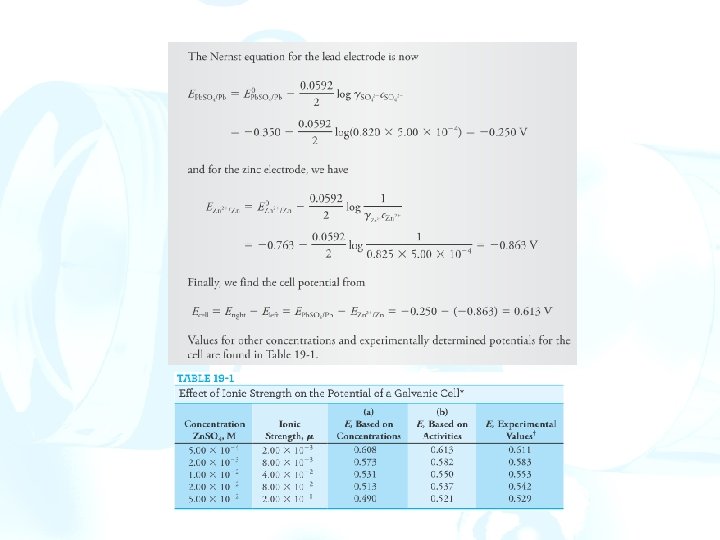
Calculating potentials of electrochemical cells The thermodynamic potential of an electrochemical cell is the difference between the electrode potential of the right-hand electrode and the electrode potential of the left-hand electrode: Ecell = Eright – Eleft The equation is valid when the liquid junction potential is absent or minimal.
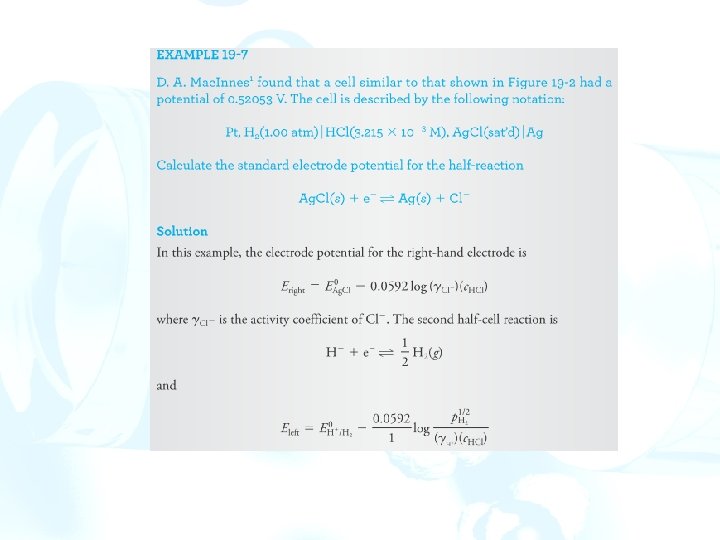
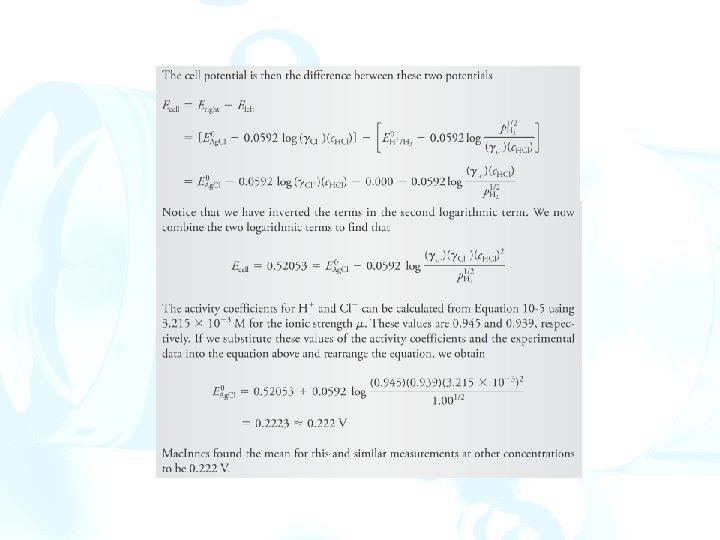
19 B Determining standard potentials experimentally None of the standard potentials can be measured directly in the laboratory. Any electrode system in which the reactants and products are at unit activity or pressure, such as the SHE, are hypothetical electrodes. There is no way to prepare solutions containing ions whose activities are exactly 1.
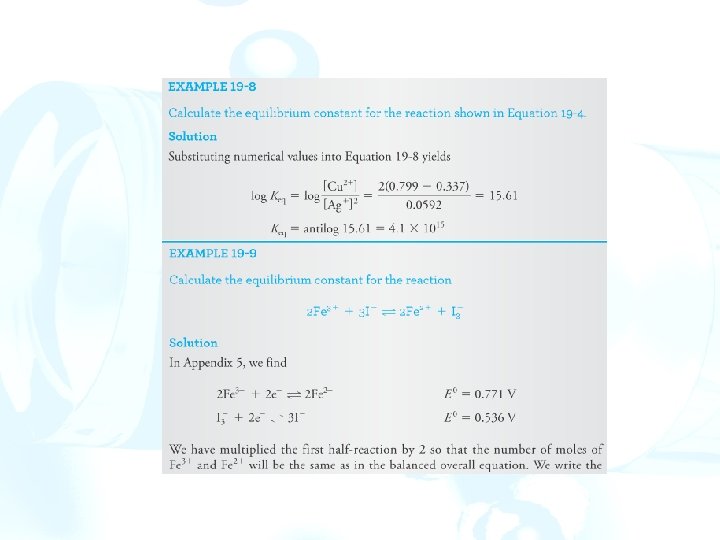
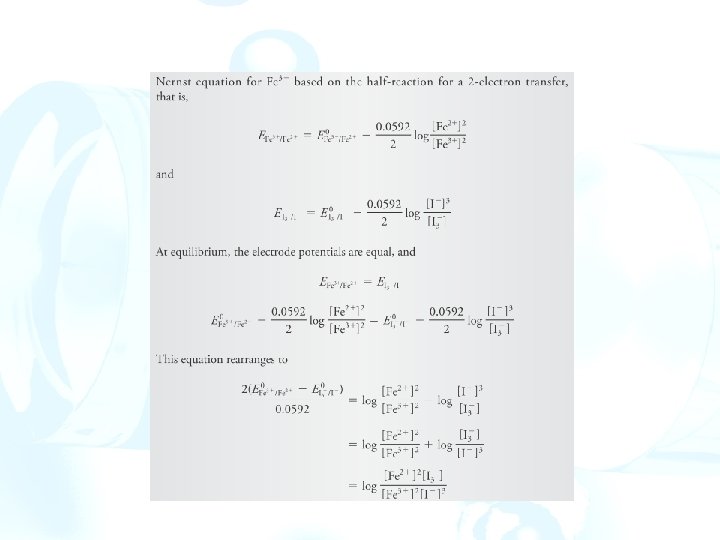
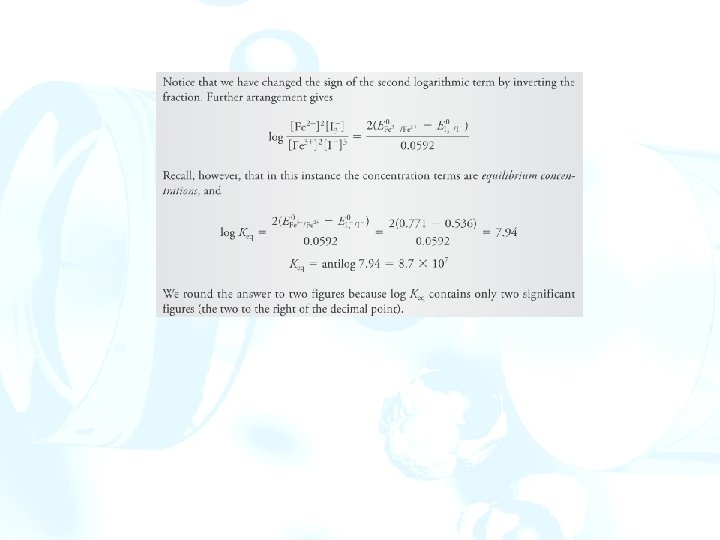
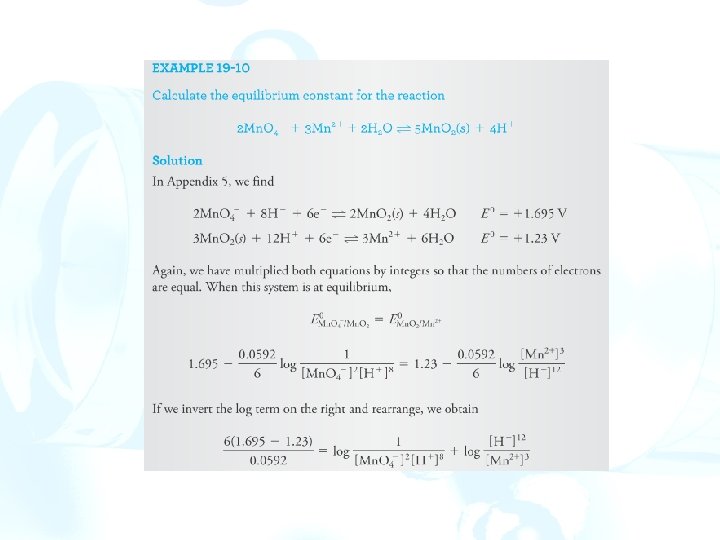
19 C Calculating redox equilibrium constants
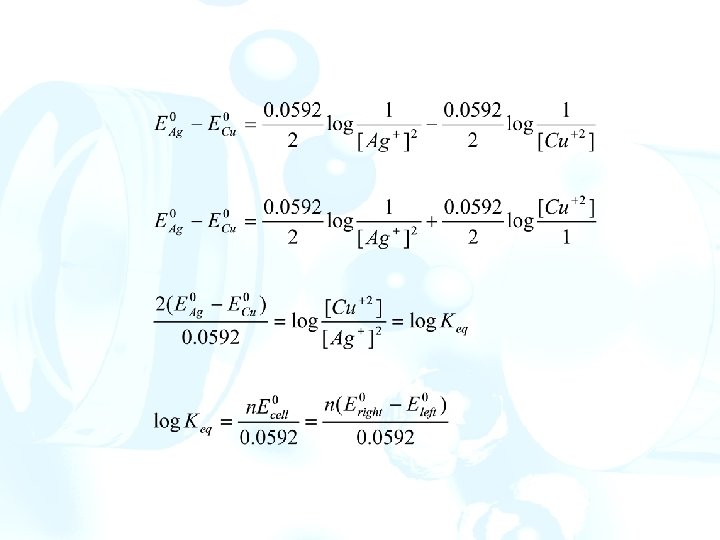
Consider the reaction: Cu(s) + 2 Ag+ Cu+2 + 2 Ag(s) The equilibrium constant for this reaction is Keq = [Cu+2]/[Ag+]2 The cell potential at any given instant is Ecell = Eright – Eleft = EAg+/Ag – ECu+2/Cu As the reaction proceeds, the concentration of Cu(II) ions increases, and the concentration of Ag(I) ions decreases. At equilibrium, Ecell = Eleft = EAg = Ecu The electrode potentials for all half-reactions in an oxidation/reduction system are equal. Substituting Nernst expressions for the two electrode potentials:
19 D Constructing redox titration curves There is a logarithmic relationship between electrode potential and concentration of the analyte or titrant. Hence, redox titration curves are similar in appearance to those for other types of titrations in which a p-function is plotted as the ordinate. 19 D-1 Electrode Potentials during Redox Titrations Consider the redox titration of iron(II) with a standard solution of cerium(IV). Fe+2 + Ce+4 Fe+3 + Ce+3 The electrode potentials for the two half- reactions are always identical. ECe+4/Ce+3 = EFe+3/Fe+2 = Esystem is the potential of the system.
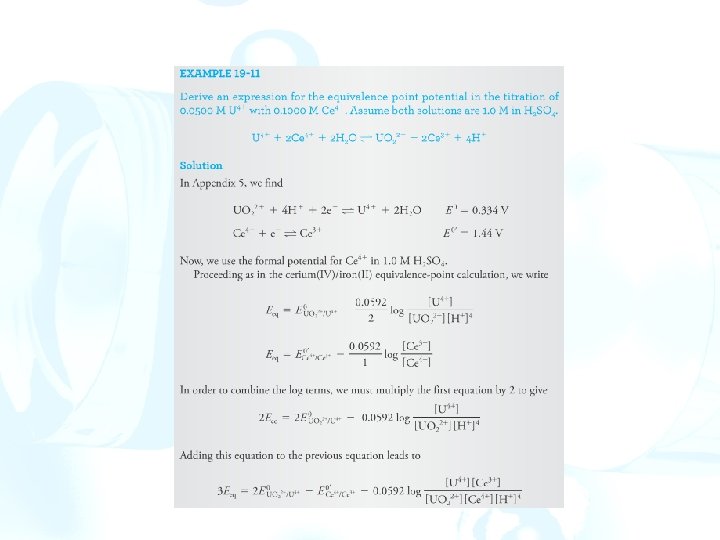
The titration mixture of the reaction can be treated as pat of the hypothetical cell: SHE|| Ce+4, Ce+3, Fe+2| Pt Equivalence-Point Potentials At the equivalence point, the concentration of cerium(IV) and iron(II) are minute; however, equivalence-point potentials are easily obtained.
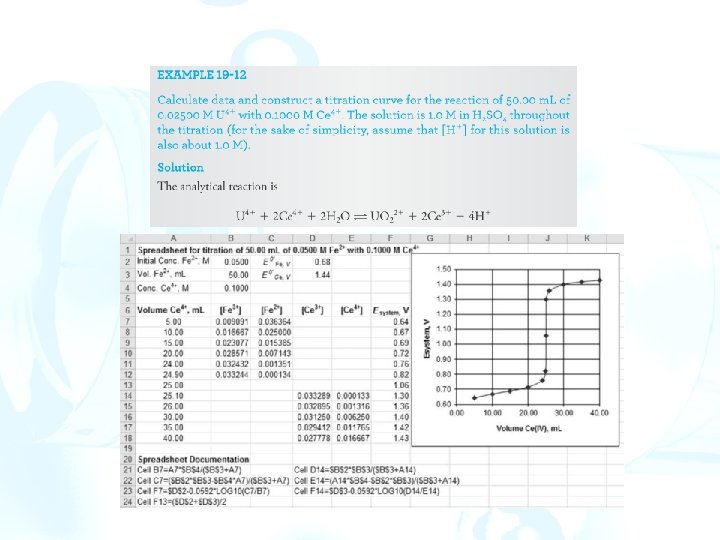
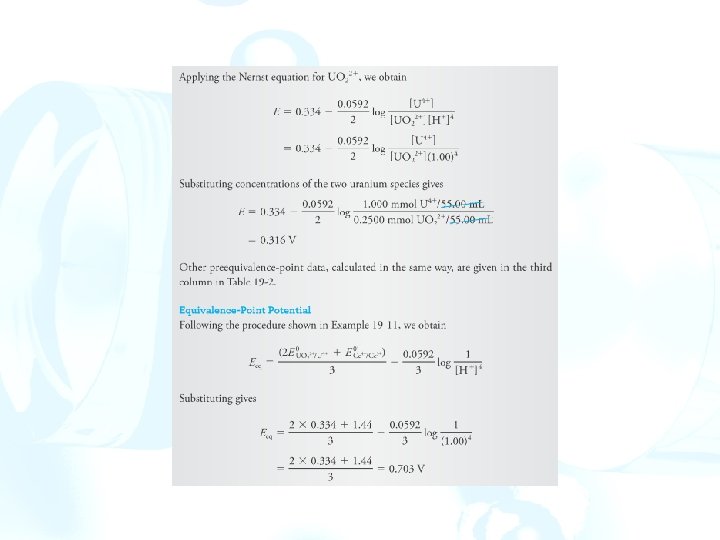
19 D-2 The Titration Curve Consider the titration of 50. 00 m. L of 0. 0500 M Fe+2 with 0. 1000 M Ce+4 in a medium that is 1. 0 M in H 2 SO 4
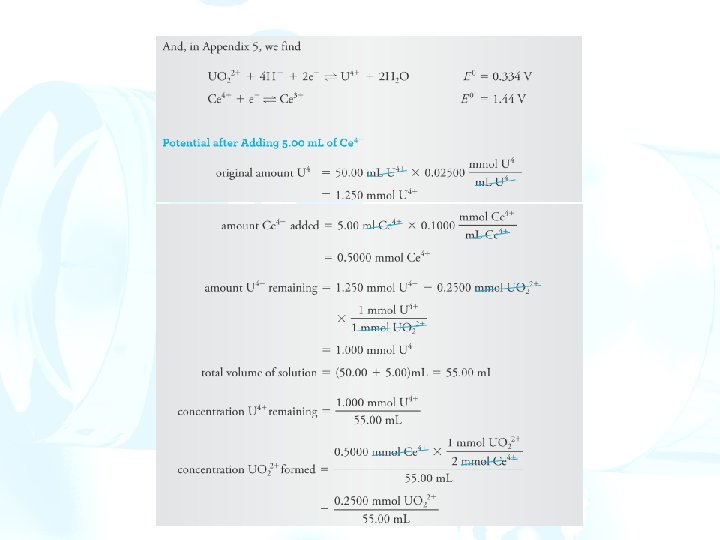
Initial Potential There is not enough information to calculate an initial potential. Potential after the Addition of 5. 00 m. L of Cerium(IV) When oxidant is added, Ce+3 and Fe+3 are formed. The equilibrium concentration of Fe(III) is equal to its molar analytical concentration minus the molar equilibrium concentration of the unreacted Ce(IV).
Equivalence-Point Potential From the two formal potentials, we get Eeq =1. 06 V
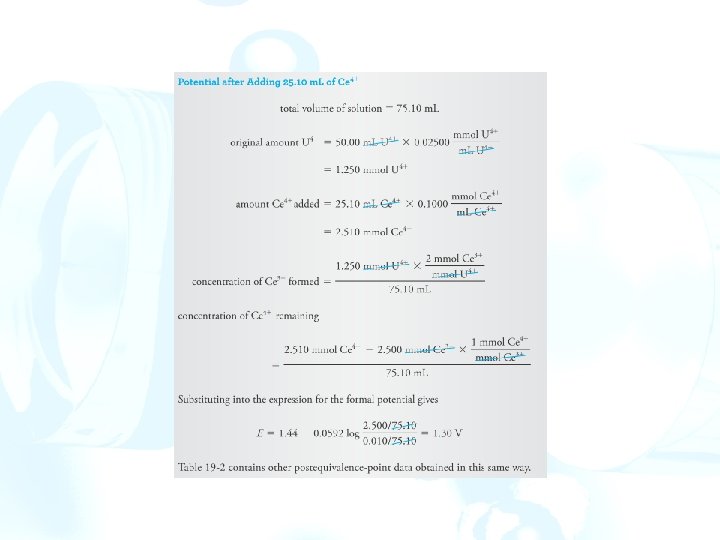
Potential after Adding 25. 10 m. L of Cerium(IV)
Effect of Variables on Redox Titration Curves Reactant Concentration Titration curves for oxidation/reduction reactions are usually independent of analyte and reagent concentrations. Completeness of the Reaction
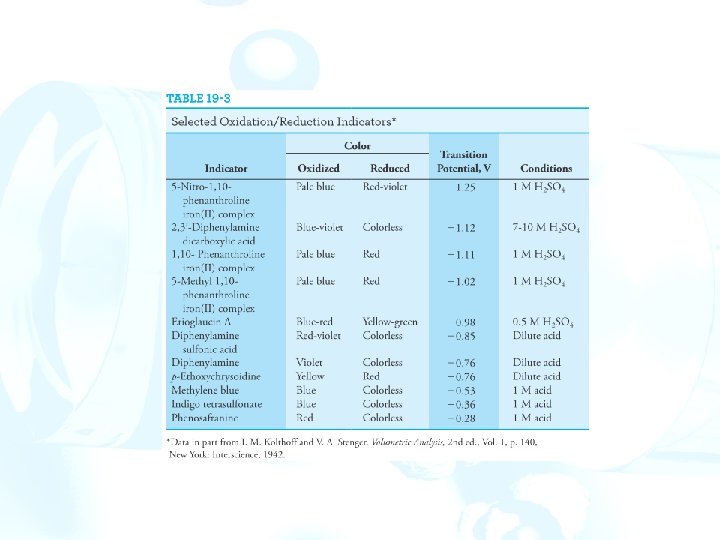
19 E Oxidation/reduction Indicators Two types of chemical indicators are used for obtaining end points for oxidation/reduction titrations: General Redox Indicators These indicators change color on being oxidized or reduced. The half-reaction responsible for color change is: Inox + ne- Inred If the indicator reaction is reversible, The potential change required to produce the full color change of a typical general indicator can be expressed as:
Iron(II) Complexes of Orthophenanthrolines A class of organic compounds known as 1, 10 -phenanthrolines, or orthophenanthrolines, form stable complexes with iron(II) and certain other ions. Three orthophenanthroline molecules combine with each iron ion to yield a complex. The complexed iron in ferroin undergoes a reversible oxidation/reduction reaction: (phen)3 Fe+3 + e- (phen)3 Fe+2
Starch/Iodine Solutions Starch, which forms a blue complex with triiodide ion, is a widely used specific indicator in oxidation/reduction reactions involving iodine as an oxidant or iodide ion as a reductant. Specific Indicators The best-known specific indicator is starch, which forms a dark blue complex with triiodide ion. Potassium thiocyanate is another specific indicator which may be used in the titration of iron(III) with solutions of titanium(III) sulfate. 19 F Potentiometric end points The end points for many oxidation/reduction titrations can be observed by making the solution of the analyte part of the cell reference electrode || analyte solution | Pt