AOSC 200 Lesson 3 Fig 3 1 p


 average")


 temperature inversion (A) Mid-afternoon (B) Evening")


- Slides: 40
AOSC 200 Lesson 3
Fig. 3 -1, p. 54
Diurnal temperature cycle Fig. 3 -3, p. 56
Air temperature data • Daily mean temperature is determined by two methods, (a) average of 24 hourly measurements (b) the average of the maximum and minimum temperatures for the day. • Daily temperature range is the difference between the max and min temperatures. • Monthly mean temperature is obtained from the average of the daily mean for the month • Annual mean temperature is the average of the monthly means • Annual temperature range is the difference between the coldest monthly mean and the warmest monthly mean
CONTROLS OF TEMPERATURE • • LATITUDE SURFACE TYPE ELEVATION AND ASPECT DIFFERENTIAL HEATING OF LAND WATER. • OCEAN CURRENTS. • CLOUD COVER AND ALBEDO
Fig. 3 -4, p. 57
Fig. 3 -5, p. 57
Fig. 3 -6, p. 58
Fig. 3 -7, p. 59
The effect of Aspect Fig. 3. 8
Fig. 3 -9, p. 60
Differential Heating of Land Water • AS WATER IS HEATED CONVECTION DISTRIBUTES THE HEAT THROUGH A LARGE MASS. • IN CONTRAST, HEAT DOES NOT PENETRATE DEEPLY INTO SOIL OR ROCK - HEAT CAN ONLY BE TRANSFERRED BY CONDUCTION. • NET RESULT IS THAT A RELATIVELY THICK LAYER OF WATER IS HEATED TO MODERATE TEMPERATURES, WHILE ONLY A THIN LAYER OF LAND IS HEATED TO MUCH HIGHER TEMPERATURES. • SPECIFIC HEAT (AMOUNT OF HEAT NEEDED TO RAISE THE TEMPERATURE OF ONE GRAM OF A SUBSTANCE 1 DEGREE CELSIUS) IS ALMOST THREE TIMES GREATER FOR WATER THAN FOR LAND
Fig. 3 -10, p. 60
Fig. 3 -11, p. 61
Effect of clouds on the daytime energy budget at the surface
Fig. 3 -13, p. 62
Fig. 3 -16, p. 67
DAILY MARCH OF TEMPERATURE • AT THE BEGINNING OF THE DAY, WITH NO SOLAR RADIATION, THE TEMPERATURE IS CONTROLLED BY NET THERMAL RADIATION LEAVING THE SURFACE ---THE GROUND COOLS. • AS SUN COMES UP , SOLAR RADIATION IS ABSORBED AND THE TEMPERATURE OF THE GROUND INCREASES INCREASING THE NET THERMAL RADIATION LEAVING THE GROUND. • HOWEVER, IN GENERAL THE INCOMING SOLAR ENERGY IS MORE THAN THE NET OUTGOING THERMAL ENERGY, SO THE GROUND HEATS UP. • THE GROUND WILL CONTINUE TO HEAT UP UNTIL THE AMOUNT OF INCOMING SOLAR ENERGY EQUALS THE AMOUNT OF OUTGOING THERMAL ENERGY. • THIS OCCURS TYPICALLY AT ABOUT THREE/FOUR IN THE AFTERNOON. • SIMILAR ARGUMENTS EXPLAIN THE LAG SEEN IN THE WINTER AND SUMMER.
CONTROLS OF DIURNAL TEMPERATURE RANGE • LATITUDE - DETERMINES THE INTENSITY OF THE SUN, AND THE LENGTH OF THE DAY • SURFACE TYPE - LAND WATER CONTRAST, BARE SOIL VERSUS VEGETATION • ELEVATION AND ASPECT • RELATIONSHIP TO LARGE BODIES OF WATER ACT LIKE A THERMOSTAT - TEMPERATURE RANGE IS SMALLER • OCEAN CURRENTS. • CLOUD COVER - REDUCES THE DIURNAL TEMPERATURE RANGE.
Fig. 3 -14, p. 63
Interannual Temperature Variations • AVERAGE OR NORMAL TEMPERATURES • ANOMALIES • VOLCANOES • EL NINO / LA NINA
Volcanoes Fig. 3 -15 a, p. 66
Picture taken by astronauts on the Space Shuttle 3 weeks after the eruption of Mt. Pinatubo Fig. 3. 15 b
Temperature in Spokane and Boise after the eruption of Mount St. Helens Box 3 -1, p. 64
http: //www. youtube. com/watch? v= d. Qe. CEqk. E 9 e. E
Fig. 3 -17, p. 72
Fig. 2. 7
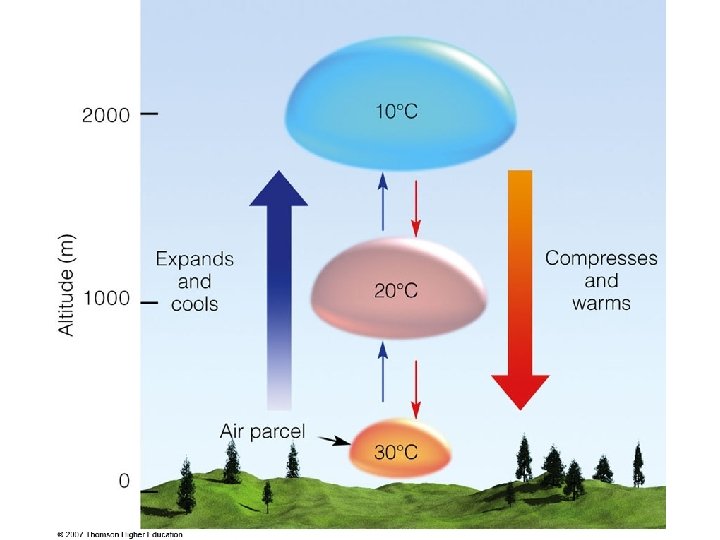
Adiabatic Cooling and Warming • • • A RISING PARCEL OF AIR ALWAYS EXPANDS AS THE PARCEL EXPANDS IT WILL COOL ADIABATIC PROCESS - NO HEAT EBERGY IS GAINED OR LOST BY THE PARCEL THE RATE OF COOLING WITH ALTITUDE DUE TO THIS PROCESS IS CALLED THE DRY ADIABATIC LAPSE RATE USUALLY THE AIR CONTAINS SOME WATER VAPOR AS THE PARCEL RISES AN ALTITUDE WILL BE REACHED WHEN THE WATER VAPOR CONDENSES BUT THIS RELEASES LATENT HEAT OF CONDENSATION TO THE AIR PARCEL THEREFORE THE TEMPERAURE OF THE PARCEL WILL NOT DROP OFF AS MUCH AS FOR A DRY PARCEL OF AIR WET ADIABATIC LAPSE RATE
Fig. 3 -18, p. 73
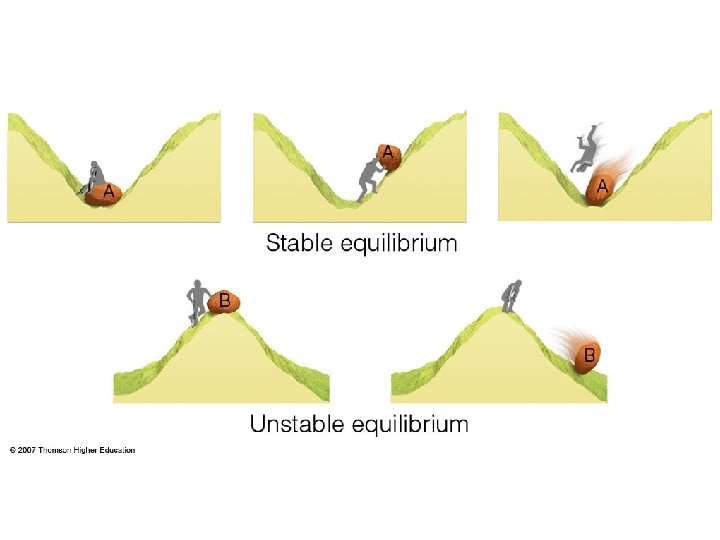
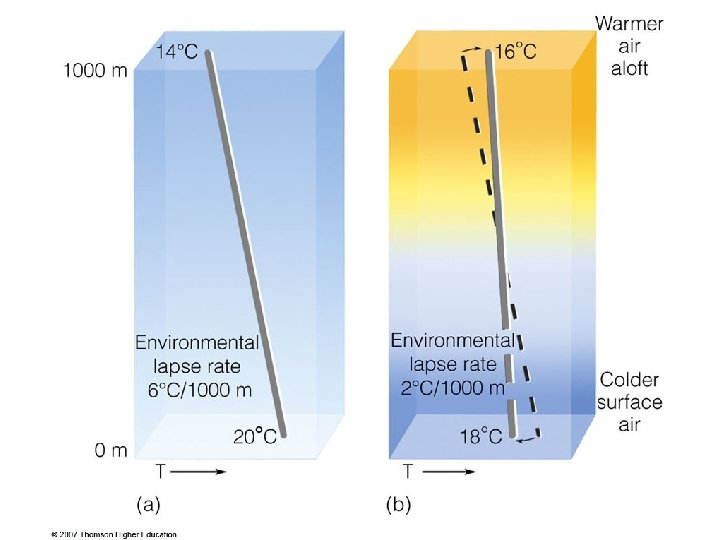
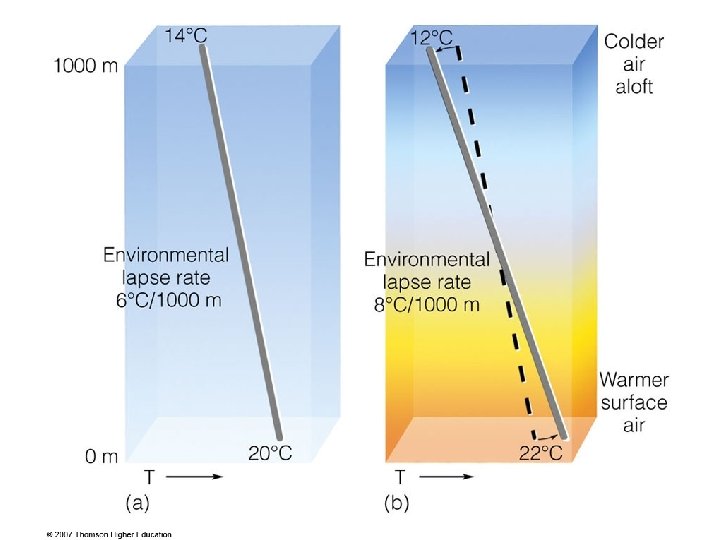
Lapse Rates and Stability • Lapse rate is the rate at which the real atmosphere falls off with altitude – the environmental lapse rate • An average value is 6. 5 ºC per kilometer • This should be compared with the adiabatic lapse rate of 10 ºC. • If the environmental lapse rate is less than 10 ºC, then the atmosphere is absolutely stable • If greater than 10 ºC, it is absolutely unstable
Fig. 3. 12 Lifecycle of a nocturnal (radiative) temperature inversion (A) Mid-afternoon (B) Evening (C) Sunrise (D) Mid-morning Fig. 3 -19, p. 75
Temperature Inversions • When the temperature profile increases with altitude, this is known as a temperature inversion • Two main types – subsidence inversion and radiation inversion (nocturnal inversion) • Very important during pollution events – trap pollutants close to the surface.
Temperature Inversions
Effect of a temperature inversion Fig. 3 -20, p. 77
Wind Chill Factor • The wind chill factor describes the increased loss of heat by the movement of air • It cannot be measured, so it is calculated • Wind chill equivalent temperature
Table 3 -1, p. 78