Visualizing State Transition Graphs Hannes Pretorius Visualization Group


 where: • Node s in V is")


 where: • Node s in V is")
 where: • Node s in V is")


")
- Slides: 72
Visualizing State Transition Graphs Hannes Pretorius Visualization Group, TU/e 17 October 2007 a. j. pretorius@tue. nl www. win. tue. nl/~apretori/
Introduction
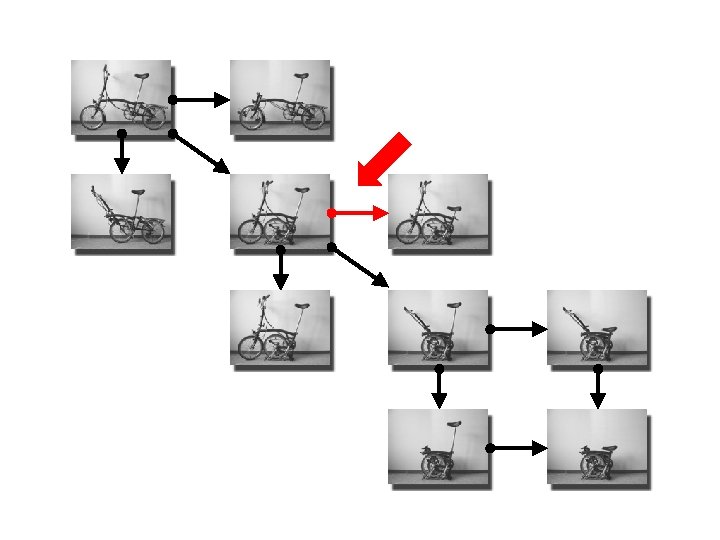
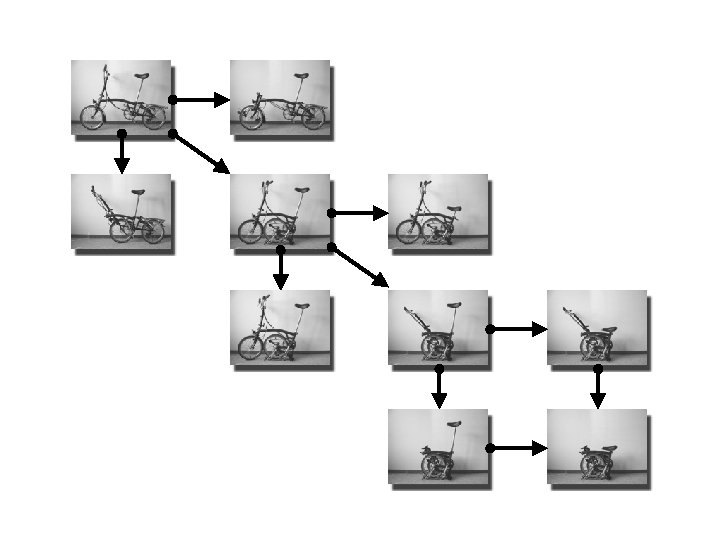
State transition graph G = (V, E) where: • Node s in V is a possible system state • Directed edge t = (s, s’) in E is a transition from source state s to target state s’
Research question “How can visualization be used to gain insight into state transition graphs? ”
Research question “How can visualization be used to gain insight into state transition graphs? ” • What is insight? – Symmetries, patterns… • What about size? – System behavior is often complex • Typical users? – Small number of expert users
Related work Van Ham et al. , TVCG, 2002.
Van Ham et al. , TVCG, 2002.
Approach
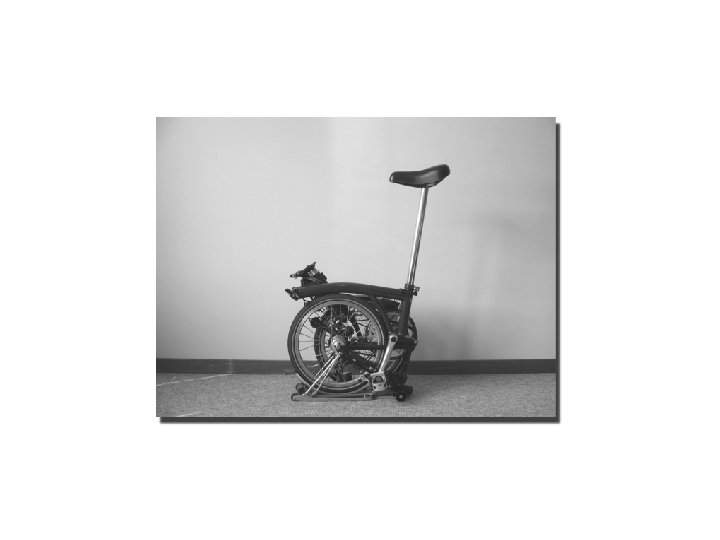
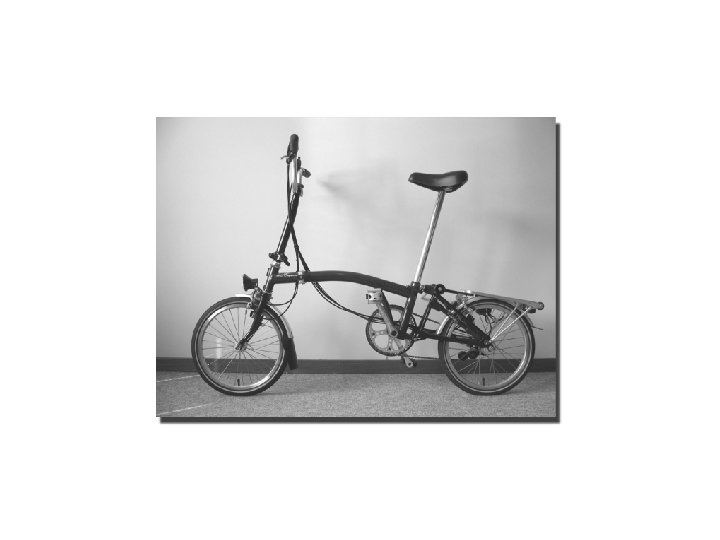
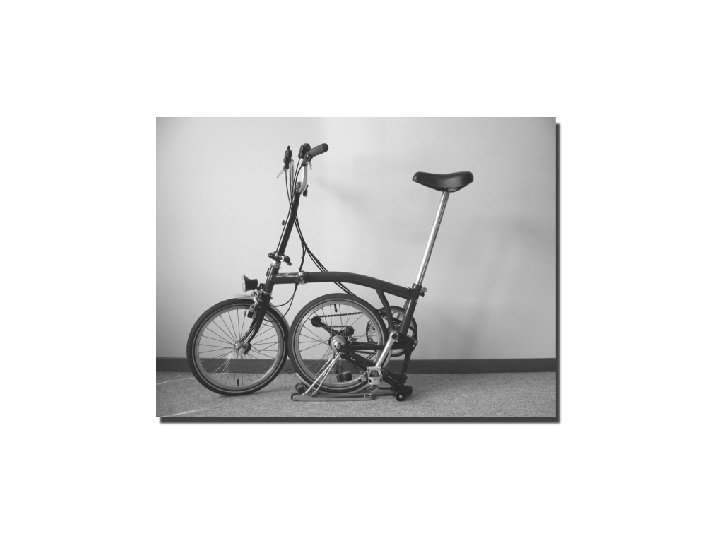
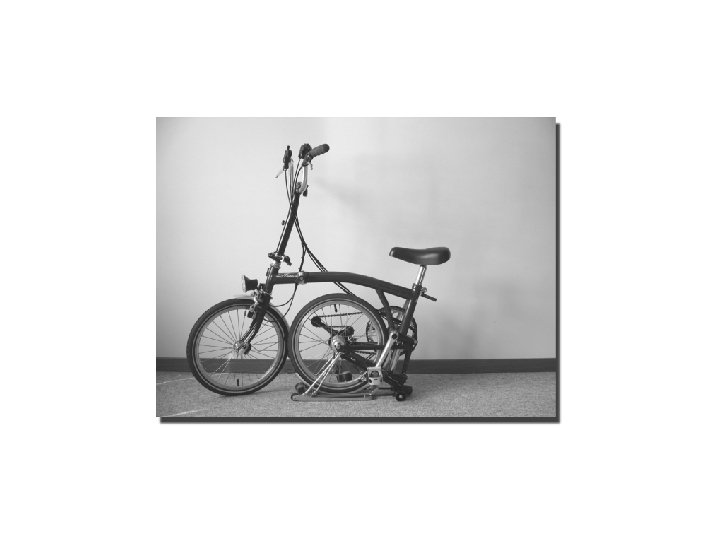
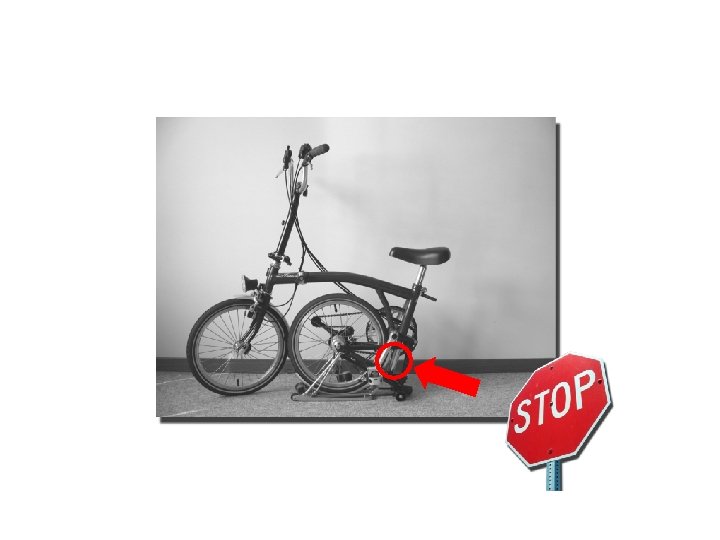
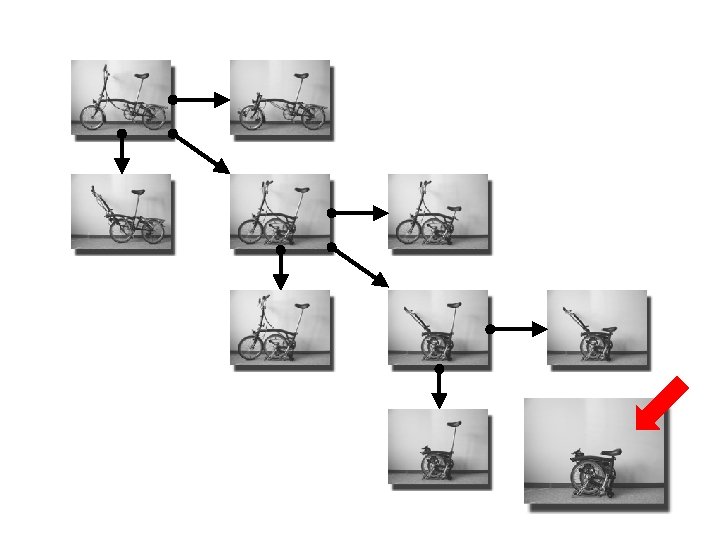
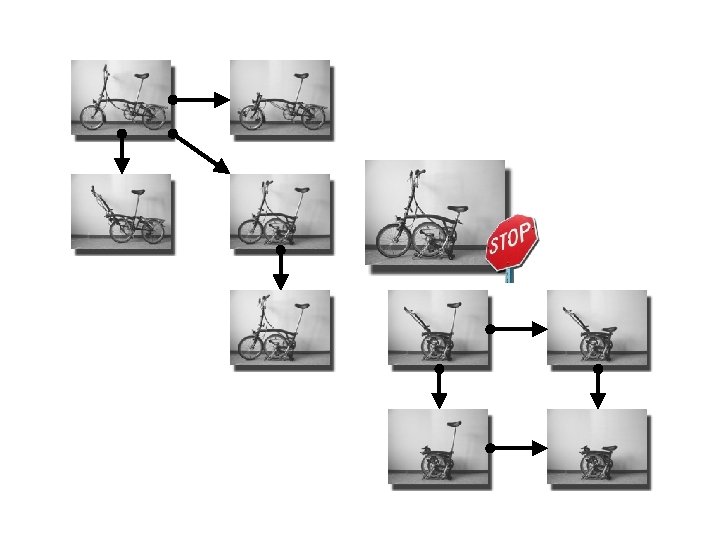
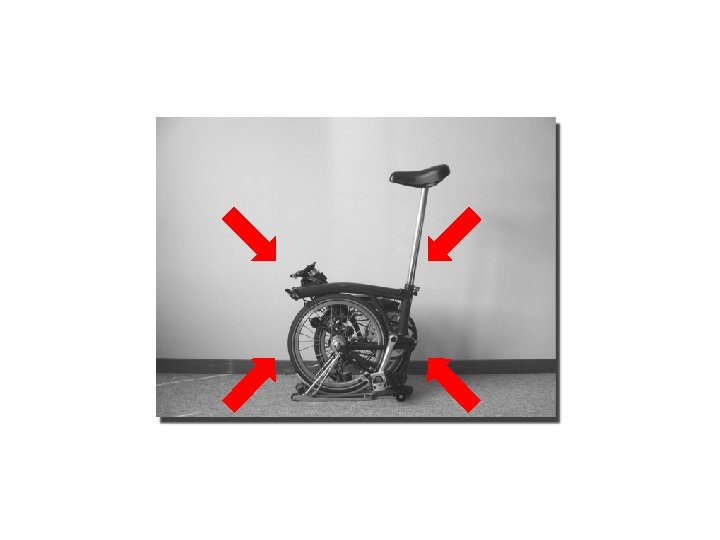
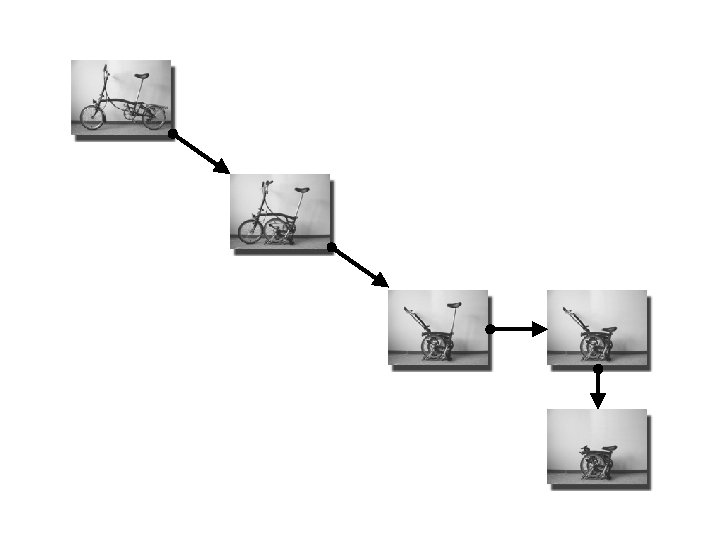
Handle_pos = Front_wheel_pos = Back_wheel_pos = Seat_pos = up out in down
Handle_pos = Front_wheel_pos = Back_wheel_pos = Seat_pos = down in out up
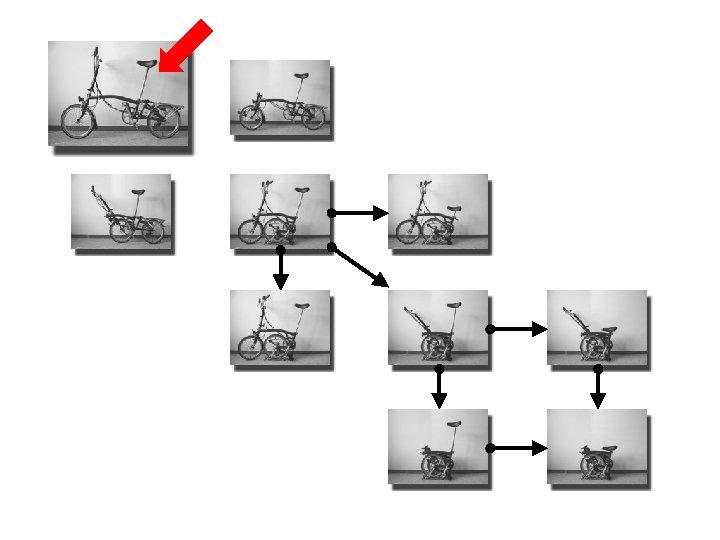
State transition graph G = (V, E) where: • Node s in V is a possible system state • Directed edge t = (s, s’) in E is a transition from source state s to target state s’
State transition graph G = (V, E) where: • Node s in V is a possible system state • Directed edge t = (s, s’) in E is a transition from source state s to target state s’ Every node s in V has: • n associated attributes ai • ai has domain Ai = {ai, 1, …, ai, ki}
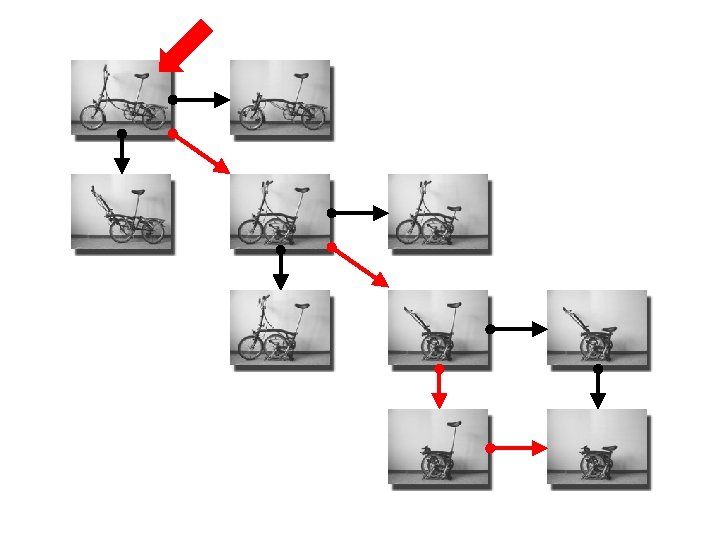
Projection Pretorius and Van Wijk, IV, 2005.
Projection • Multivariate data: – Select interesting subset – Show low-dimensional projection Pretorius and Van Wijk, IV, 2005.
Projection • Multivariate data: – Select interesting subset – Show low-dimensional projection • Suggestive behavioral patterns • Meaning of positions projected to not clear • Select subset based on domain knowledge Pretorius and Van Wijk, IV, 2005.
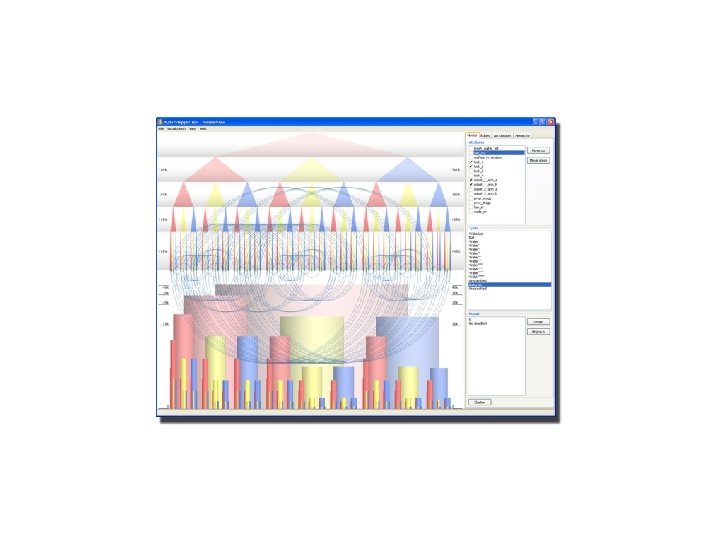
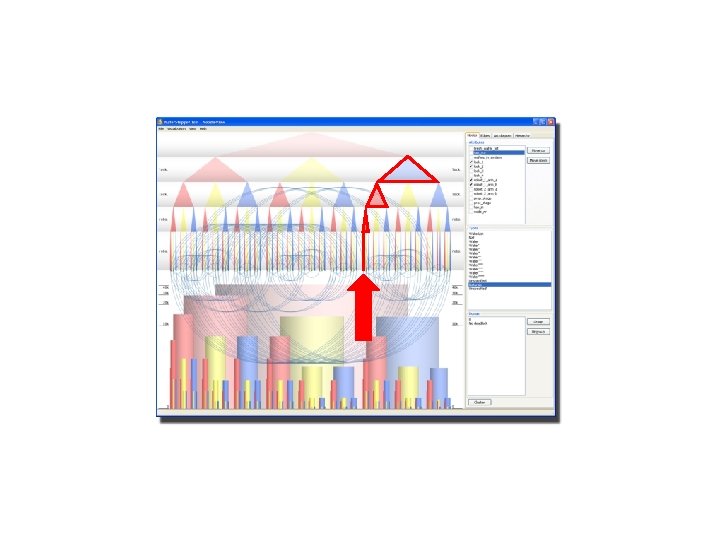
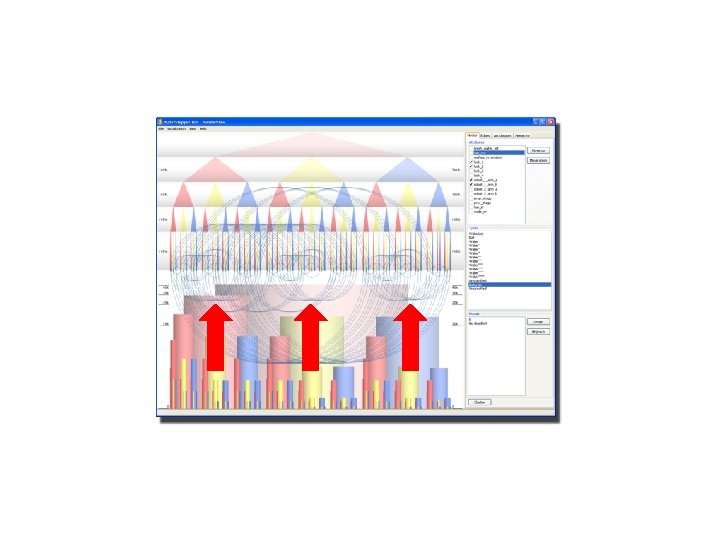
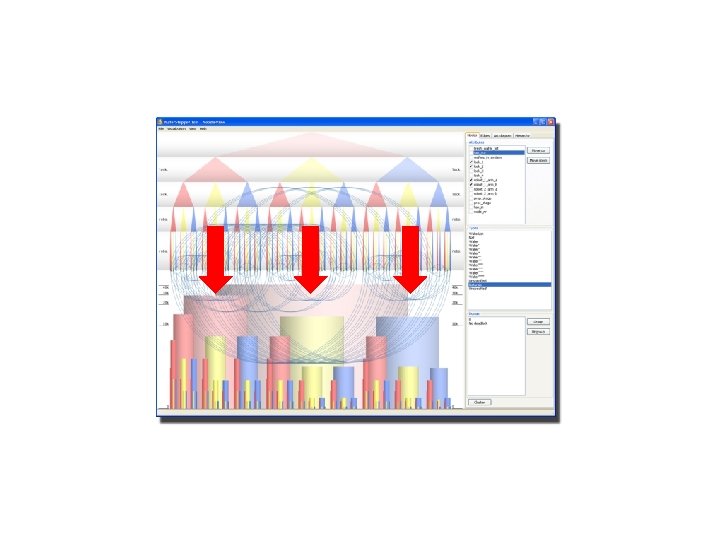
Clustering Pretorius and Van Wijk, Info. Vis, 2006.
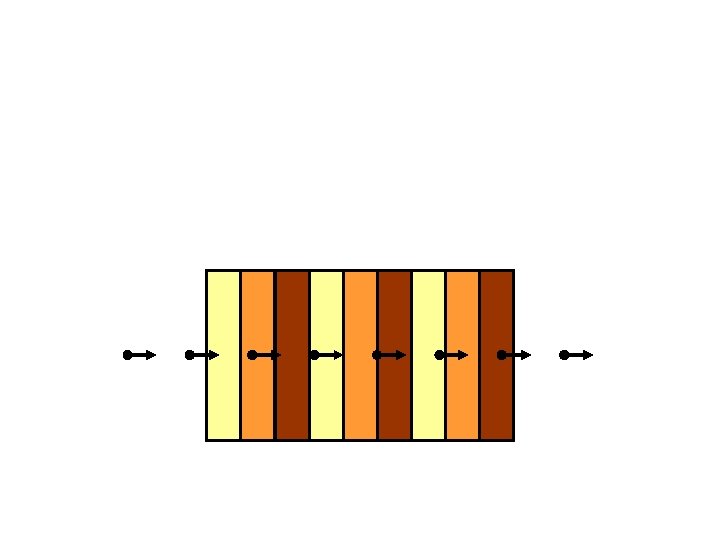
All states Handle_pos Seat_pos
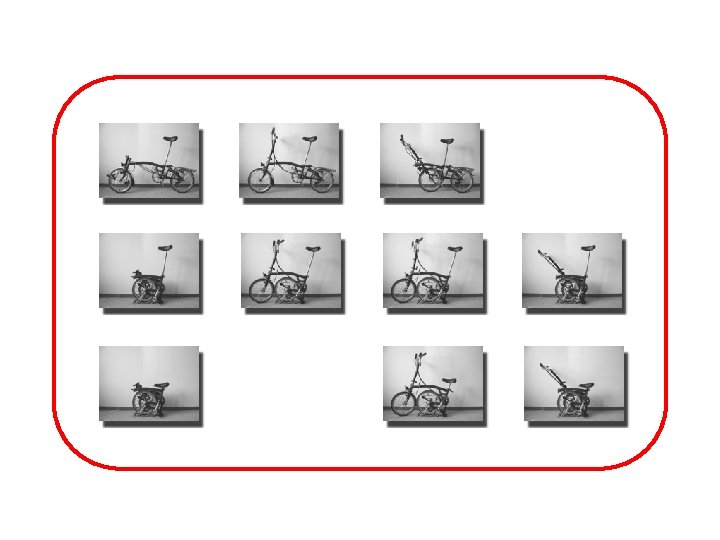
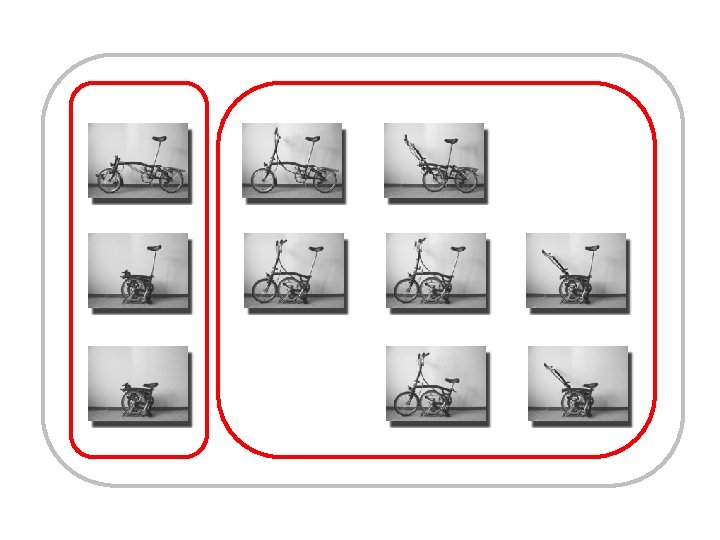
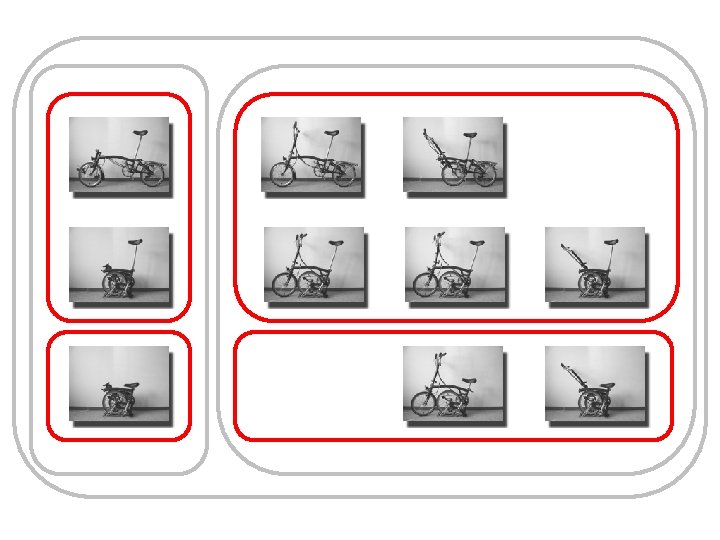
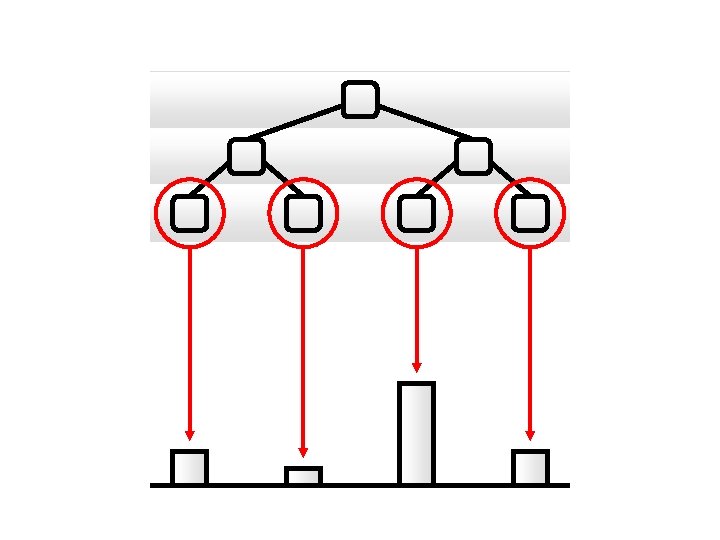
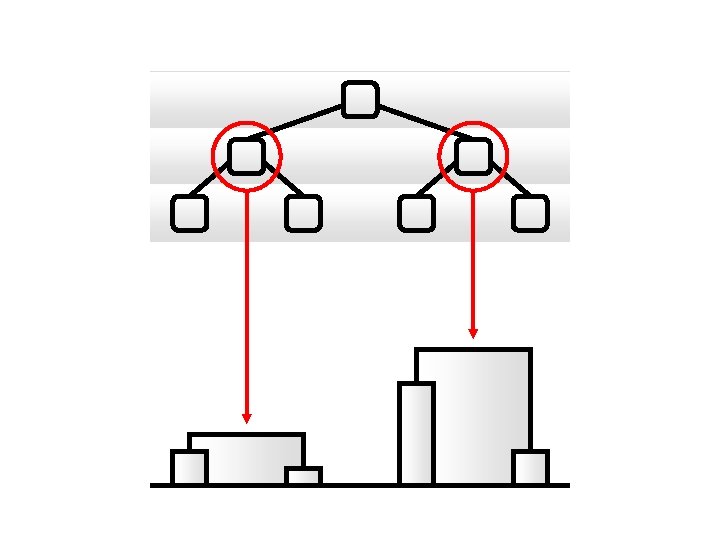
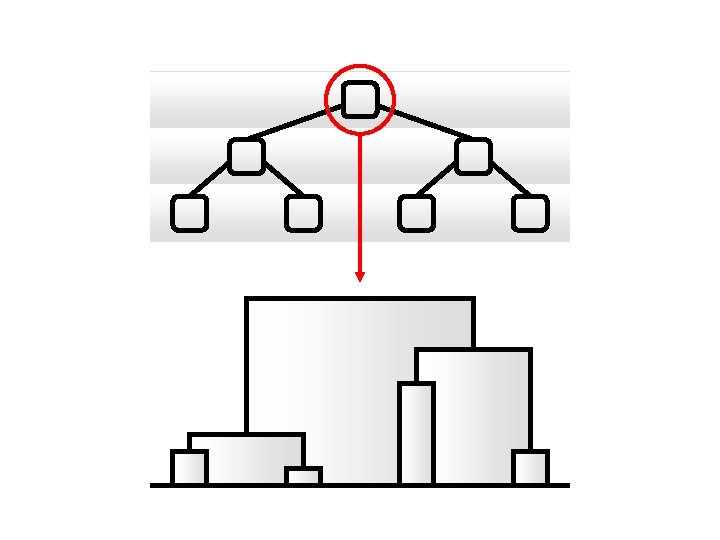
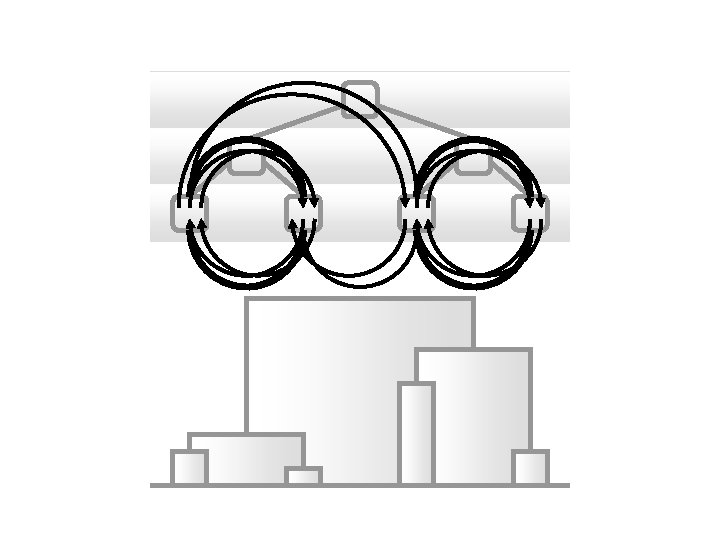
Clustering • Choose subsets based on domain knowledge • Position clusters linearly • Show additional information on top of this: – Clustering hierarchy – Arcs representing transitions – Bar tree representing size of clusters Pretorius and Van Wijk, Info. Vis, 2006.
Clustering • Reduce complexity – Location has meaning • Patterns: – Attribute values – Behavior – Cluster sizes • Different types of analysis: – Explorative (e. g. different perspectives) – Specific (e. g. deadlock analysis) Pretorius and Van Wijk, Info. Vis, 2006.
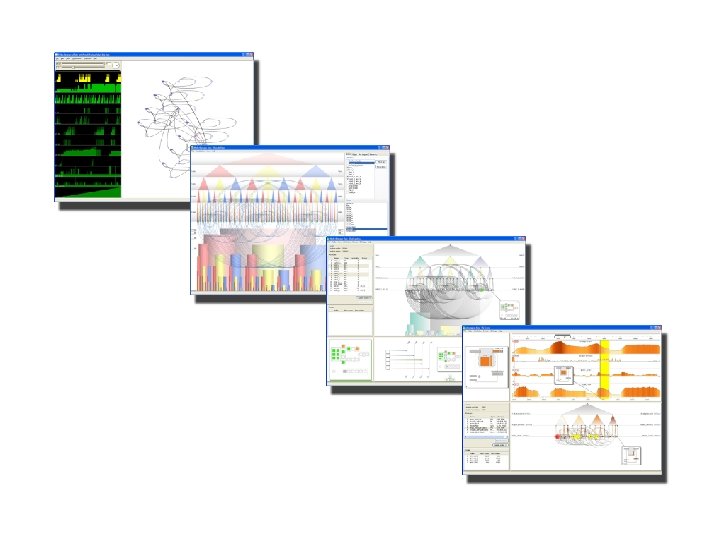
Custom diagrams Pretorius and Van Wijk, CG&A, 2007. Mathijssen and Pretorius, LNCS, 2007.
Pretorius and Van Wijk, CG&A, 2007. Mathijssen and Pretorius, LNCS, 2007.
Pretorius and Van Wijk, CG&A, 2007. Mathijssen and Pretorius, LNCS, 2007.
Custom diagrams • Support diagramming in general way: – Edit diagrams – Link with attributes • Capture conceptualization of problem Pretorius and Van Wijk, CG&A, 2007. Mathijssen and Pretorius, LNCS, 2007.
Custom diagrams • Support diagramming in general way: – Edit diagrams – Link with attributes • • Capture conceptualization of problem Semantics clear and intuitive Analysis and communication Flexible Pretorius and Van Wijk, CG&A, 2007. Mathijssen and Pretorius, LNCS, 2007.
Wafer stepper Paint factory Petri nets
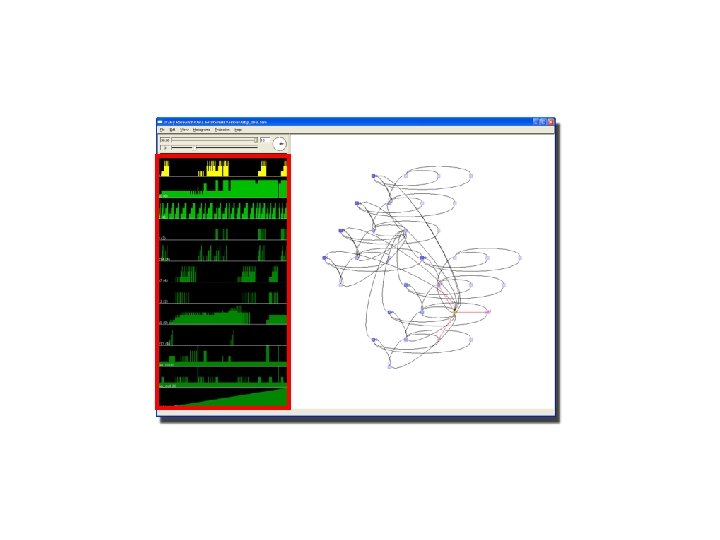
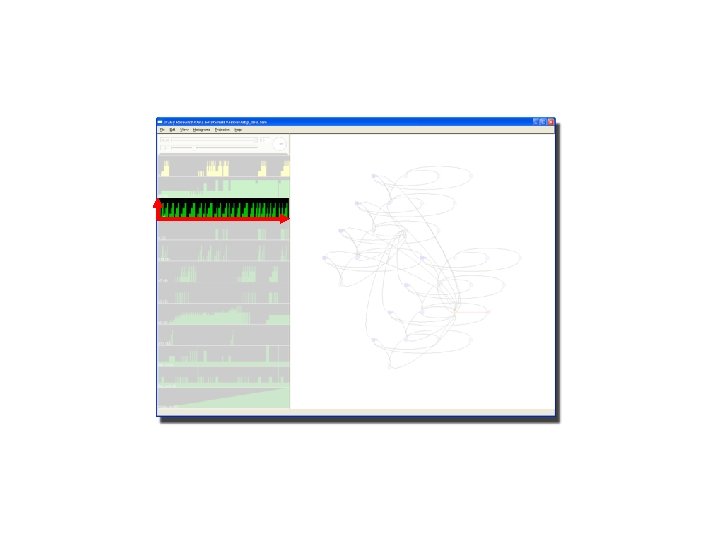
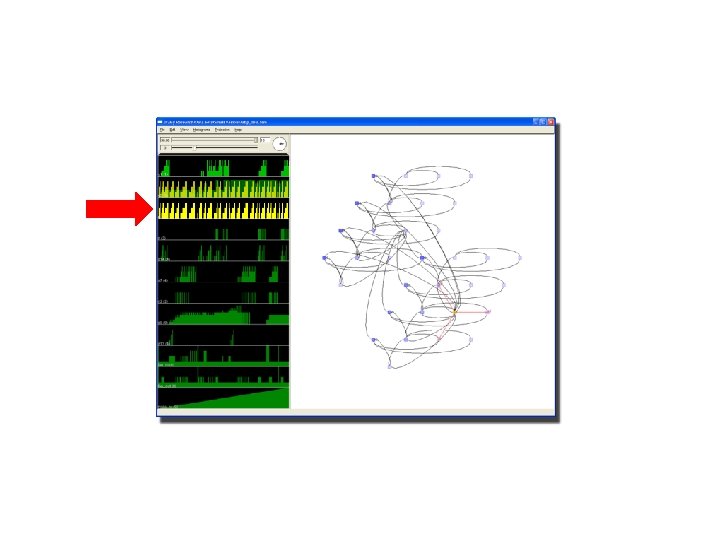
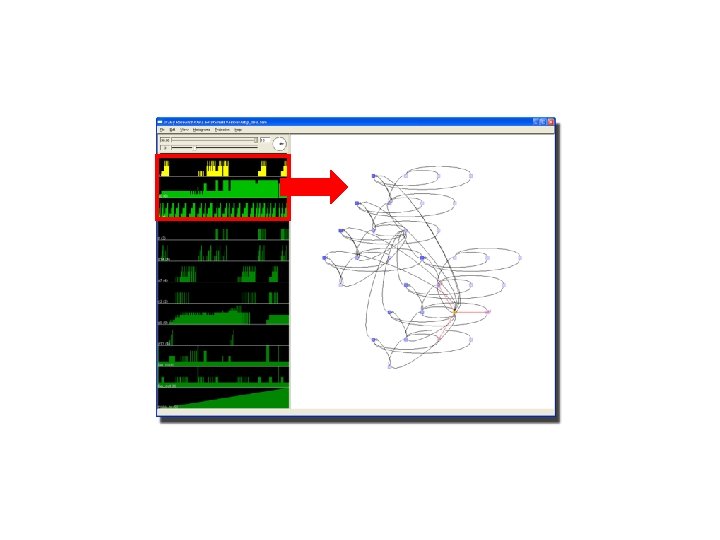
Trace visualization Submitted, Pacific. Vis, 2008.
1 Attributes n 1 2 1 Time k
1 Time k 1 Attributes n
3
Submitted, Pacific. Vis, 2008.
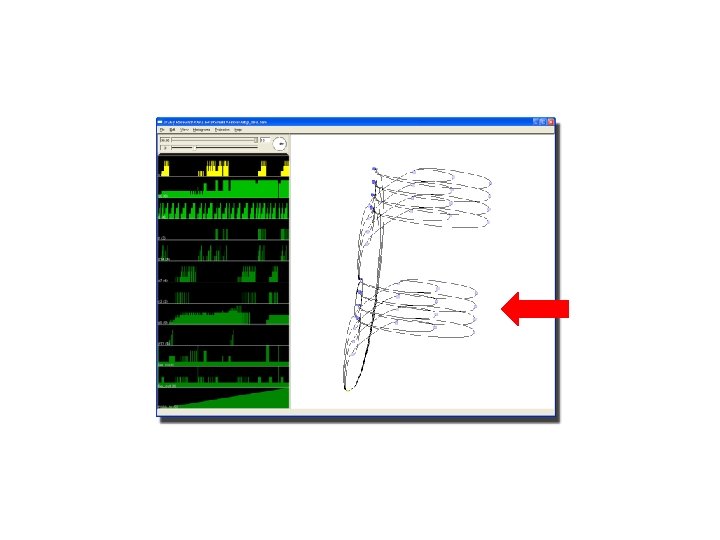
Trace visualization • Traces: – Curb size and complexity – Users intuitively relate to time Submitted, Pacific. Vis, 2008.
Trace visualization • Traces: – Curb size and complexity – Users intuitively relate to time • Three views: 1. Diagram: easier to interpret 2. Time series: general trends 3. Transition graph: generalized behavior Submitted, Pacific. Vis, 2008.
Conclusion • Visualization of state transition graphs • Prototyping • Focus on state attributes – Clear semantics • Explorative analysis: – E. g. different perspectives • Focused analysis: – E. g. deadlock, steam flow
Questions www. win. tue. nl/~apretori/
Projection (cont. )