Visualizing and Understanding Convolutional Networks By Patrapee Pongtana

Visualizing and Understanding Convolutional Networks By Patrapee Pongtana Credit: Matthew D. Zeiler, Rob Fergus Dept. of Computer Science, Courant Institute, New York University

Background of Convolutional Neural Networks ● Previously, Alex Krizhevsky has achieved error rate as low as 16. 4% on Top-5 Test ● Architecture consists of 5 convolutional layers and 3 fully connected layers ● Krizhevsky utilized ○ ○ ○ A large dataset that consists of millions of labeled examples A powerful GPU to train a large model A dropout method to regularize the better model

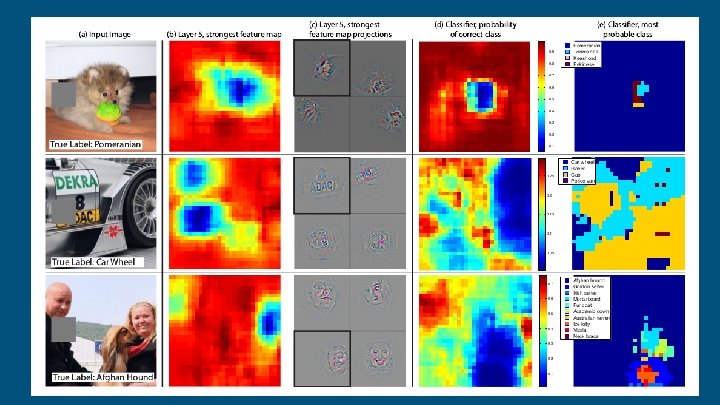
Motivation ● To observe each layer’s highest activation on feature maps ● To map these highest activation location back to input pixel space ● To learn what machine learns

Multi Layered Deconvolutional Network ● Performed under unsupervised learning ● Max-pooling MUST be able to reversed back ● The convolutional during reconstruct will perform conv transpose

Reconstruction Switches

Feature Map Top-9 Patches

Top-9 Highest of Activation from validation set

Top-9 Highest of Activation from validation set

Top-9 Highest of Activation from validation set

Top-9 Highest of Activation from validation set Layer 4

Matt Zeiber’s Architecture

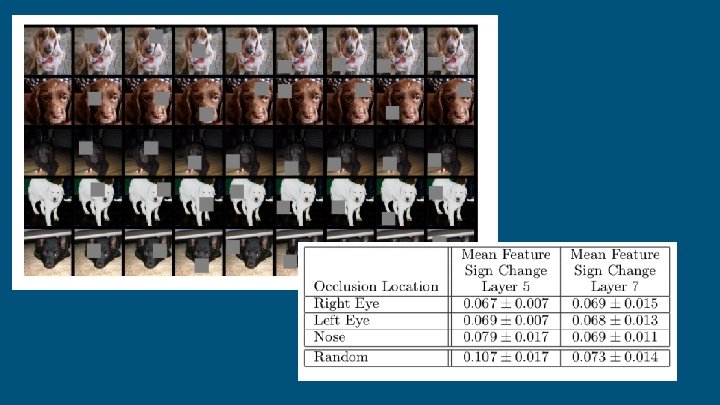
Result

Conclusion The visualization of how machine learn helps us improve the performance by exploring the key location of each pixel E. g. We can know which hidden layer will be able to distinguish between human face and a dog face The intuition of this research is to explain “how” and “what” hidden layers (conv layers) learn features with given filters
- Slides: 15