Transition State Theory Energy Diagram for a TwoStep


 or activated complex theory (ACT). l In a reaction step")


- Slides: 16
Transition State Theory
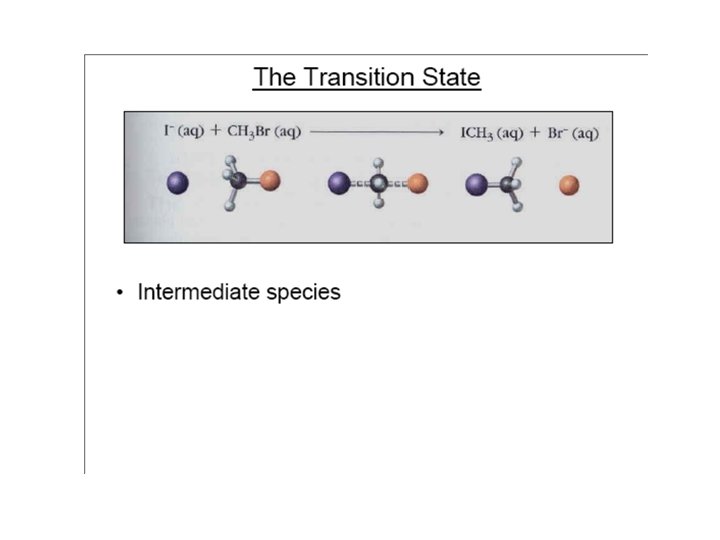
Energy Diagram for a Two-Step Reaction • Reactants transition state intermediate • Intermediate transition state product =>
Rate-Determining Step • Reaction intermediates are stable as long as they don’t collide with another molecule or atom, but they are very reactive. Trapping agents are used to determine intermediate Transition states are at energy maxima. The reaction step with highest Ea will be the slowest, therefore rate-determining for the entire reaction.
Reaction Coordinate Diagram The course of a reaction can be illustrated by means of a reaction coordinate diagram. The Transition State is the point of highest energy along the minimum energy trajectory (i. e. , the reaction coordinate) of a reaction. The Energy of Activation is defined as the energy required to attain the Transition State.
Transition State and Reaction Velocity Gfinal - Ginitial = constant Gactivation has changed
“Activated complex” or “transition state” theory: B + C BC‡ D + E BC‡ is the activated complex or transition state maximum energy barrier k = Boltzmann constant h = Plank’s constant Ea = potential energy of activation, H‡ is the total:
06523 Kinetics. Lecture 10 Transition state theory Thermodynamic approach Statistical thermodynamics Eyring equation Potential energy surfaces Reactions in solution Solvent effects Kinetic and mass transfer control Note. It is not necessary to learn complex derivations. These are provided to assist appreciation of theory. pptpres 7 9
Transition state theory (TST) or activated complex theory (ACT). l In a reaction step as the reactant molecules A and B come together they distort and begin to share, exchange or discard atoms. l They form a loose structure of high potential energy called the activated complex that is poised to pass on to products or collapse back to reactants C + D. AB‡ l The peak energy occurs at the transition state. The energy difference from the ground state is the activation energy Ea of the reaction step. l The potential energy falls as the atoms rearrange in the cluster finally reaches the value for pptpres 7 and 10 E a A+ B C+ D
Transition state theory continued l The theory attempts to explain the size of the rate constant kr and its temperature dependence from the actual progress of the reaction (reaction coordinate). l The progress along the reaction coordinate can be considered in terms of the approach and then reaction of an H atom to an F 2 molecule l When far apart the potential energy is the sum of the values for H and F 2 l When close enough their orbitals start to overlap – A bond starts to form between H and the closer F atom H · · ·F─F – The F─F bond starts to lengthen l As H becomes closer still the H · · · F bond becomes shorter and stronger and the F─F bond becomes longer and weaker – The atoms enter the region of the activated complex l When the three atoms reach the point of maximum potential pptpres 7 11
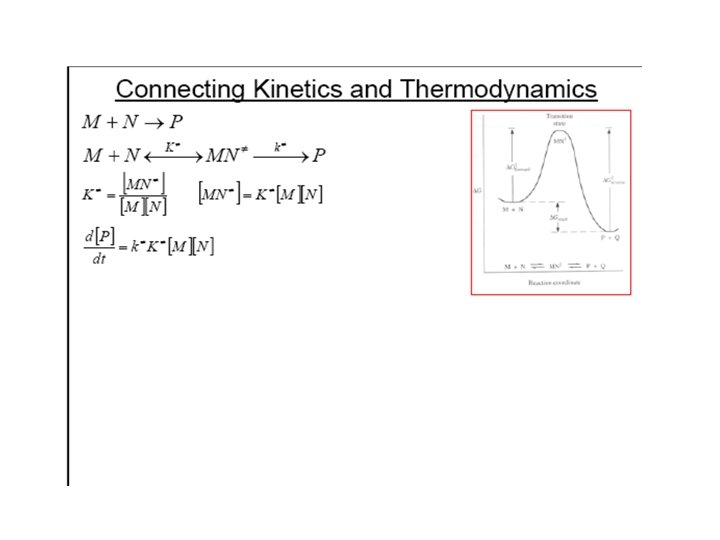
Thermodynamic approach l Suppose that the activated complex AB‡ is in equilibrium with the reactants with an equilibrium constant designated K‡ and decomposes to products with rate constant k‡ K‡ k‡ A+B activated complex AB‡ products where K‡ l Therefore rate of formation of products = k‡ [AB‡ ] = k‡ K‡ [A][B] l Compare this expression to the rate law: rate of formation of products = kr [A][B] l Hence the rate constant kr = k‡ K‡ l The Gibbs energy for the process is given by Δ‡ G = −RTln(K‡ ) and so K‡ = exp(− Δ‡ G/RT) l Hence rate constant kr = k‡ exp (−(Δ‡ H − TΔ‡ S)/RT). l Hence kr = k‡ exp(Δ‡ S/R) exp(− Δ‡ H/RT) l This expression has the same form as the Arrhenius expression. – The activation energy Ea relates to Δ‡ H pptpres 7 12 – Pre-exponential factor A = k‡ exp(Δ‡ S/R)
Statistical thermodynamic approach l The activated complex can form products if it passes though the transition state AB‡ l The equilibrium constant K‡ can be derived from statistical mechanics – q is the partition function for each species – ΔE 0 (k. J mol-1)is the difference in internal between A, B l Suppose that aenergy very loose vibration-like motion of the activated ‡ and AB T=0 frequency v along the reaction coordinate tips it complex AB‡atwith through the transition state. – The reaction rate is depends on the frequency of that motion. Ratebe = shown v [AB‡] that the rate l It can constant kr is given by the Eyring equation – the contribution from the critical vibrational motion has been resolved out from quantities K‡ and q. AB‡ pptpres 7 13 – v cancels out from the
Statistical thermodynamic approach continued l Can determine partition functions q. A and q. B from spectroscopic measurements but transition state has only a transient existence (picoseconds) and so cannot be studied by normal techniques (into the area of femtochemistry) l Need to postulate a structure for the activated complex and determine a theoretical value for q‡. – Complete calculations are only possible for simple cases, e. g. , H + H 2 + H – In more complex cases may use mixture of calculated and experimental parameters l Potential energy surface: 3 -D plot of the energy of all possible arrangements of the atoms in an activated complex. Defines the easiest route (the col between regions of high energy ) and hence the exact position of the transition state. l For the simplest case of the reaction of two structureless particles (e. g. , atoms) with no vibrational energy reacting to form a simple diatomic cluster the expression for kr derived from pptpres 7 14
Example of a potential energy surface l Hydrogen atom exchange reaction HA + HB─HC HA─HB + HC Mol HA─H B l Atoms constrained to be in a straight line (collinear) HA ·· HB ·· HC l Path C goes up along the valley and over the col (pass or saddle point) between 2 regions (mountains) of higher energy and descends down along the other valley. Mol HB─H C l Paths A and B go over much more difficult routes through regions of high energy l Can investigate this type of pptpres 7 15 reaction by collision of Diagram: www. oup. co. uk/powerpoint/bt /atkins
Advantages of transition state theory l Provides a complete description of the nature of the reaction including – the changes in structure and the distribution of energy through the transition state – the origin of the pre-exponential factor A with units t-1 that derive from frequency or velocity – the meaning of the activation energy Ea l Rather complex fundamental theory can be expressed in an easily understood pictorial diagram of the transition state - plot of energy vs the reaction coordinate l The pre-exponential factor A can be derived a priori from statistical mechanics in simple cases l The steric factor P can be understood as related to the change in order of the system and hence the entropy change at the transition state l Can be applied to reactions in gases or liquids l Allows for the influence of other properties of the system on the transition state (e. g. , solvent effects). Disadvantage l Not easy to estimate fundamental properties of the transition pptpres 7 16