University of Medicine and Pharmacy Iasi School of
- Slides: 71
University of Medicine and Pharmacy, Iasi School of Medicine ANESTHESIA and INTENSIVE CARE Conf. Dr. Ioana Grigoras MEDICINE 4 th year English Program Suport de curs WATER AND ELECTROLYTES DISTURBANCES
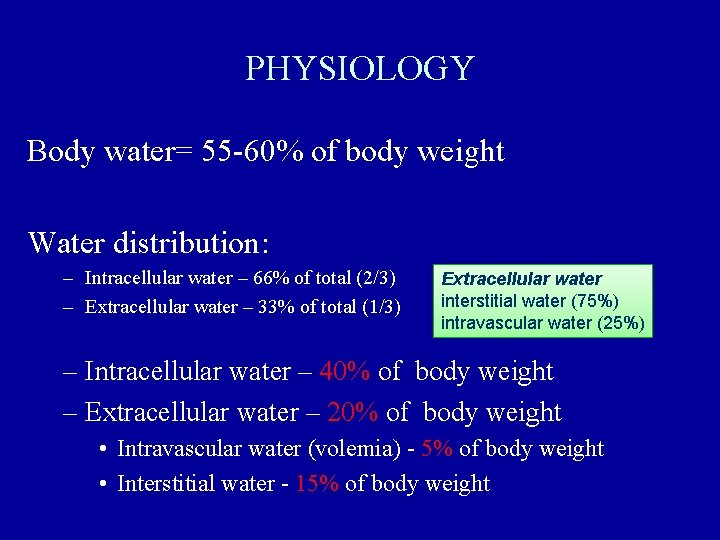
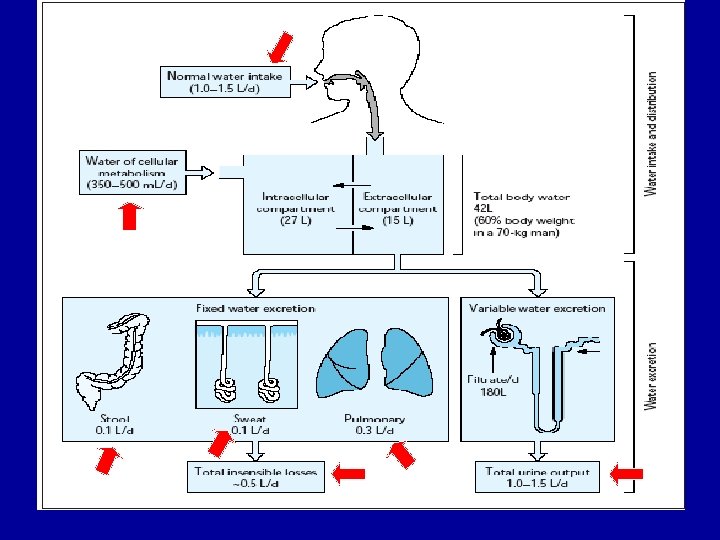
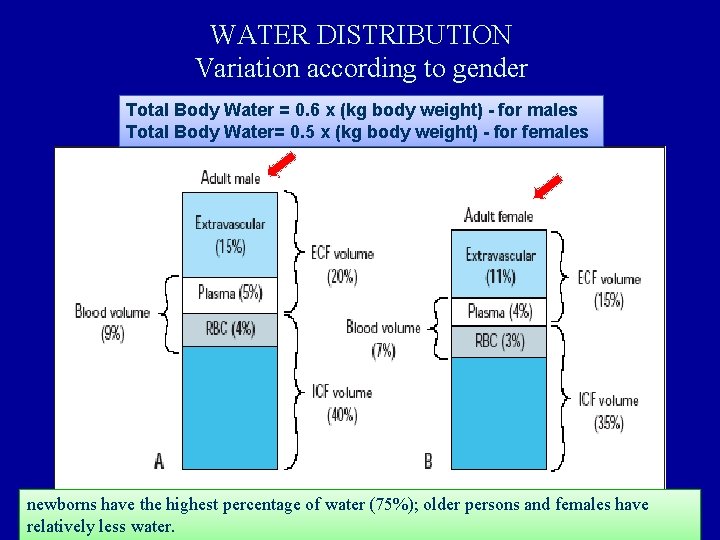
PHYSIOLOGY Body water= 55 -60% of body weight Water distribution: – Intracellular water – 66% of total (2/3) – Extracellular water – 33% of total (1/3) Extracellular water interstitial water (75%) intravascular water (25%) – Intracellular water – 40% of body weight – Extracellular water – 20% of body weight • Intravascular water (volemia) - 5% of body weight • Interstitial water - 15% of body weight
WATER DISTRIBUTION Variation according to gender Total Body Water = 0. 6 x (kg body weight) - for males Total Body Water= 0. 5 x (kg body weight) - for females newborns have the highest percentage of water (75%); older persons and females have relatively less water.
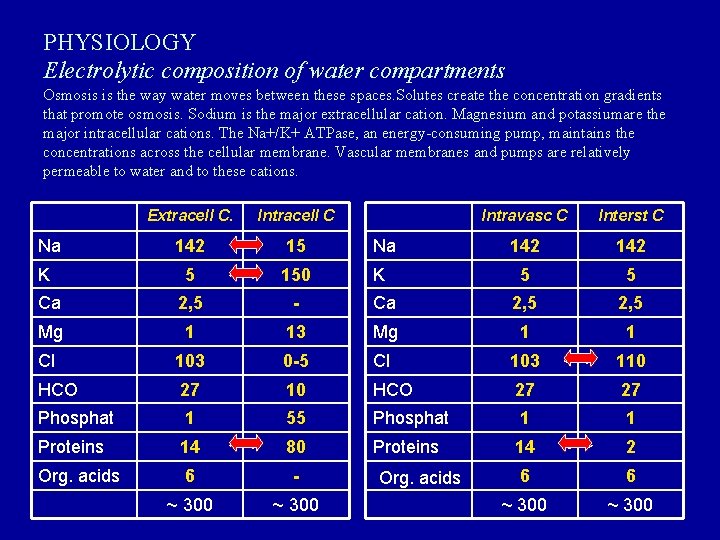
PHYSIOLOGY Electrolytic composition of water compartments Osmosis is the way water moves between these spaces. Solutes create the concentration gradients that promote osmosis. Sodium is the major extracellular cation. Magnesium and potassiumare the major intracellular cations. The Na+/K+ ATPase, an energy-consuming pump, maintains the concentrations across the cellular membrane. Vascular membranes and pumps are relatively permeable to water and to these cations. Extracell C. Intracell C 142 15 Na 5 150 K Ca 2, 5 - Mg 1 Cl Intravasc C Interst C 142 5 5 Ca 2, 5 13 Mg 1 1 103 0 -5 Cl 103 110 HCO 27 27 Phosphat 1 55 Phosphat 1 1 Proteins 14 80 Proteins 14 2 Org. acids 6 - 6 6 ~ 300 Na K Org. acids
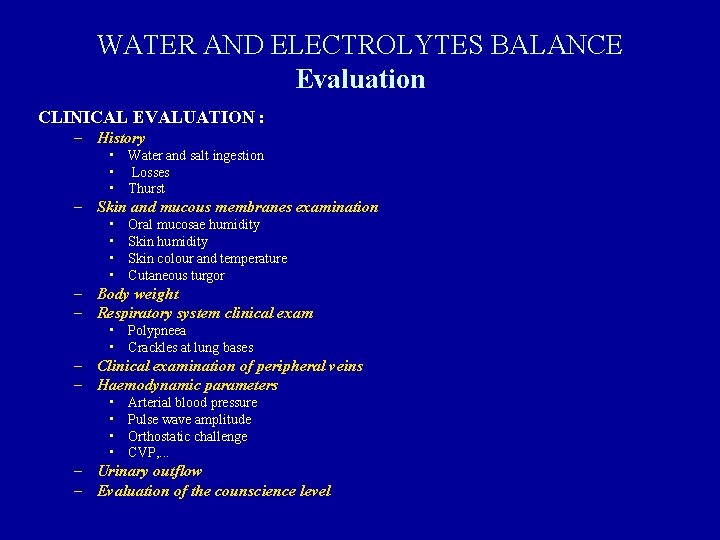
WATER AND ELECTROLYTES BALANCE Evaluation CLINICAL EVALUATION : – History • Water and salt ingestion • Losses • Thurst – Skin and mucous membranes examination • • Oral mucosae humidity Skin colour and temperature Cutaneous turgor – Body weight – Respiratory system clinical exam • Polypneea • Crackles at lung bases – Clinical examination of peripheral veins – Haemodynamic parameters • • Arterial blood pressure Pulse wave amplitude Orthostatic challenge CVP, . . . – Urinary outflow – Evaluation of the counscience level
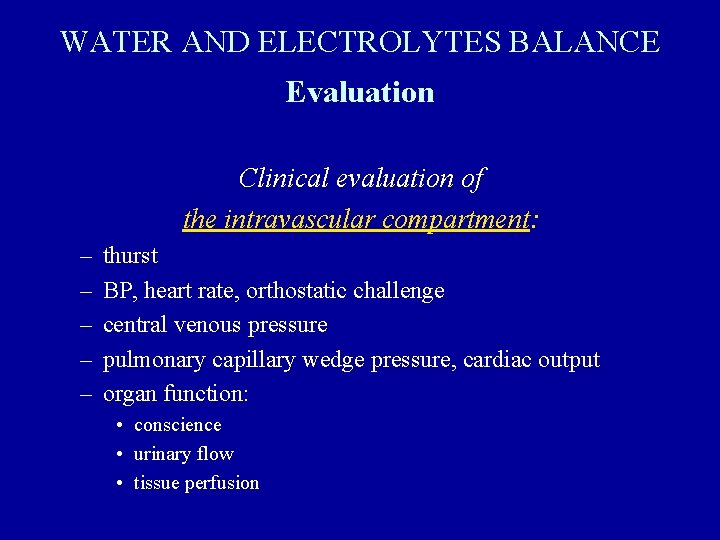
WATER AND ELECTROLYTES BALANCE Evaluation Clinical evaluation of the intravascular compartment: – – – thurst BP, heart rate, orthostatic challenge central venous pressure pulmonary capillary wedge pressure, cardiac output organ function: • conscience • urinary flow • tissue perfusion
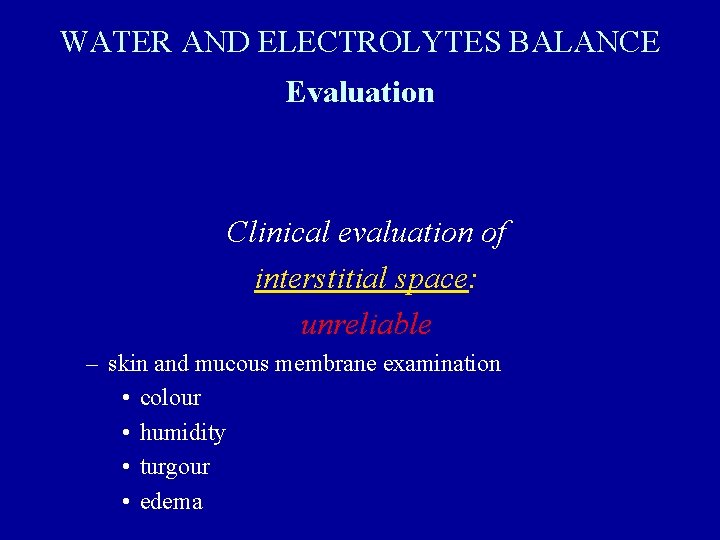
WATER AND ELECTROLYTES BALANCE Evaluation Clinical evaluation of interstitial space: unreliable – skin and mucous membrane examination • colour • humidity • turgour • edema
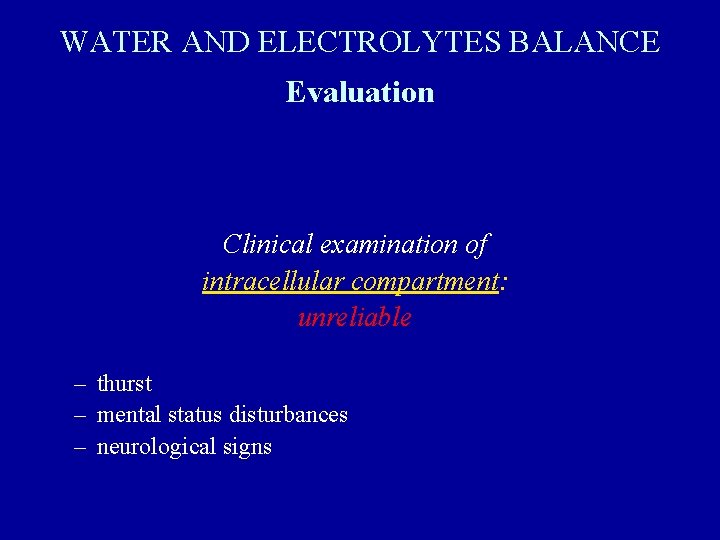
WATER AND ELECTROLYTES BALANCE Evaluation Clinical examination of intracellular compartment: unreliable – thurst – mental status disturbances – neurological signs
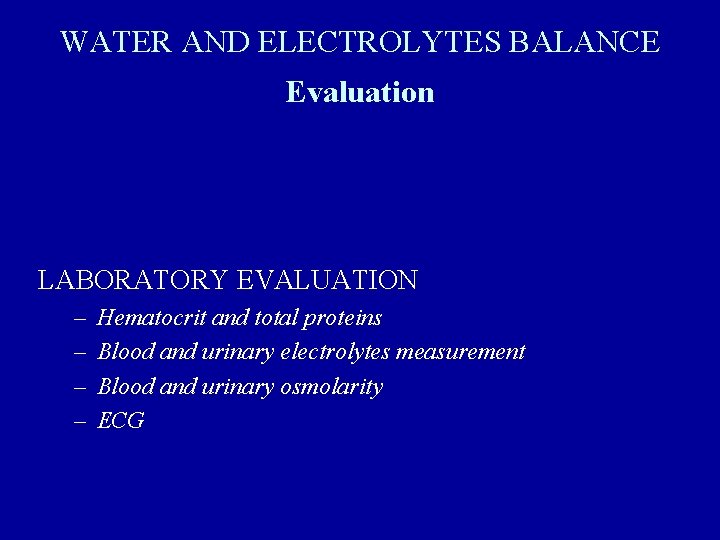
WATER AND ELECTROLYTES BALANCE Evaluation LABORATORY EVALUATION – – Hematocrit and total proteins Blood and urinary electrolytes measurement Blood and urinary osmolarity ECG
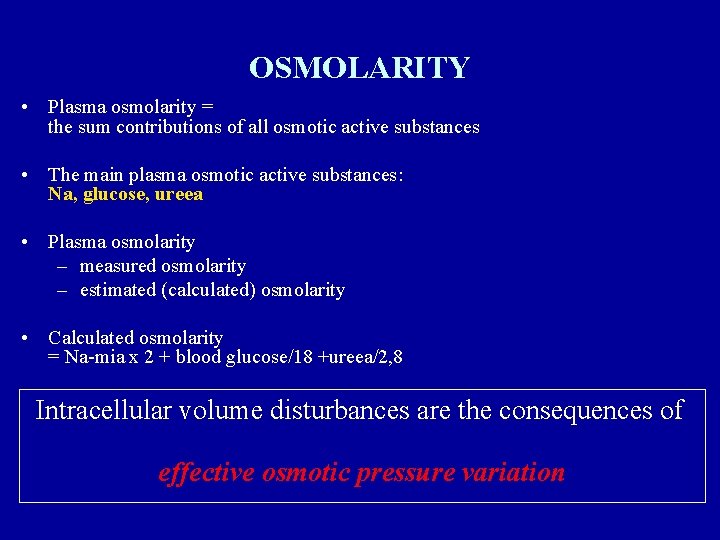
OSMOLARITY • Plasma osmolarity = the sum contributions of all osmotic active substances • The main plasma osmotic active substances: Na, glucose, ureea • Plasma osmolarity – measured osmolarity – estimated (calculated) osmolarity • Calculated osmolarity = Na-mia x 2 + blood glucose/18 +ureea/2, 8 Intracellular volume disturbances are the consequences of effective osmotic pressure variation
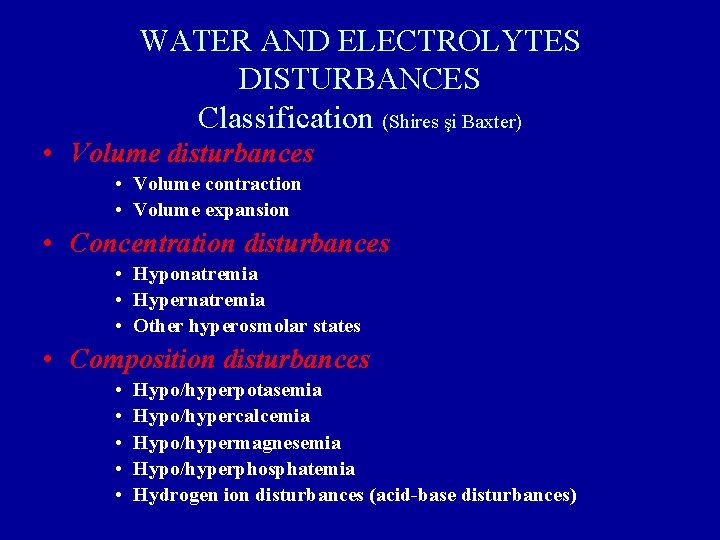
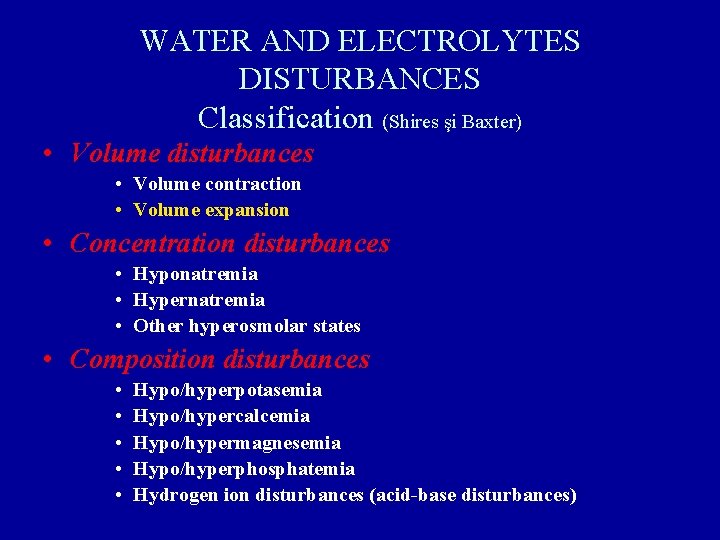
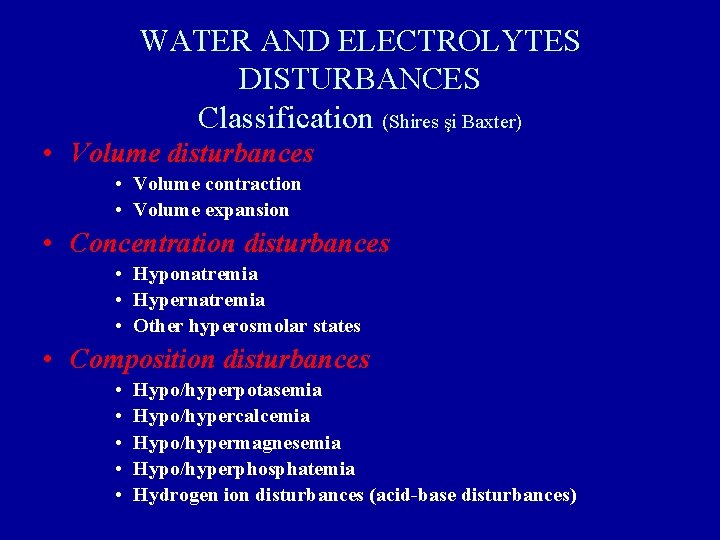
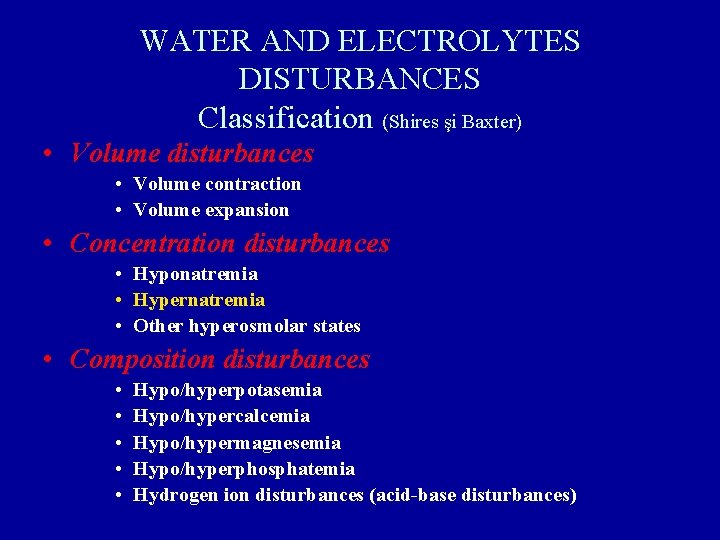
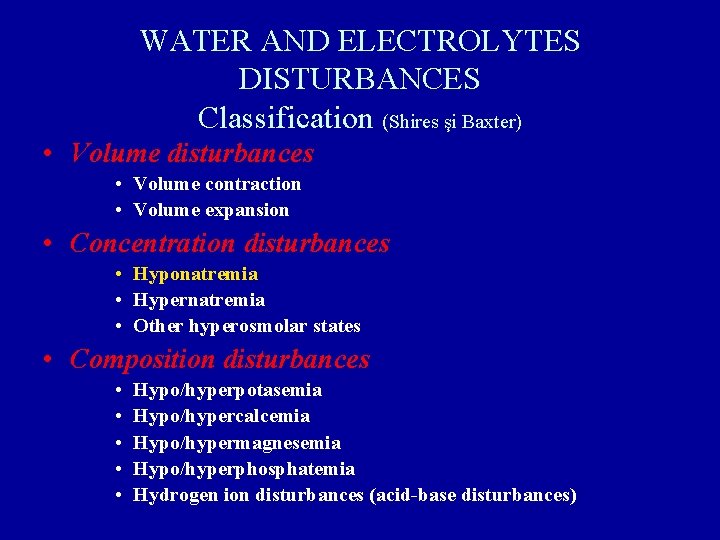
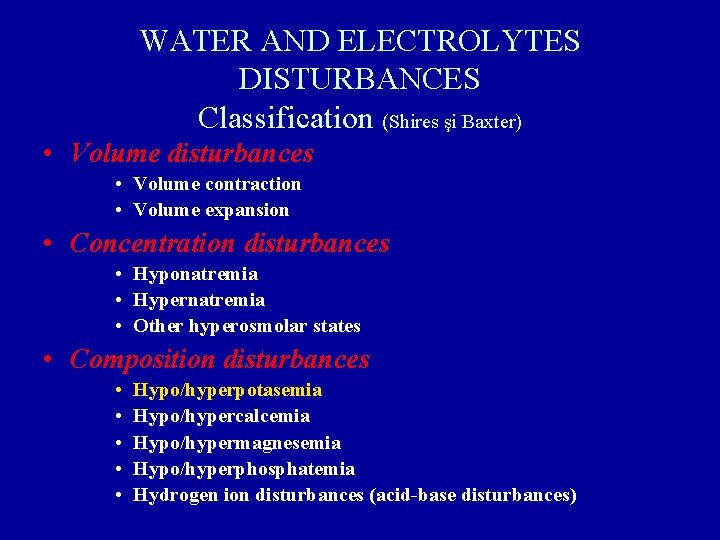
WATER AND ELECTROLYTES DISTURBANCES Classification (Shires şi Baxter) • Volume disturbances • Volume contraction • Volume expansion • Concentration disturbances • Hyponatremia • Hypernatremia • Other hyperosmolar states • Composition disturbances • • • Hypo/hyperpotasemia Hypo/hypercalcemia Hypo/hypermagnesemia Hypo/hyperphosphatemia Hydrogen ion disturbances (acid-base disturbances)
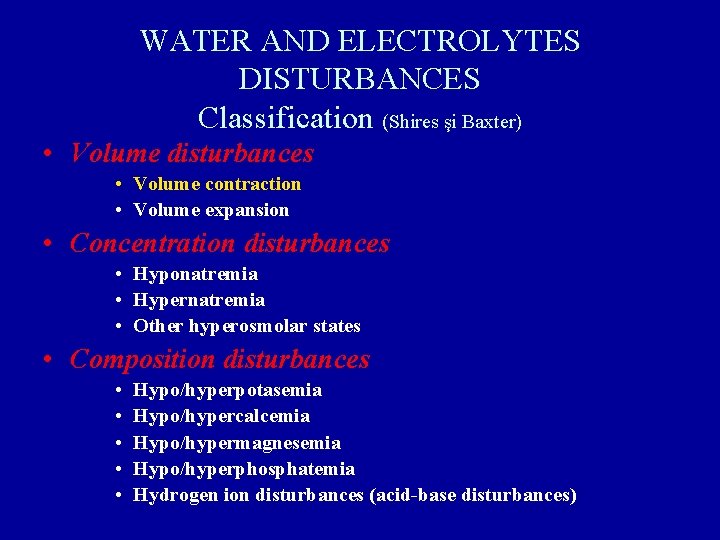
WATER AND ELECTROLYTES DISTURBANCES Classification (Shires şi Baxter) • Volume disturbances • Volume contraction • Volume expansion • Concentration disturbances • Hyponatremia • Hypernatremia • Other hyperosmolar states • Composition disturbances • • • Hypo/hyperpotasemia Hypo/hypercalcemia Hypo/hypermagnesemia Hypo/hyperphosphatemia Hydrogen ion disturbances (acid-base disturbances)
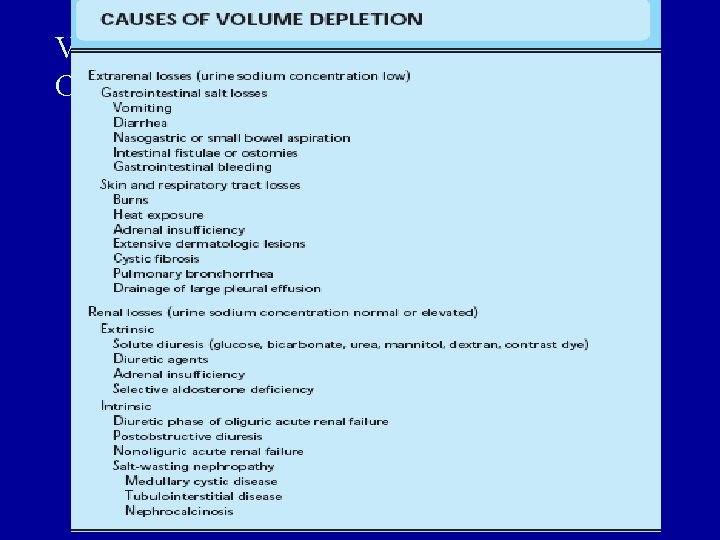
VOLUME CONTRACTION
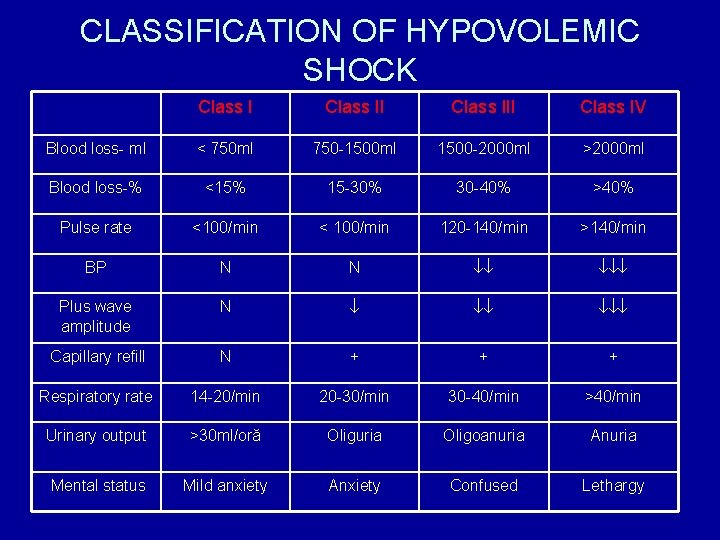
CLASSIFICATION OF HYPOVOLEMIC SHOCK Class III Class IV Blood loss- ml < 750 ml 750 -1500 ml 1500 -2000 ml >2000 ml Blood loss-% <15% 15 -30% 30 -40% >40% Pulse rate <100/min < 100/min 120 -140/min >140/min BP N N Plus wave amplitude N Capillary refill N + + + Respiratory rate 14 -20/min 20 -30/min 30 -40/min >40/min Urinary output >30 ml/oră Oliguria Oligoanuria Anuria Mental status Mild anxiety Anxiety Confused Lethargy
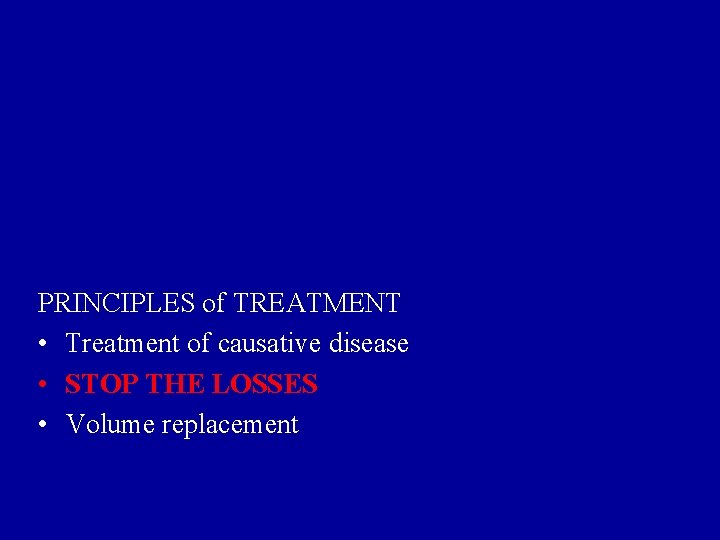
PRINCIPLES of TREATMENT • Treatment of causative disease • STOP THE LOSSES • Volume replacement
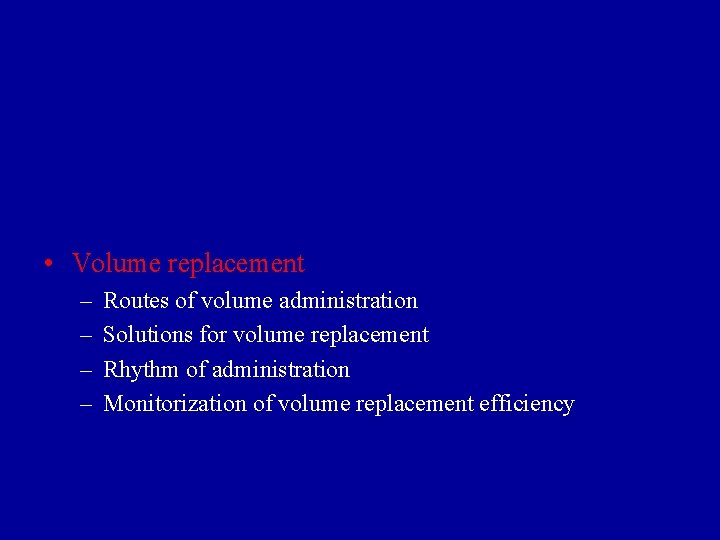
• Volume replacement – – Routes of volume administration Solutions for volume replacement Rhythm of administration Monitorization of volume replacement efficiency
WATER AND ELECTROLYTES DISTURBANCES Classification (Shires şi Baxter) • Volume disturbances • Volume contraction • Volume expansion • Concentration disturbances • Hyponatremia • Hypernatremia • Other hyperosmolar states • Composition disturbances • • • Hypo/hyperpotasemia Hypo/hypercalcemia Hypo/hypermagnesemia Hypo/hyperphosphatemia Hydrogen ion disturbances (acid-base disturbances)
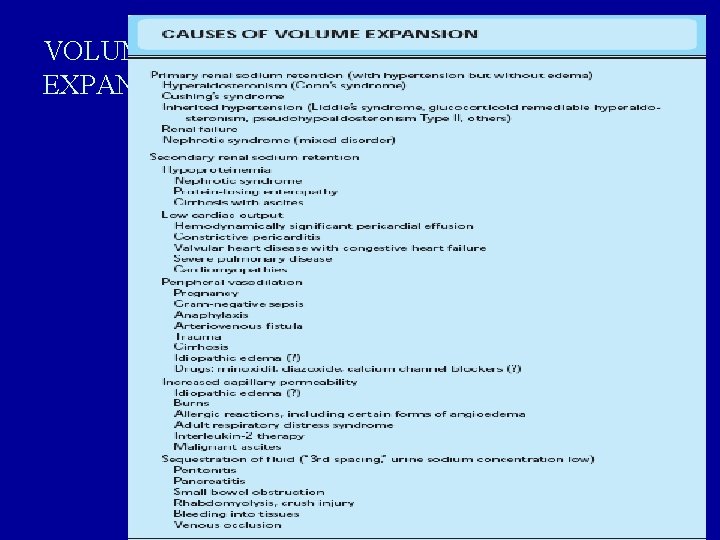
VOLUME EXPANTION
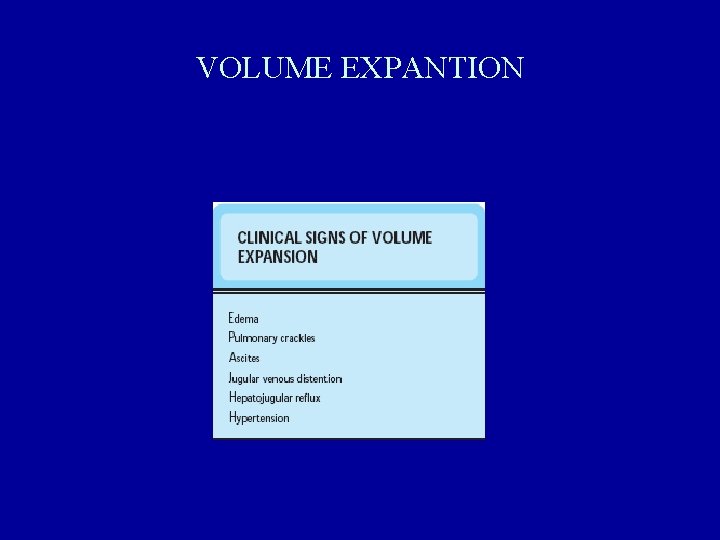
VOLUME EXPANTION
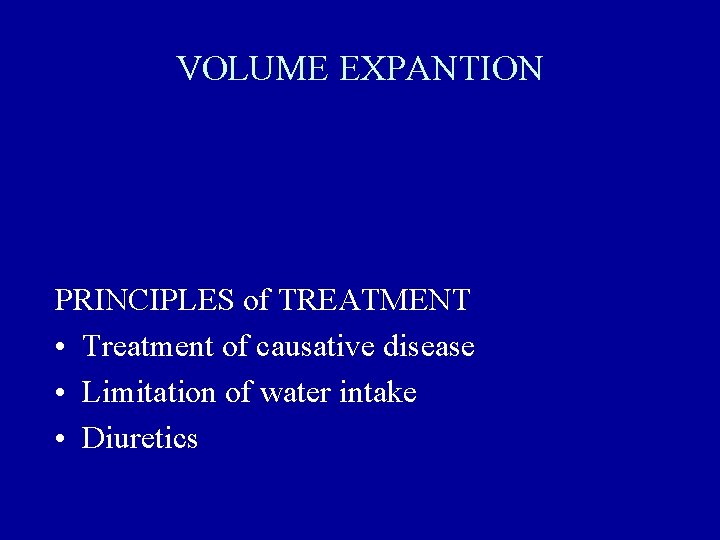
VOLUME EXPANTION PRINCIPLES of TREATMENT • Treatment of causative disease • Limitation of water intake • Diuretics
WATER AND ELECTROLYTES DISTURBANCES Classification (Shires şi Baxter) • Volume disturbances • Volume contraction • Volume expansion • Concentration disturbances • Hyponatremia • Hypernatremia • Other hyperosmolar states • Composition disturbances • • • Hypo/hyperpotasemia Hypo/hypercalcemia Hypo/hypermagnesemia Hypo/hyperphosphatemia Hydrogen ion disturbances (acid-base disturbances)
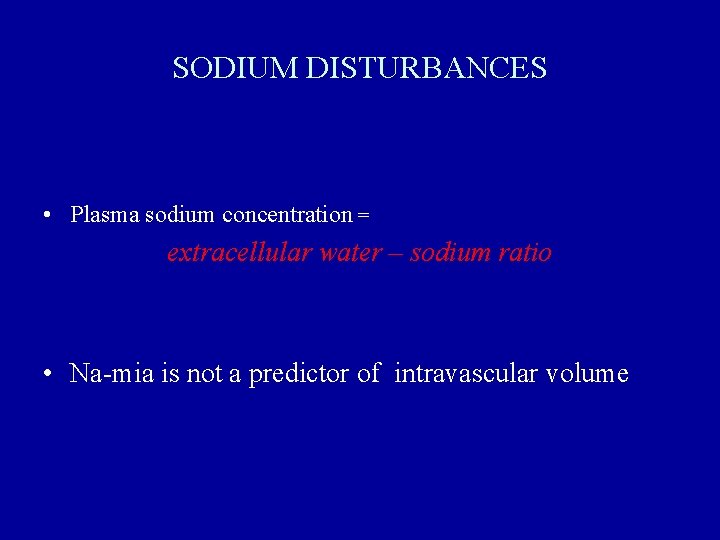
SODIUM DISTURBANCES • Plasma sodium concentration = extracellular water – sodium ratio • Na-mia is not a predictor of intravascular volume
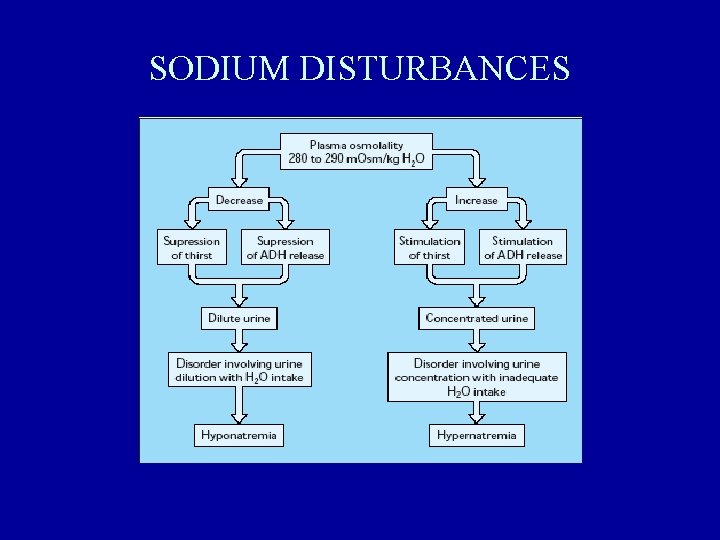
SODIUM DISTURBANCES
WATER AND ELECTROLYTES DISTURBANCES Classification (Shires şi Baxter) • Volume disturbances • Volume contraction • Volume expansion • Concentration disturbances • Hyponatremia • Hypernatremia • Other hyperosmolar states • Composition disturbances • • • Hypo/hyperpotasemia Hypo/hypercalcemia Hypo/hypermagnesemia Hypo/hyperphosphatemia Hydrogen ion disturbances (acid-base disturbances)
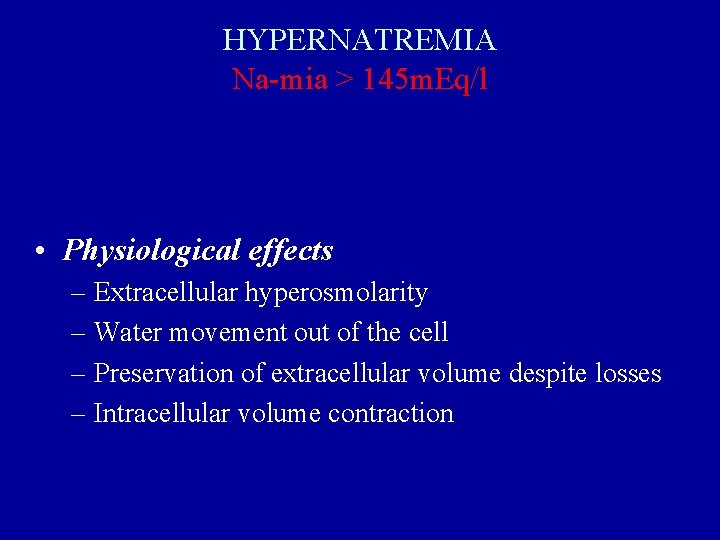
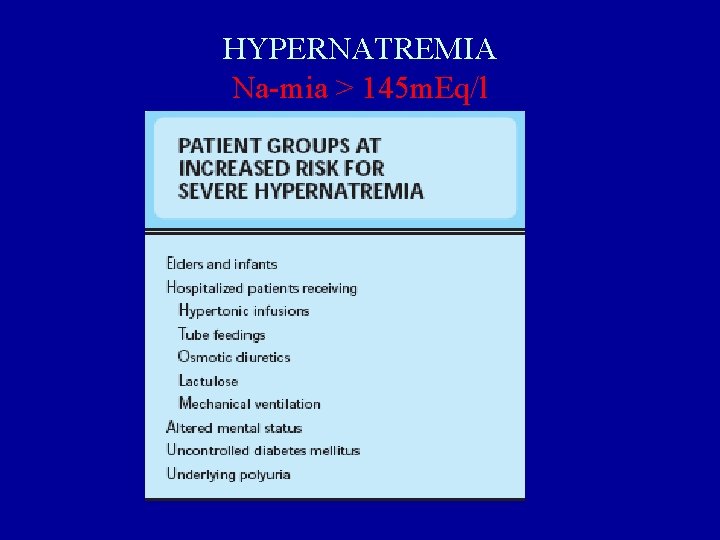
HYPERNATREMIA Na-mia > 145 m. Eq/l • Physiological effects – Extracellular hyperosmolarity – Water movement out of the cell – Preservation of extracellular volume despite losses – Intracellular volume contraction
HYPERNATREMIA Na-mia > 145 m. Eq/l
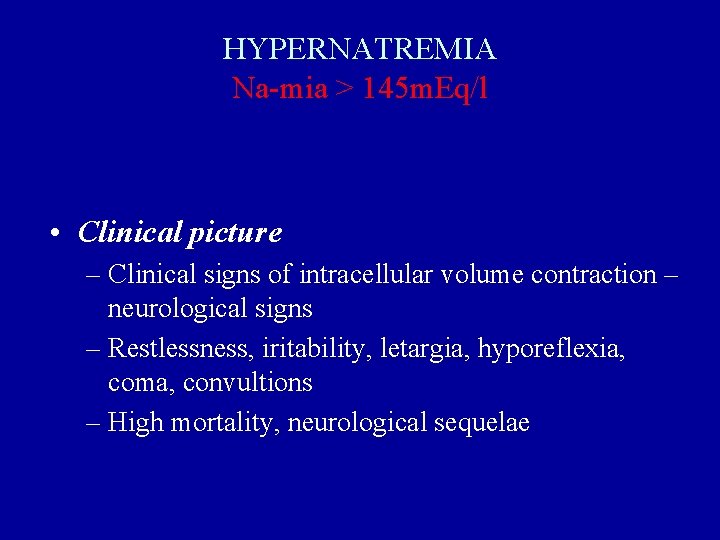
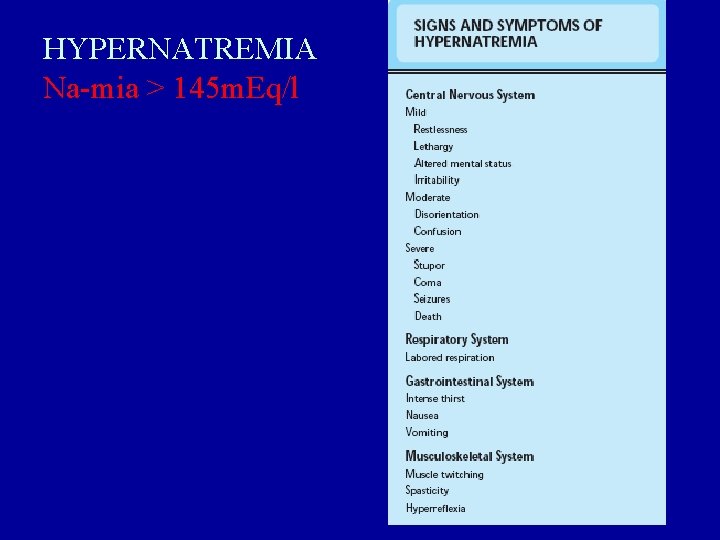
HYPERNATREMIA Na-mia > 145 m. Eq/l • Clinical picture – Clinical signs of intracellular volume contraction – neurological signs – Restlessness, iritability, letargia, hyporeflexia, coma, convultions – High mortality, neurological sequelae
HYPERNATREMIA Na-mia > 145 m. Eq/l
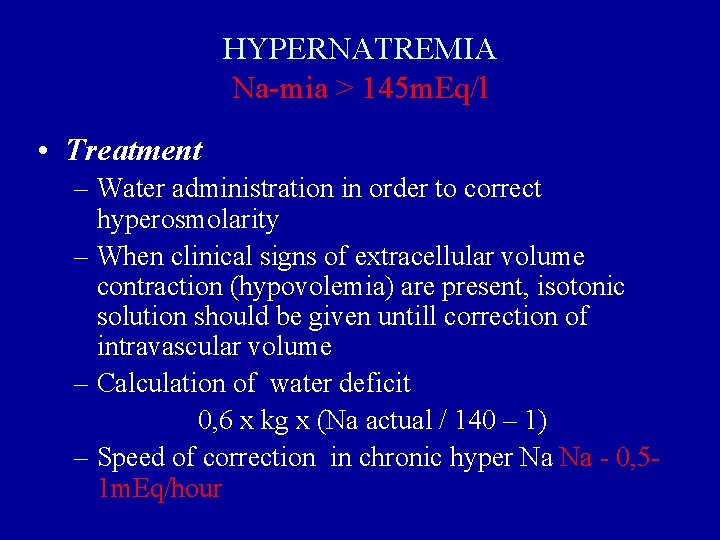
HYPERNATREMIA Na-mia > 145 m. Eq/l • Treatment – Water administration in order to correct hyperosmolarity – When clinical signs of extracellular volume contraction (hypovolemia) are present, isotonic solution should be given untill correction of intravascular volume – Calculation of water deficit 0, 6 x kg x (Na actual / 140 – 1) – Speed of correction in chronic hyper Na Na - 0, 51 m. Eq/hour
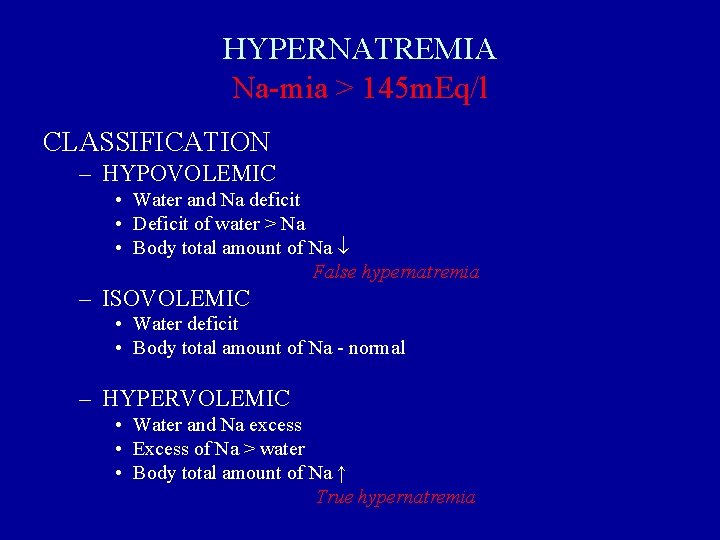
HYPERNATREMIA Na-mia > 145 m. Eq/l CLASSIFICATION – HYPOVOLEMIC • Water and Na deficit • Deficit of water > Na • Body total amount of Na False hypernatremia – ISOVOLEMIC • Water deficit • Body total amount of Na - normal – HYPERVOLEMIC • Water and Na excess • Excess of Na > water • Body total amount of Na ↑ True hypernatremia
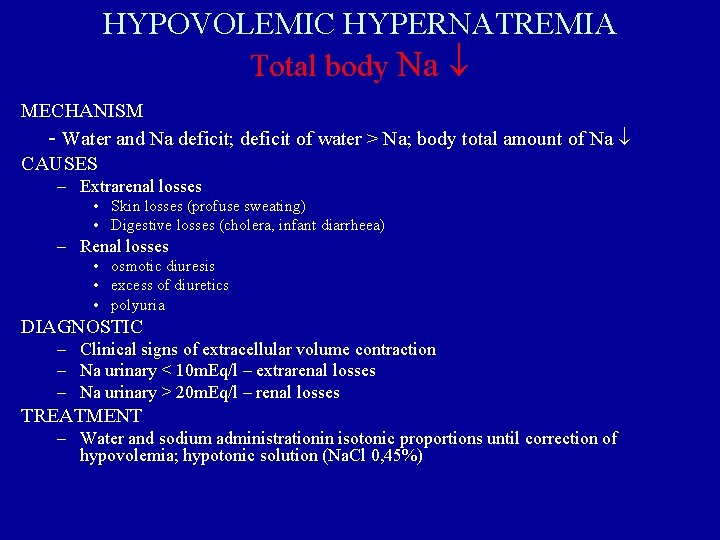
HYPOVOLEMIC HYPERNATREMIA Total body Na MECHANISM - Water and Na deficit; deficit of water > Na; body total amount of Na CAUSES – Extrarenal losses • Skin losses (profuse sweating) • Digestive losses (cholera, infant diarrheea) – Renal losses • osmotic diuresis • excess of diuretics • polyuria DIAGNOSTIC – Clinical signs of extracellular volume contraction – Na urinary < 10 m. Eq/l – extrarenal losses – Na urinary > 20 m. Eq/l – renal losses TREATMENT – Water and sodium administrationin isotonic proportions until correction of hypovolemia; hypotonic solution (Na. Cl 0, 45%)
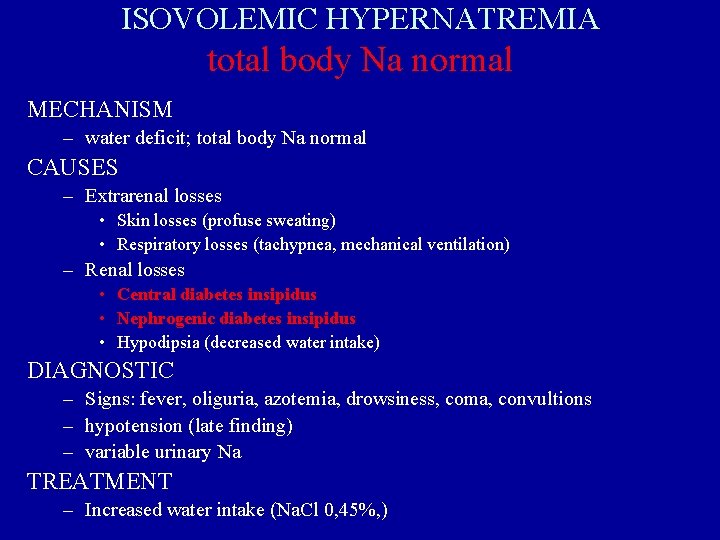
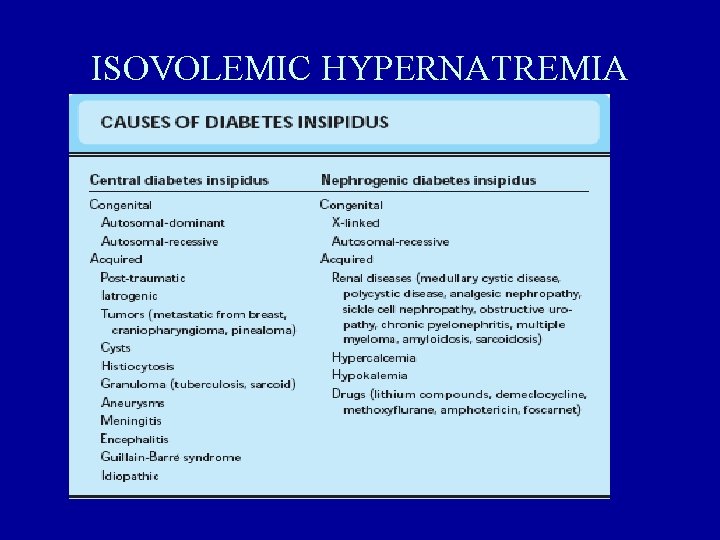
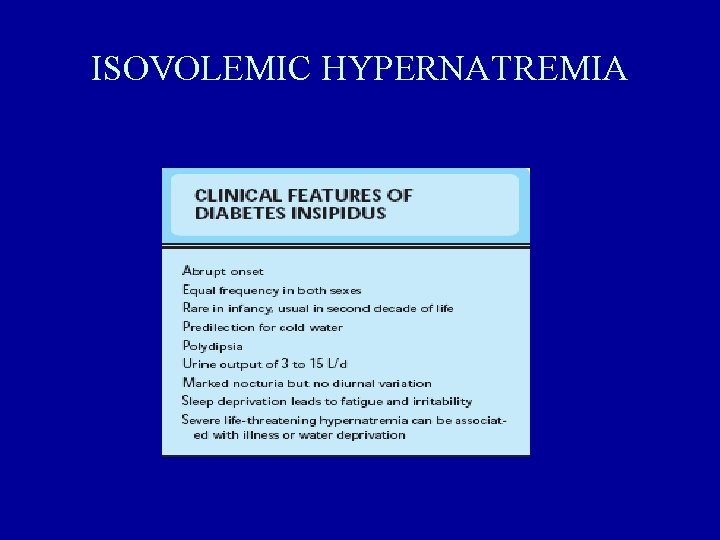
ISOVOLEMIC HYPERNATREMIA total body Na normal MECHANISM – water deficit; total body Na normal CAUSES – Extrarenal losses • Skin losses (profuse sweating) • Respiratory losses (tachypnea, mechanical ventilation) – Renal losses • Central diabetes insipidus • Nephrogenic diabetes insipidus • Hypodipsia (decreased water intake) DIAGNOSTIC – Signs: fever, oliguria, azotemia, drowsiness, coma, convultions – hypotension (late finding) – variable urinary Na TREATMENT – Increased water intake (Na. Cl 0, 45%, )
ISOVOLEMIC HYPERNATREMIA
ISOVOLEMIC HYPERNATREMIA
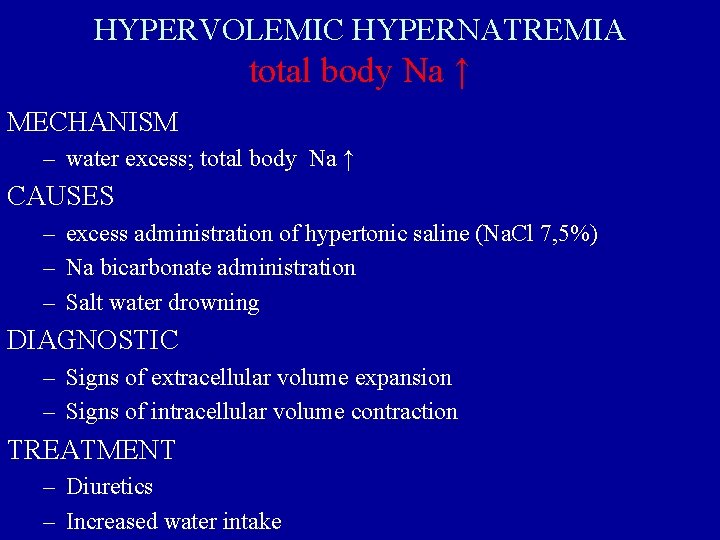
HYPERVOLEMIC HYPERNATREMIA total body Na ↑ MECHANISM – water excess; total body Na ↑ CAUSES – excess administration of hypertonic saline (Na. Cl 7, 5%) – Na bicarbonate administration – Salt water drowning DIAGNOSTIC – Signs of extracellular volume expansion – Signs of intracellular volume contraction TREATMENT – Diuretics – Increased water intake
WATER AND ELECTROLYTES DISTURBANCES Classification (Shires şi Baxter) • Volume disturbances • Volume contraction • Volume expansion • Concentration disturbances • Hyponatremia • Hypernatremia • Other hyperosmolar states • Composition disturbances • • • Hypo/hyperpotasemia Hypo/hypercalcemia Hypo/hypermagnesemia Hypo/hyperphosphatemia Hydrogen ion disturbances (acid-base disturbances)
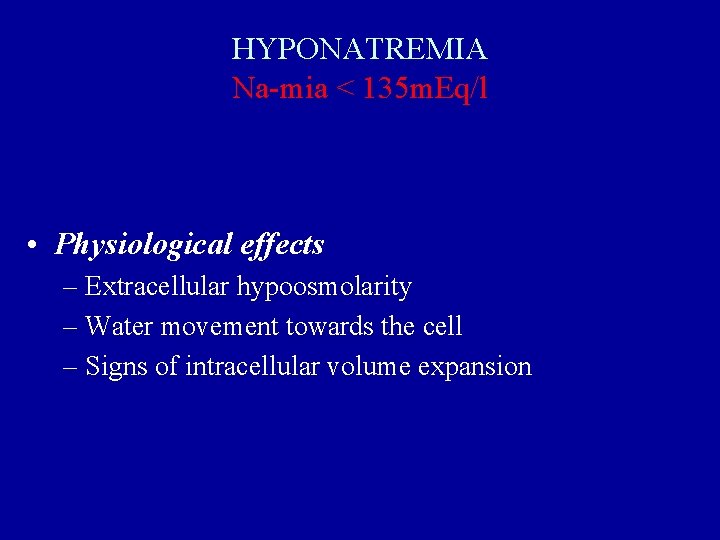
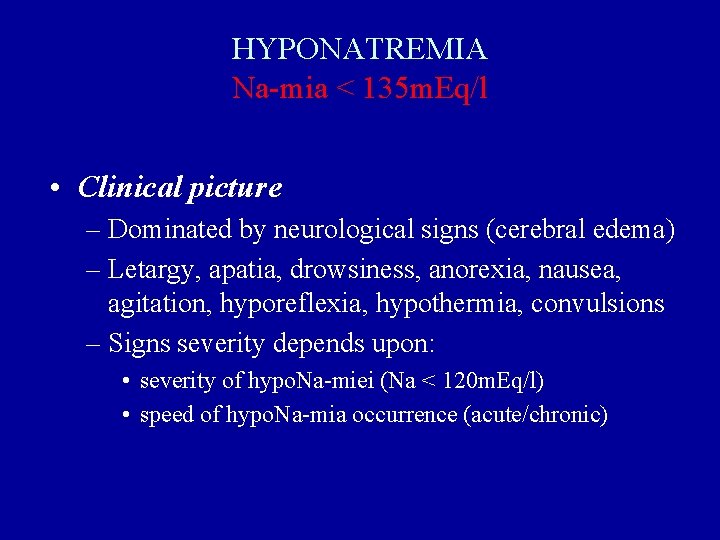
HYPONATREMIA Na-mia < 135 m. Eq/l • Physiological effects – Extracellular hypoosmolarity – Water movement towards the cell – Signs of intracellular volume expansion
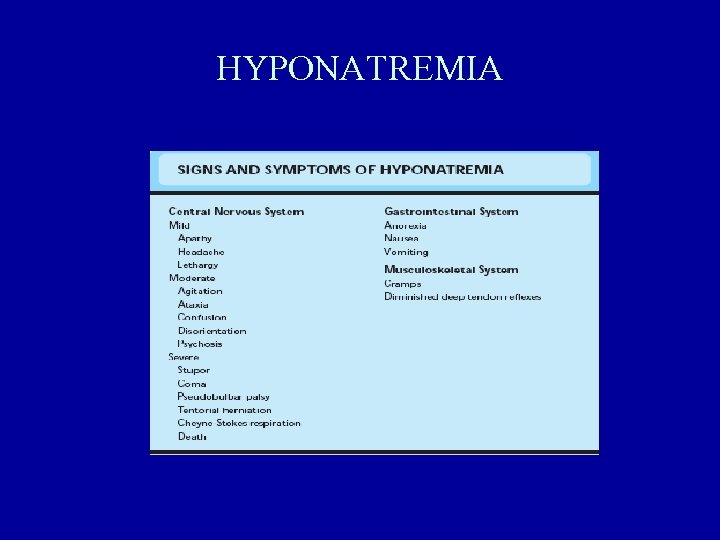
HYPONATREMIA Na-mia < 135 m. Eq/l • Clinical picture – Dominated by neurological signs (cerebral edema) – Letargy, apatia, drowsiness, anorexia, nausea, agitation, hyporeflexia, hypothermia, convulsions – Signs severity depends upon: • severity of hypo. Na-miei (Na < 120 m. Eq/l) • speed of hypo. Na-mia occurrence (acute/chronic)
HYPONATREMIA
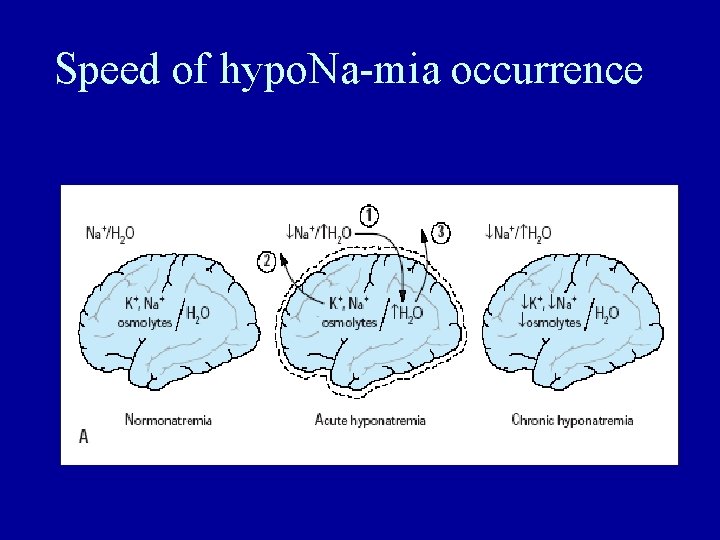
Speed of hypo. Na-mia occurrence
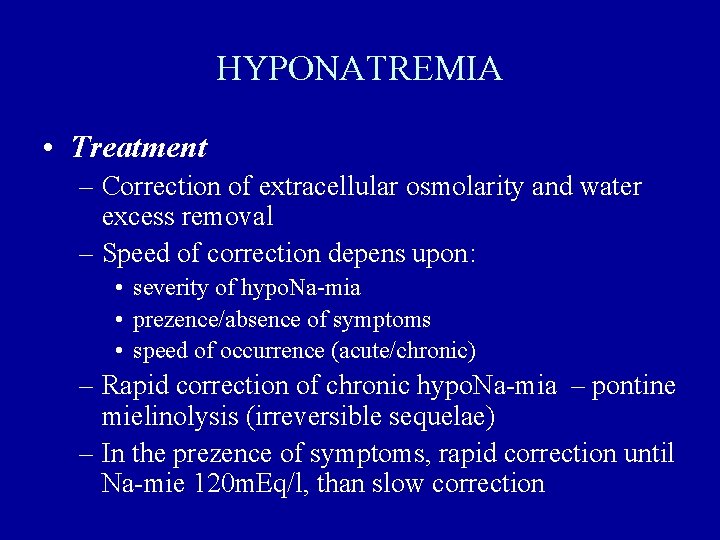
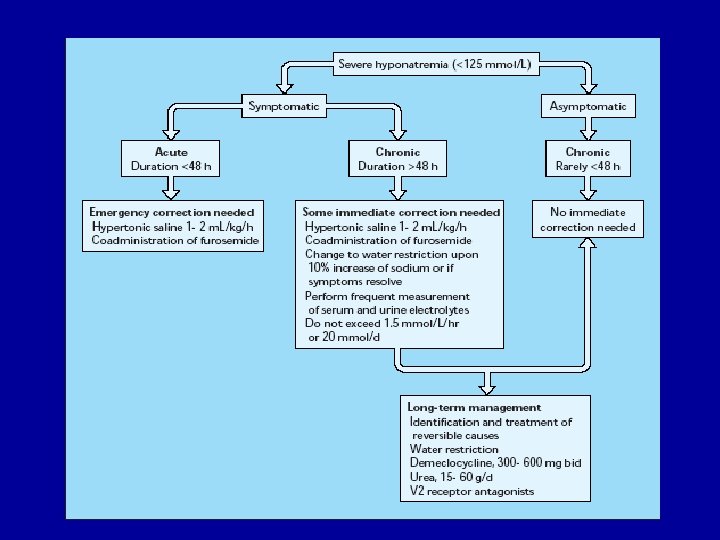
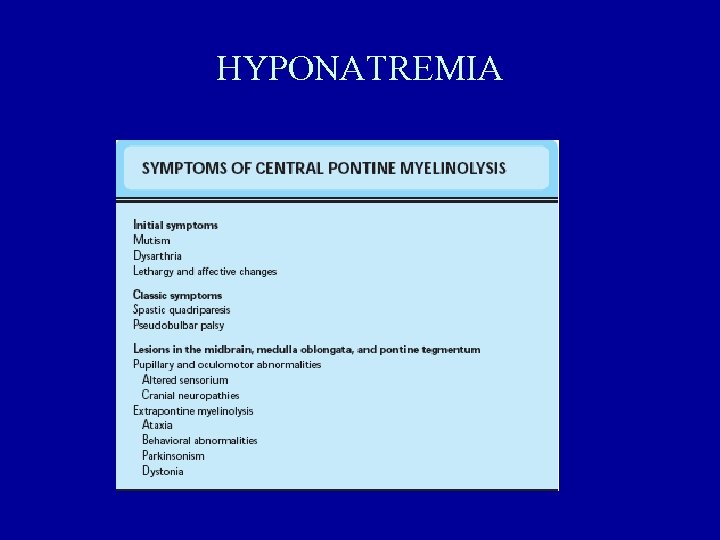
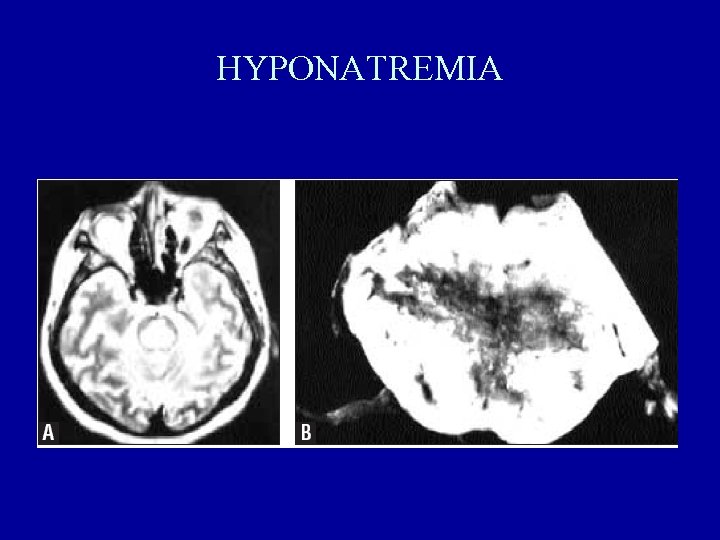
HYPONATREMIA • Treatment – Correction of extracellular osmolarity and water excess removal – Speed of correction depens upon: • severity of hypo. Na-mia • prezence/absence of symptoms • speed of occurrence (acute/chronic) – Rapid correction of chronic hypo. Na-mia – pontine mielinolysis (irreversible sequelae) – In the prezence of symptoms, rapid correction until Na-mie 120 m. Eq/l, than slow correction
HYPONATREMIA
HYPONATREMIA
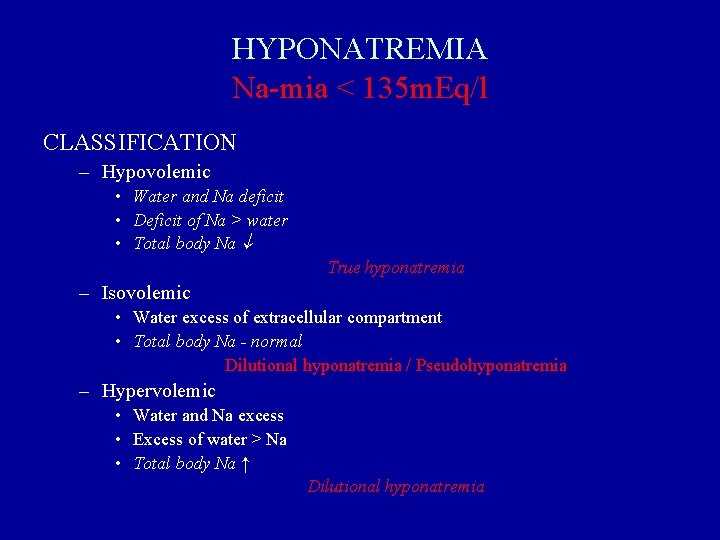
HYPONATREMIA Na-mia < 135 m. Eq/l CLASSIFICATION – Hypovolemic • Water and Na deficit • Deficit of Na > water • Total body Na True hyponatremia – Isovolemic • Water excess of extracellular compartment • Total body Na - normal Dilutional hyponatremia / Pseudohyponatremia – Hypervolemic • Water and Na excess • Excess of water > Na • Total body Na ↑ Dilutional hyponatremia
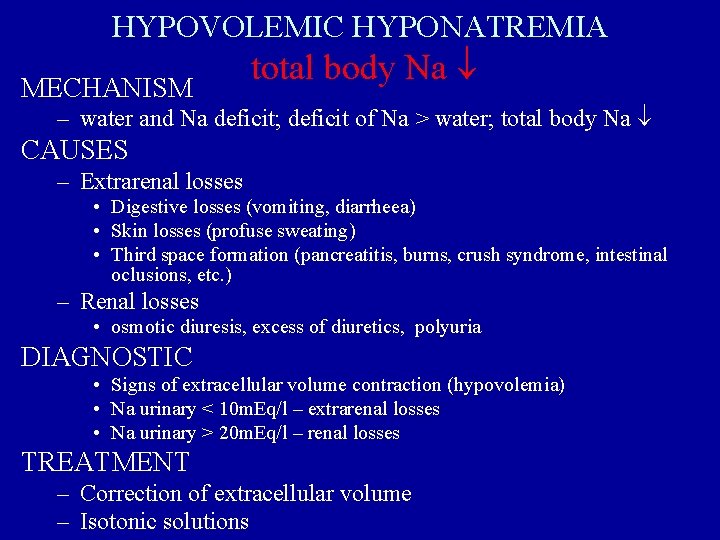
HYPOVOLEMIC HYPONATREMIA MECHANISM total body Na – water and Na deficit; deficit of Na > water; total body Na CAUSES – Extrarenal losses • Digestive losses (vomiting, diarrheea) • Skin losses (profuse sweating) • Third space formation (pancreatitis, burns, crush syndrome, intestinal oclusions, etc. ) – Renal losses • osmotic diuresis, excess of diuretics, polyuria DIAGNOSTIC • Signs of extracellular volume contraction (hypovolemia) • Na urinary < 10 m. Eq/l – extrarenal losses • Na urinary > 20 m. Eq/l – renal losses TREATMENT – Correction of extracellular volume – Isotonic solutions
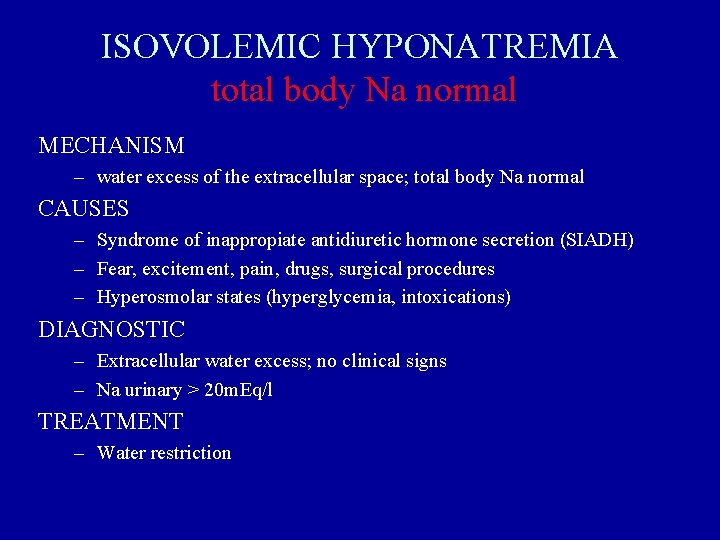
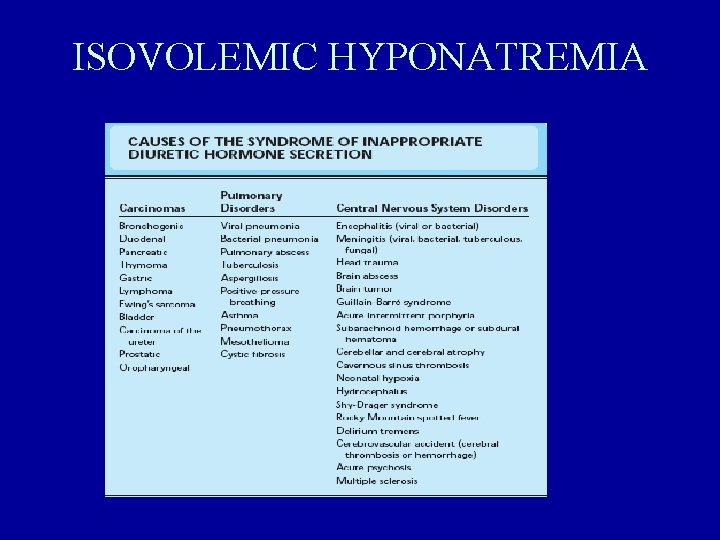
ISOVOLEMIC HYPONATREMIA total body Na normal MECHANISM – water excess of the extracellular space; total body Na normal CAUSES – Syndrome of inappropiate antidiuretic hormone secretion (SIADH) – Fear, excitement, pain, drugs, surgical procedures – Hyperosmolar states (hyperglycemia, intoxications) DIAGNOSTIC – Extracellular water excess; no clinical signs – Na urinary > 20 m. Eq/l TREATMENT – Water restriction
ISOVOLEMIC HYPONATREMIA
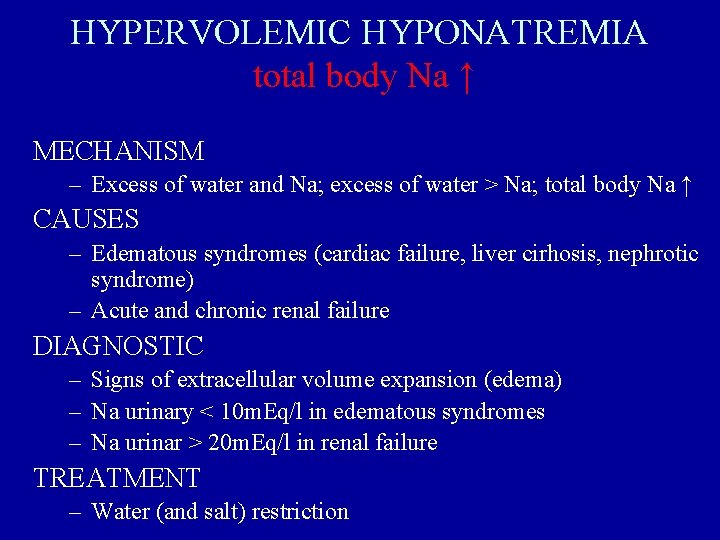
HYPERVOLEMIC HYPONATREMIA total body Na ↑ MECHANISM – Excess of water and Na; excess of water > Na; total body Na ↑ CAUSES – Edematous syndromes (cardiac failure, liver cirhosis, nephrotic syndrome) – Acute and chronic renal failure DIAGNOSTIC – Signs of extracellular volume expansion (edema) – Na urinary < 10 m. Eq/l in edematous syndromes – Na urinar > 20 m. Eq/l in renal failure TREATMENT – Water (and salt) restriction
WATER AND ELECTROLYTES DISTURBANCES Classification (Shires şi Baxter) • Volume disturbances • Volume contraction • Volume expansion • Concentration disturbances • Hyponatremia • Hypernatremia • Other hyperosmolar states • Composition disturbances • • • Hypo/hyperpotasemia Hypo/hypercalcemia Hypo/hypermagnesemia Hypo/hyperphosphatemia Hydrogen ion disturbances (acid-base disturbances)
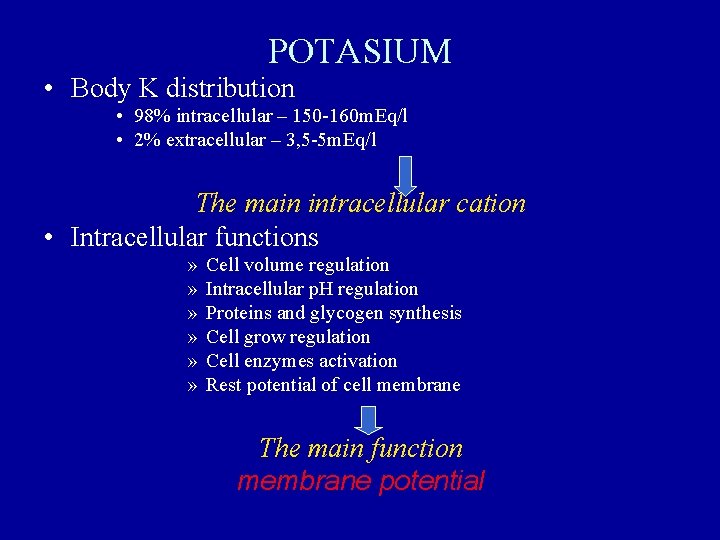
POTASIUM • Body K distribution • 98% intracellular – 150 -160 m. Eq/l • 2% extracellular – 3, 5 -5 m. Eq/l The main intracellular cation • Intracellular functions » » » Cell volume regulation Intracellular p. H regulation Proteins and glycogen synthesis Cell grow regulation Cell enzymes activation Rest potential of cell membrane The main function membrane potential
Hypokalemia (<3. 5 m. Eq/L) • Pathophysiology – – Decrease in K+ causes decreased excitability of cells, therefore cells are less responsive to normal stimuli
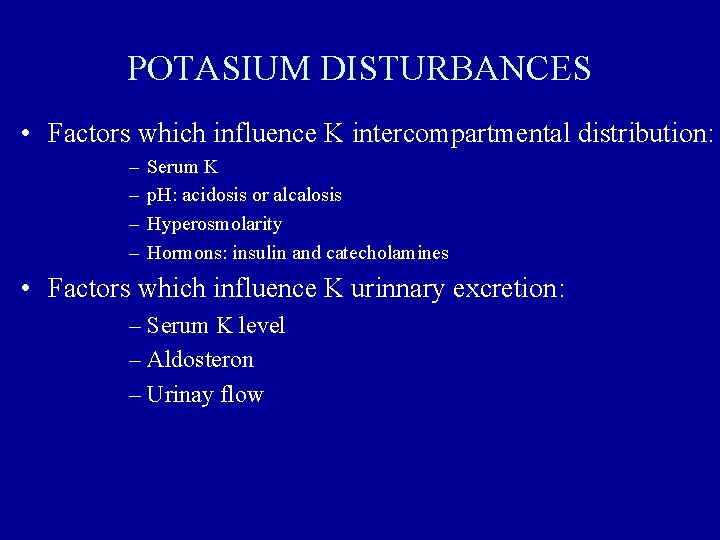
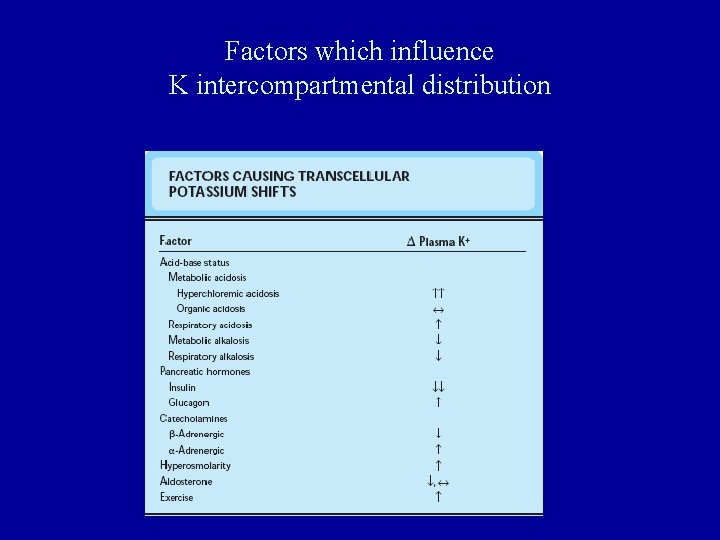
POTASIUM DISTURBANCES • Factors which influence K intercompartmental distribution: – – Serum K p. H: acidosis or alcalosis Hyperosmolarity Hormons: insulin and catecholamines • Factors which influence K urinnary excretion: – Serum K level – Aldosteron – Urinay flow
Factors which influence K intercompartmental distribution
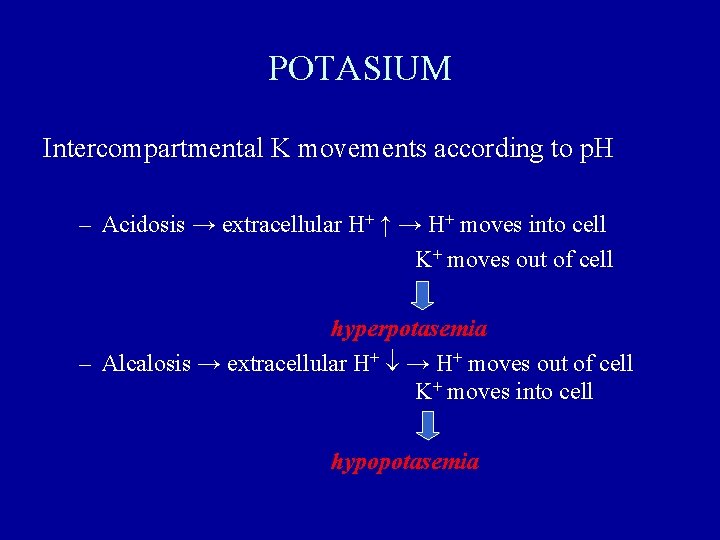
POTASIUM Intercompartmental K movements according to p. H – Acidosis → extracellular H+ ↑ → H+ moves into cell K+ moves out of cell hyperpotasemia – Alcalosis → extracellular H+ → H+ moves out of cell K+ moves into cell hypopotasemia
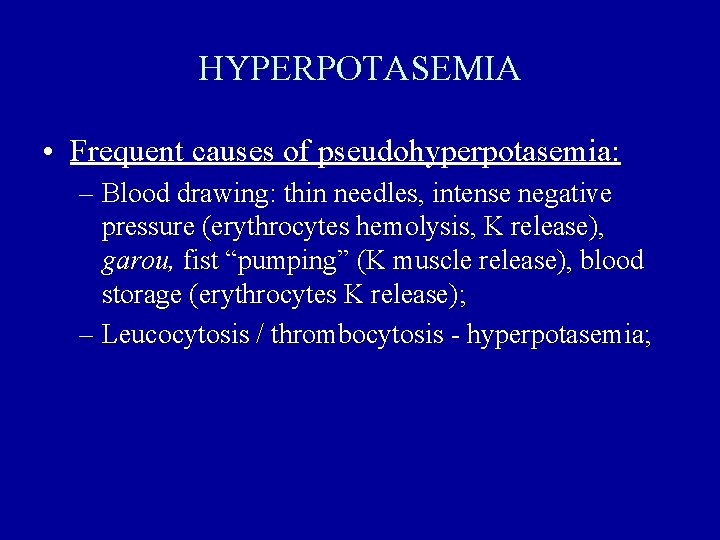
HYPERPOTASEMIA • Frequent causes of pseudohyperpotasemia: – Blood drawing: thin needles, intense negative pressure (erythrocytes hemolysis, K release), garou, fist “pumping” (K muscle release), blood storage (erythrocytes K release); – Leucocytosis / thrombocytosis - hyperpotasemia;
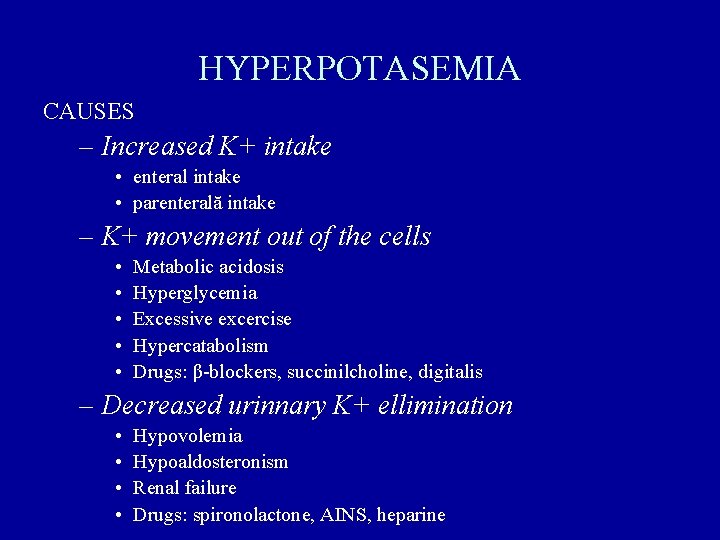
HYPERPOTASEMIA CAUSES – Increased K+ intake • enteral intake • parenterală intake – K+ movement out of the cells • • • Metabolic acidosis Hyperglycemia Excessive excercise Hypercatabolism Drugs: β-blockers, succinilcholine, digitalis – Decreased urinnary K+ ellimination • • Hypovolemia Hypoaldosteronism Renal failure Drugs: spironolactone, AINS, heparine
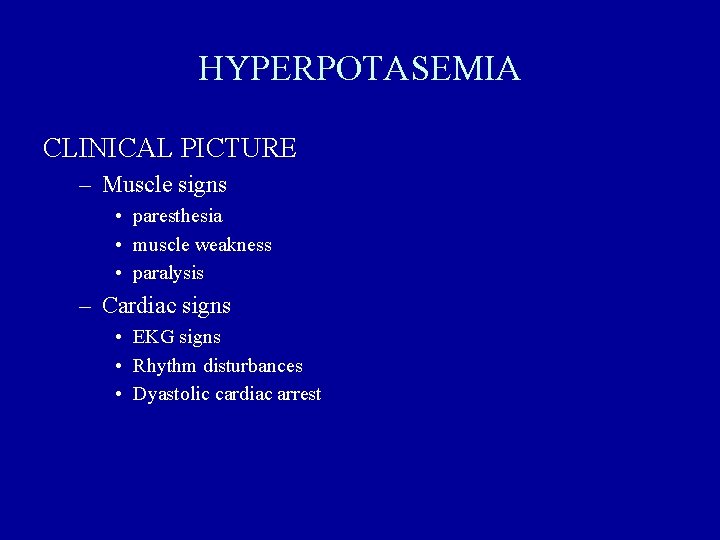
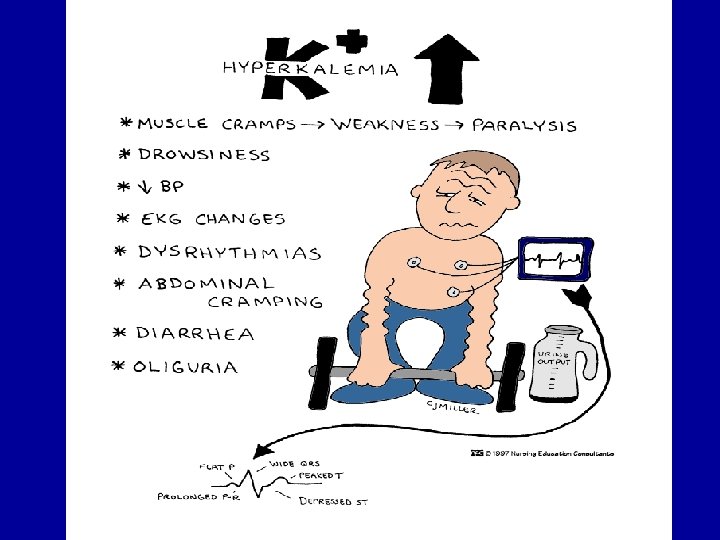
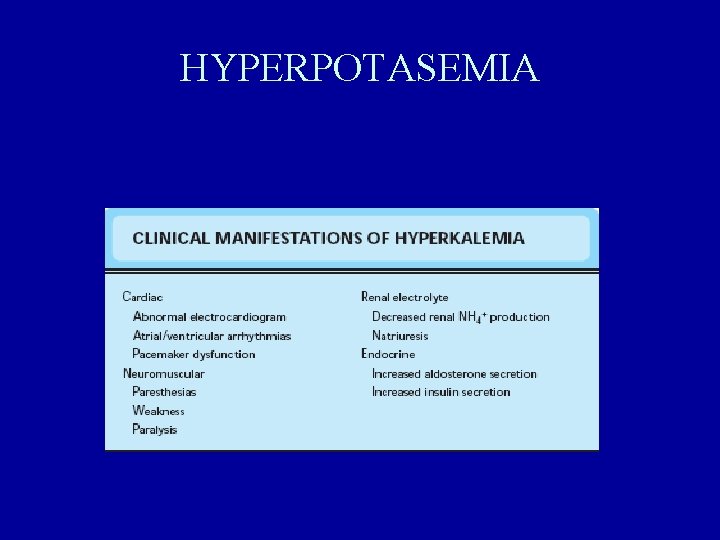
HYPERPOTASEMIA CLINICAL PICTURE – Muscle signs • paresthesia • muscle weakness • paralysis – Cardiac signs • EKG signs • Rhythm disturbances • Dyastolic cardiac arrest
HYPERPOTASEMIA
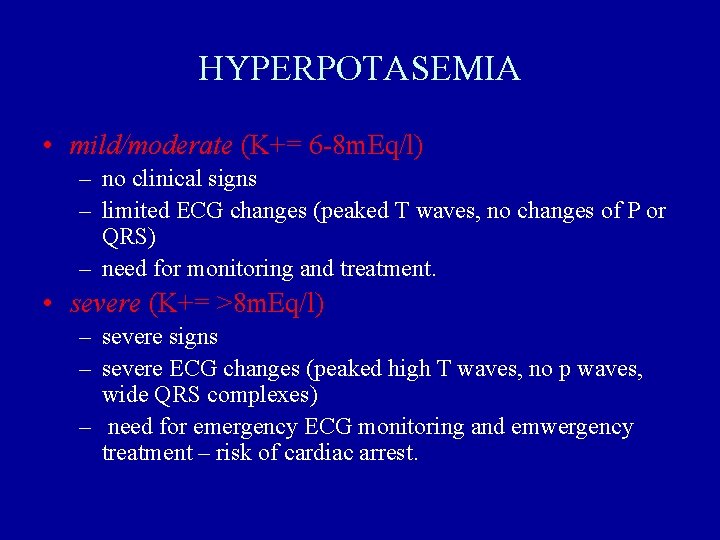
HYPERPOTASEMIA • mild/moderate (K+= 6 -8 m. Eq/l) – no clinical signs – limited ECG changes (peaked T waves, no changes of P or QRS) – need for monitoring and treatment. • severe (K+= >8 m. Eq/l) – severe signs – severe ECG changes (peaked high T waves, no p waves, wide QRS complexes) – need for emergency ECG monitoring and emwergency treatment – risk of cardiac arrest.
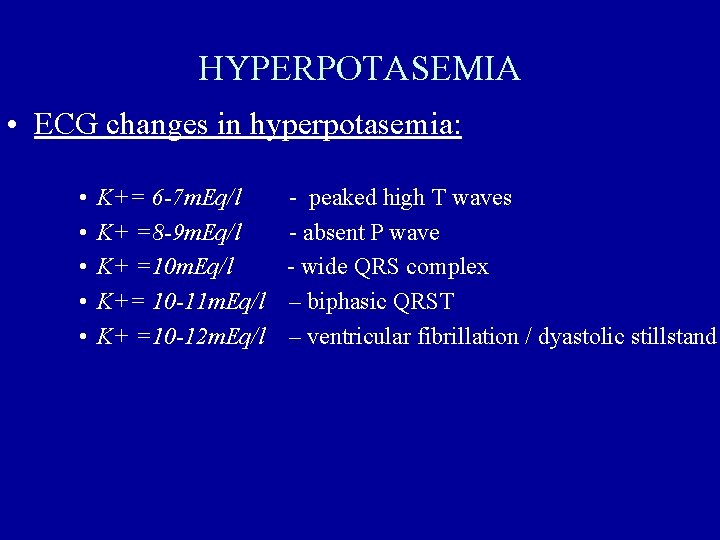
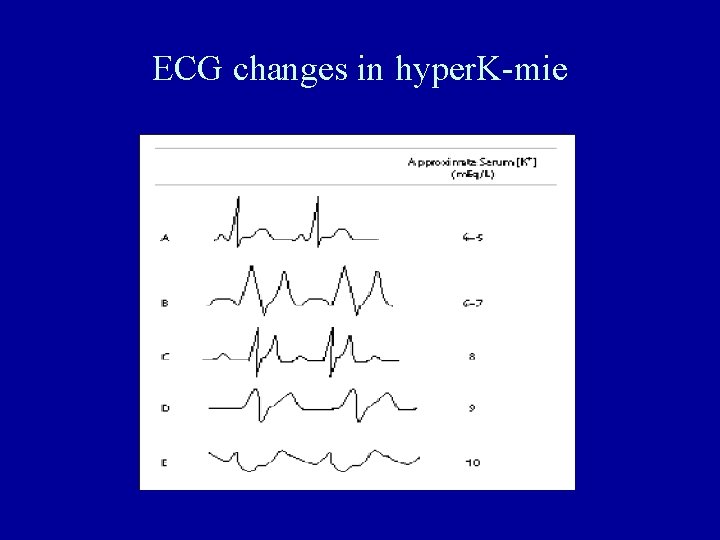
HYPERPOTASEMIA • ECG changes in hyperpotasemia: • • • K+= 6 -7 m. Eq/l - peaked high T waves K+ =8 -9 m. Eq/l - absent P wave K+ =10 m. Eq/l - wide QRS complex K+= 10 -11 m. Eq/l – biphasic QRST K+ =10 -12 m. Eq/l – ventricular fibrillation / dyastolic stillstand
ECG changes in hyper. K-mie
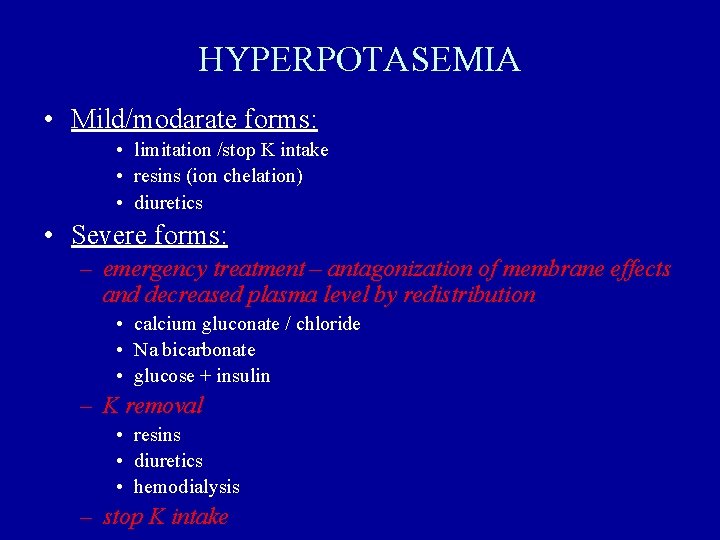
HYPERPOTASEMIA • Mild/modarate forms: • limitation /stop K intake • resins (ion chelation) • diuretics • Severe forms: – emergency treatment – antagonization of membrane effects and decreased plasma level by redistribution • calcium gluconate / chloride • Na bicarbonate • glucose + insulin – K removal • resins • diuretics • hemodialysis – stop K intake
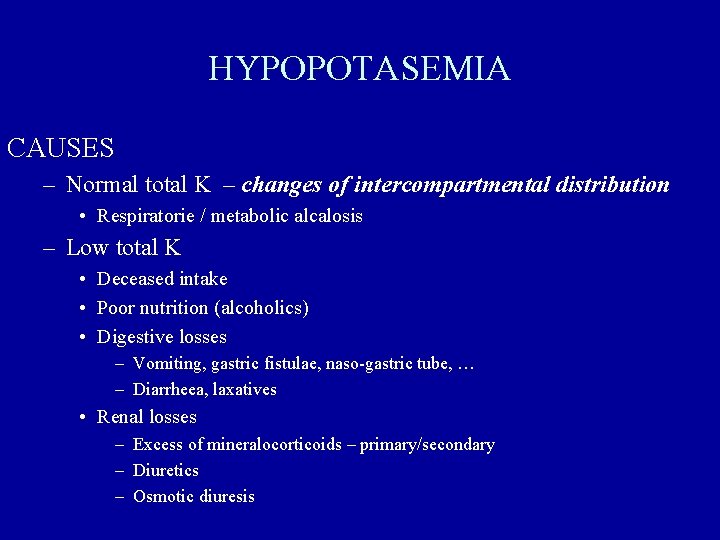
HYPOPOTASEMIA CAUSES – Normal total K – changes of intercompartmental distribution • Respiratorie / metabolic alcalosis – Low total K • Deceased intake • Poor nutrition (alcoholics) • Digestive losses – Vomiting, gastric fistulae, naso-gastric tube, … – Diarrheea, laxatives • Renal losses – Excess of mineralocorticoids – primary/secondary – Diuretics – Osmotic diuresis
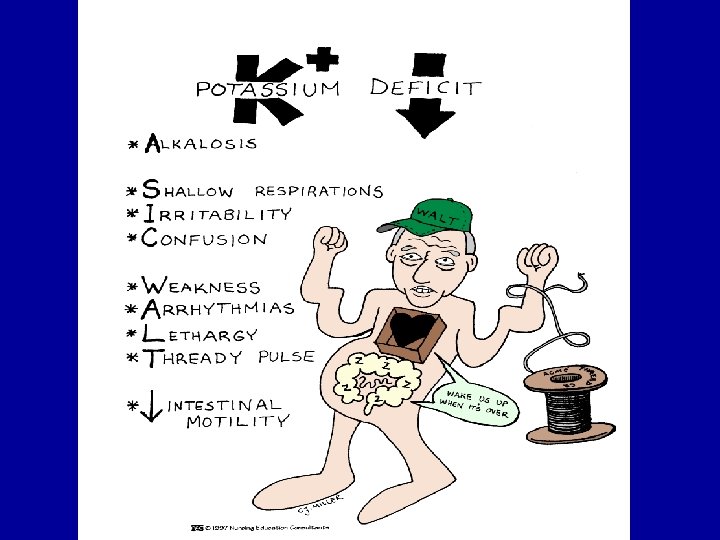
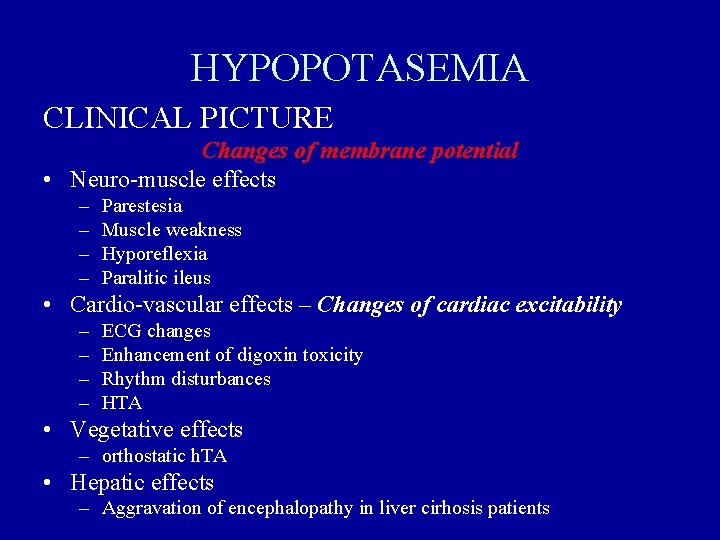
HYPOPOTASEMIA CLINICAL PICTURE Changes of membrane potential • Neuro-muscle effects – – Parestesia Muscle weakness Hyporeflexia Paralitic ileus • Cardio-vascular effects – Changes of cardiac excitability – – ECG changes Enhancement of digoxin toxicity Rhythm disturbances HTA • Vegetative effects – orthostatic h. TA • Hepatic effects – Aggravation of encephalopathy in liver cirhosis patients
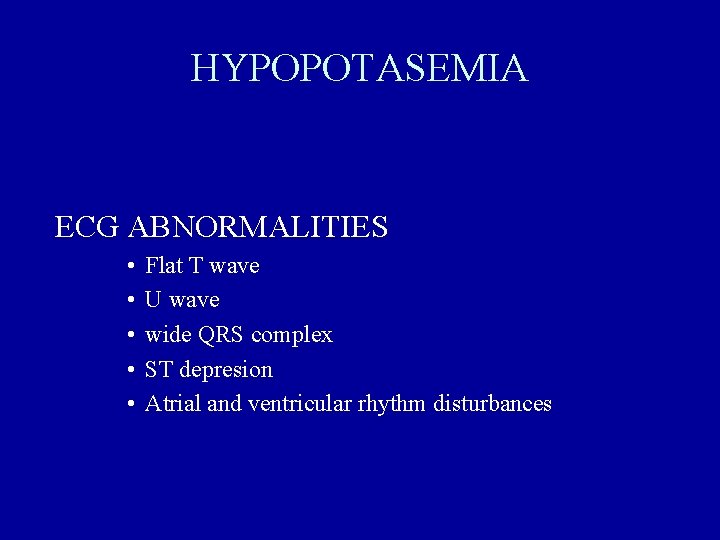
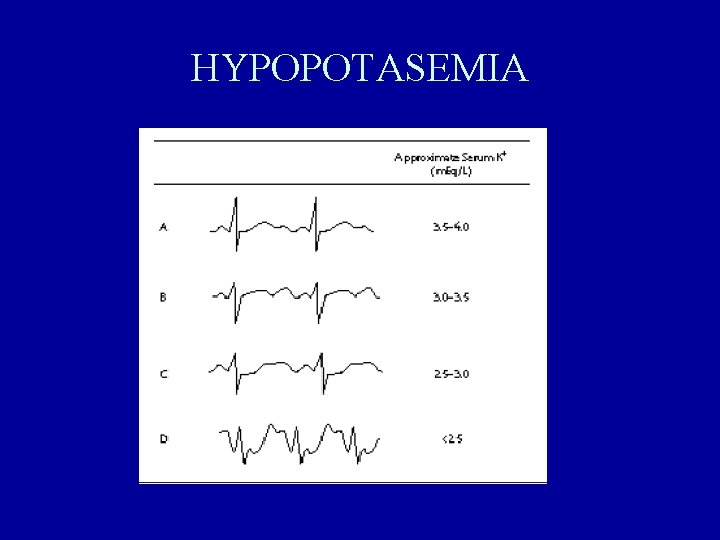
HYPOPOTASEMIA ECG ABNORMALITIES • • • Flat T wave U wave wide QRS complex ST depresion Atrial and ventricular rhythm disturbances
HYPOPOTASEMIA
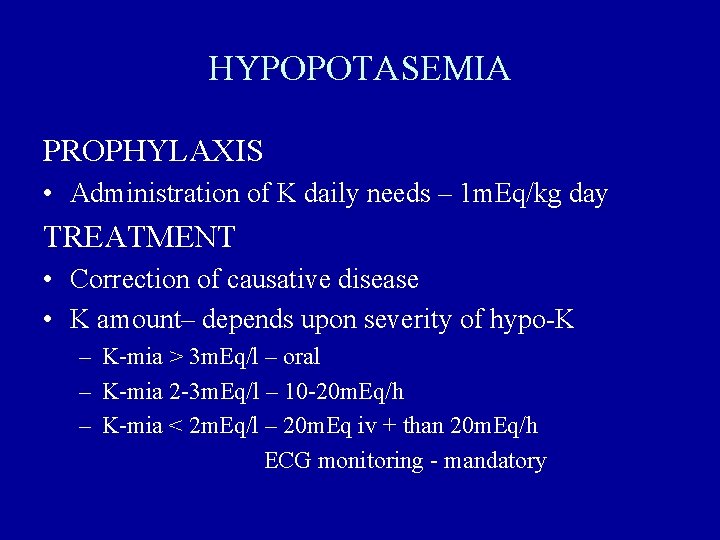
HYPOPOTASEMIA PROPHYLAXIS • Administration of K daily needs – 1 m. Eq/kg day TREATMENT • Correction of causative disease • K amount– depends upon severity of hypo-K – K-mia > 3 m. Eq/l – oral – K-mia 2 -3 m. Eq/l – 10 -20 m. Eq/h – K-mia < 2 m. Eq/l – 20 m. Eq iv + than 20 m. Eq/h ECG monitoring - mandatory