The Stock Market Game Program A classroom activity












- Slides: 61
The Stock Market Game Program A classroom activity for students grades 4 - 12
Stock Market Game Basics
SMG Basics Ø Real-time stock market simulation Ø Played on the internet from any computer Ø The game runs for ten weeks in the fall, spring, and late spring. A new whole year game is also available.
SMG Rules Ø Transactions are made at the SMG World. Wide site at: www. smgww. org Ø Trades are processed in 5 – 20 minutes
SMG Basics Ø Each team begins with a hypothetical $100, 000 Ø Teams should have one to five players
SMG Basics Ø Teams may buy, sell, short sell, or short cover their stocks Ø Invest in common stocks, mutual funds and ETFs traded on the three major exchanges: American, New York, and NASDAQ Stock Exchanges
SMG Basics Ø A 1% brokers fee is charged for each buy or sell – limits day trading issue Ø Stocks valued at less than $3. 00 per share may not be bought Ø Teams may borrow up to $100, 000 to purchase stocks on margin -- interest is charged
SMG Rules Ø Stock and cash dividends and splits are automatically computed into team portfolios Ø Portfolios are updated and available on a daily basis Ø Rankings are updated every weekend Ø Teams will not appear in the rankings until a trade is made
SMG Rules Ø 2% annual rate of interest is earned on cash balance Ø 7% annual rate of interest is paid on negative cash balances (borrowed money)
Ø Trades are made based on prices at time of order (market order). Ø Trades entered after 4: 00 p. m. will are made at the next day’s opening price. Ø You may trade only stocks and mutual funds that have traded within the last 7 days.
SMG Basics Ø Portfolios are not liquidated at the end of the game and should not be liquidated at the end of the game Ø The team with the highest portfolio equity at the end of the game wins Ø Portfolio equity in the tenth week is used for final rankings
How Does the Competition Work?
Teams compete within a geographic region and on six levels
SMG Levels Ø Ø Ø Grades 4 -6 Grades 7 -8 Grades 9 -12 Post-Secondary Youth Groups Adult
General Information
General Information Buying: Ø Ticker symbols are available online Ø Must be for a minimum of 10 shares Ø May set a maximum purchase price limit Ø Called a “Long” position
General Information Buying: Ø Must have closing price of at least $3. 00 per share Ø No “penny” stocks Ø Most brokers will not allow margin purchases of stocks below $5. 00
General Information Selling: Ø Must already own the stock Ø Must be for a minimum of 10 shares (unless selling the only remaining shares) ex: If you bought 120 shares, then sold 115, you may then sell the remaining 5. Ø May set a minimum selling price limit
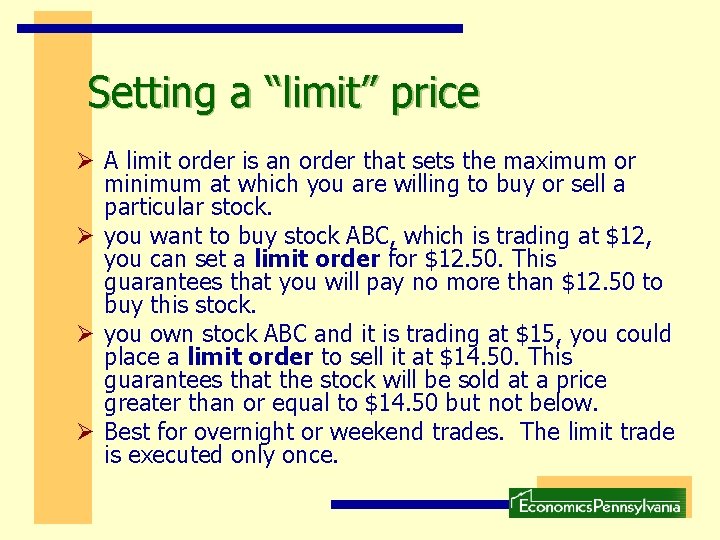
Setting a “limit” price Ø A limit order is an order that sets the maximum or minimum at which you are willing to buy or sell a particular stock. Ø you want to buy stock ABC, which is trading at $12, you can set a limit order for $12. 50. This guarantees that you will pay no more than $12. 50 to buy this stock. Ø you own stock ABC and it is trading at $15, you could place a limit order to sell it at $14. 50. This guarantees that the stock will be sold at a price greater than or equal to $14. 50 but not below. Ø Best for overnight or weekend trades. The limit trade is executed only once.
General Information Please Note: For real time trading price limits are generally not needed except for trades entered after the market close.
General Information Short Selling: Ø Short selling starts with borrowing a stock from your broker Ø You sell the borrowed stock hoping to buy it back at a lower price and return (short cover) it to your broker for a profit Ø All rules for buying still apply
General Information Short Covering: Ø Must have already short sold the stock Ø May set a maximum price limit Ø All other rules for selling apply
General Information Example: Short Selling and Covering I feel that IBM stock is going to go down and want to short sell the stock. Ø I am borrowing the stock from the broker (2% brokerage fee) and selling it. Now I’ve got cash.
General Information Example: Short Selling and Covering Ø When stock price is at its lowest, I short cover by buying the stock back in the stock exchange at the low price and returning it to the broker (2% brokerage fee). I keep what I didn’t spend. Ø I get the difference between the high price and the low price minus the brokerage fees.
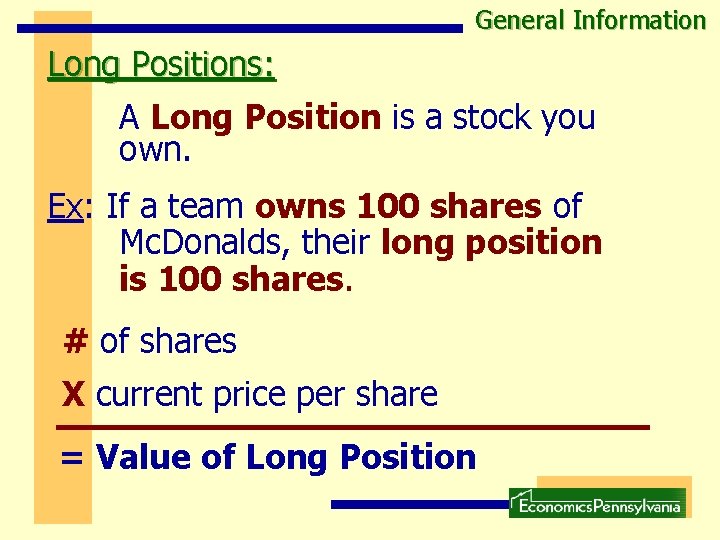
General Information Long Positions: A Long Position is a stock you own. Ex: If a team owns 100 shares of Mc. Donalds, their long position is 100 shares. # of shares X current price per share = Value of Long Position
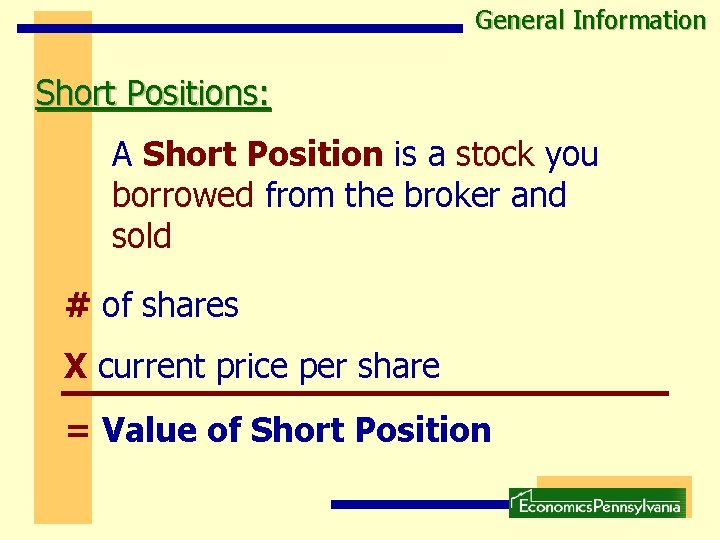
General Information Short Positions: A Short Position is a stock you borrowed from the broker and sold # of shares X current price per share = Value of Short Position
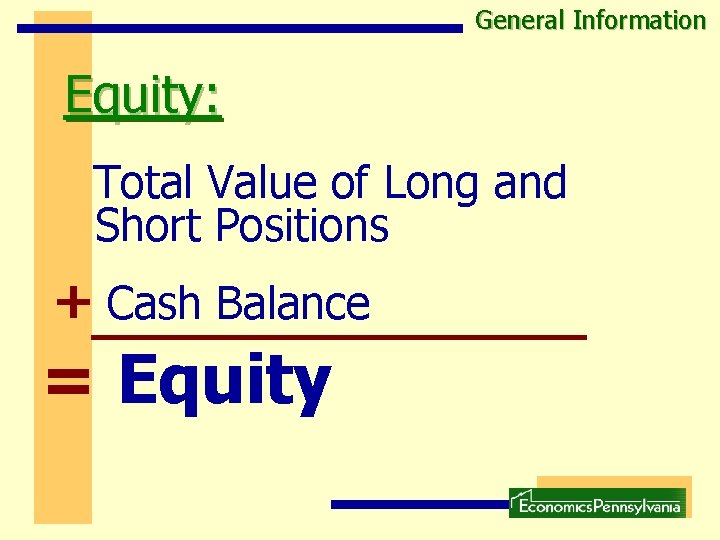
General Information Equity: Total Value of Long and Short Positions + Cash Balance = Equity
General Information Buying on Margin: Ø You may borrow funds using the stock in your portfolio as collateral for the loan Ø Interest charged at 7%
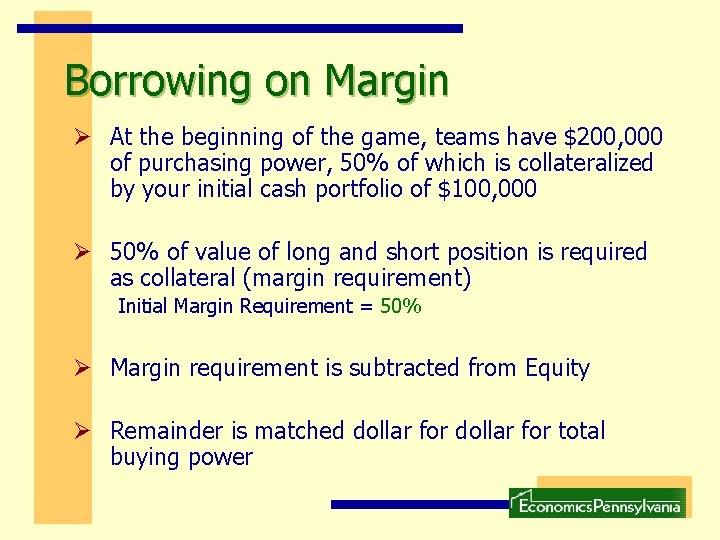
Borrowing on Margin Ø At the beginning of the game, teams have $200, 000 of purchasing power, 50% of which is collateralized by your initial cash portfolio of $100, 000 Ø 50% of value of long and short position is required as collateral (margin requirement) Initial Margin Requirement = 50% Ø Margin requirement is subtracted from Equity Ø Remainder is matched dollar for total buying power
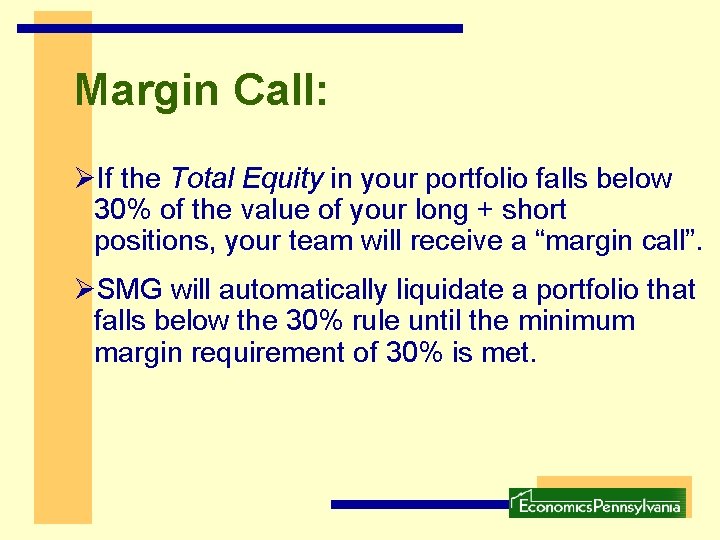
Margin Call: ØIf the Total Equity in your portfolio falls below 30% of the value of your long + short positions, your team will receive a “margin call”. ØSMG will automatically liquidate a portfolio that falls below the 30% rule until the minimum margin requirement of 30% is met.
Investment Basics
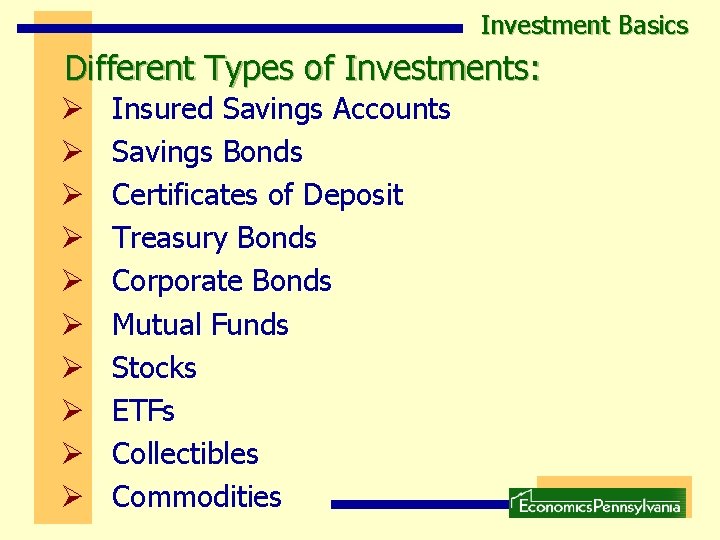
Investment Basics Different Types of Investments: Ø Ø Ø Ø Ø Insured Savings Accounts Savings Bonds Certificates of Deposit Treasury Bonds Corporate Bonds Mutual Funds Stocks ETFs Collectibles Commodities
Investment Basics The RISK to RETURN Relationship: The RISKIER the Investment The HIGHER the Return
Investment Basics The Difference Between Stocks, Bonds, and Mutual Funds Stocks: You own a piece of the company You make money if the company does well Bonds: You loan money to a corporation or government You earn the interest Mutual Funds & ETFs: You own one portion of a collection of stocks, bonds, or other securities
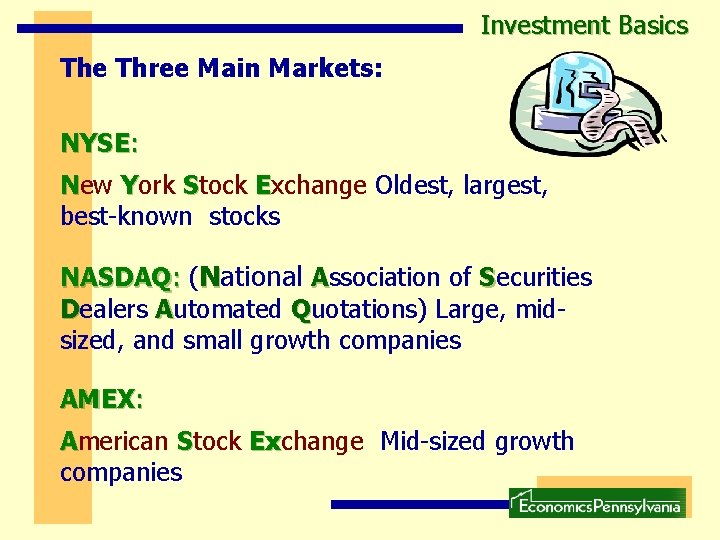
Investment Basics The Three Main Markets: NYSE: New York Stock Exchange Oldest, largest, best-known stocks NASDAQ: (National Association of Securities Dealers Automated Quotations) Large, midsized, and small growth companies AMEX: American Stock Exchange Mid-sized growth Ex companies
Investment Basics The Difference Between Large and Small Companies: Large: Ø Often have high prices Ø Low risk of failure Ø Some pay regular dividends Small: Ø Potential for growth is greater Ø Generally prices are lower
Investment Basics Common Stocks: Ø Pay dividends based on performance of the company Ø Have higher risk but may have higher reward Preferred Stocks: Ø Dividend amount is preset Ø Dividends are paid on preferred stocks before common stocks Ø Have lower risk but may limit reward
Over-The-Counter Stocks Ø A security which is not traded on an exchange, usually due to an inability to meet listing requirements. For such securities, brokers/dealers negotiate directly with one another over computer networks and by phone. The NASD carefully monitors their activities. Ø Be very wary of some OTC stocks, the OTC: BB (Bulletin Board) stocks are either penny stocks or may hold bad credit records.
Investment Basics Stock Splits: Ø More shares are created at a lower price per share Ø Stockholders profit if stocks go up Ø Indicated with an (s) in the paper Ex: Dell $109 $54
Mutual funds Ø Closed-ended funds may be traded just like the stocks traded on the NYSE, NASDAQ and American Stock Exchanges. Ø Open-ended mutual funds can also be traded but cannot be short sold or short covered.
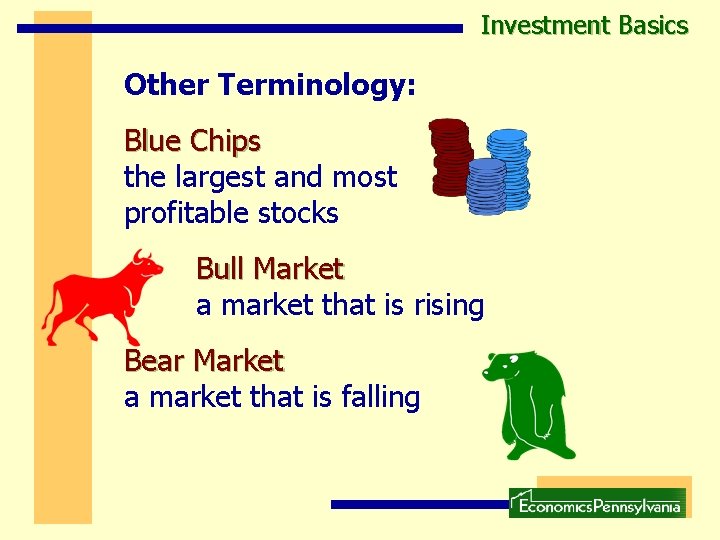
Investment Basics Other Terminology: Blue Chips the largest and most profitable stocks Bull Market a market that is rising Bear Market a market that is falling
Investment Basics Why long term investing is the best route?
Investment Basics DJIA over last 33+ years:
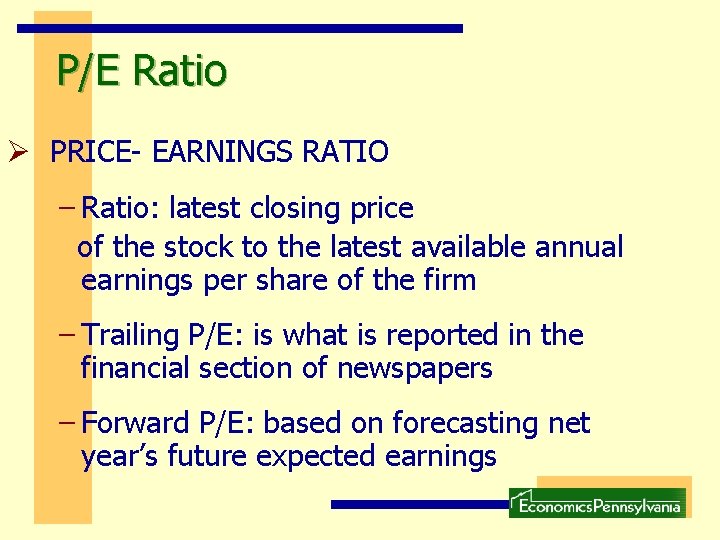
Investment Basics What stocks should I buy? PE Ratio Ø Price-to-earnings ratio. Ø Earnings = earnings per share or firm profit divided by number of shares. Ø More earnings per share given stock price results in a lower PE ratio and a better buy. Ø Find PE ratios in the newspaper.
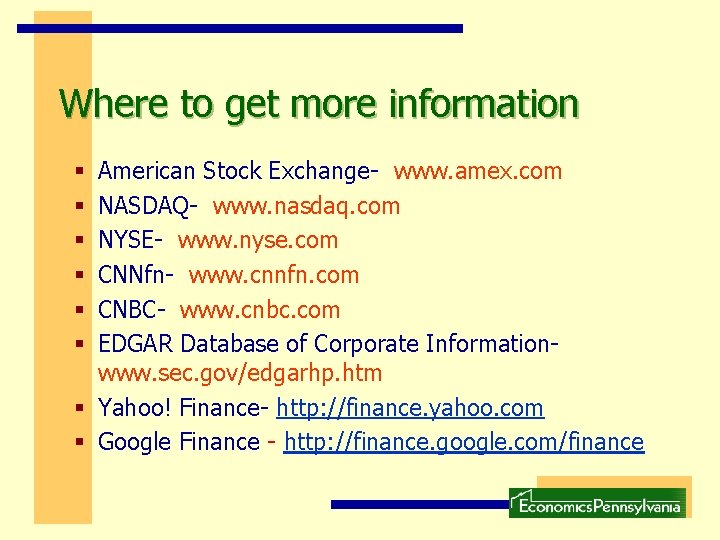
Where to get more information American Stock Exchange- www. amex. com NASDAQ- www. nasdaq. com NYSE- www. nyse. com CNNfn- www. cnnfn. com CNBC- www. cnbc. com EDGAR Database of Corporate Informationwww. sec. gov/edgarhp. htm § Yahoo! Finance- http: //finance. yahoo. com § Google Finance - http: //finance. google. com/finance § § §
How to Read the Stock Market Page
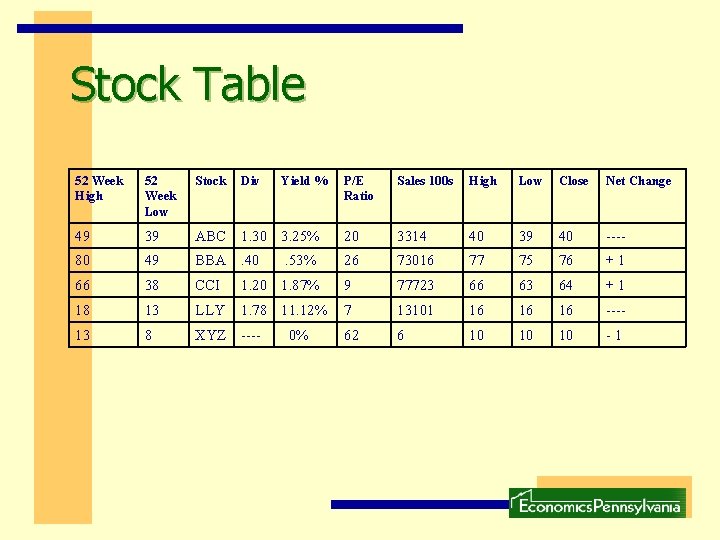
Stock Table 52 Week High 52 Week Low Stock 49 39 80 Div Yield % P/E Ratio Sales 100 s High Low Close Net Change ABC 1. 30 3. 25% 20 3314 40 39 40 ---- 49 BBA. 40 26 73016 77 75 76 +1 66 38 CCI 1. 20 1. 87% 9 77723 66 63 64 +1 18 13 LLY 1. 78 11. 12% 7 13101 16 16 16 ---- 13 8 XYZ ---- 62 6 10 10 10 -1 . 53% 0%
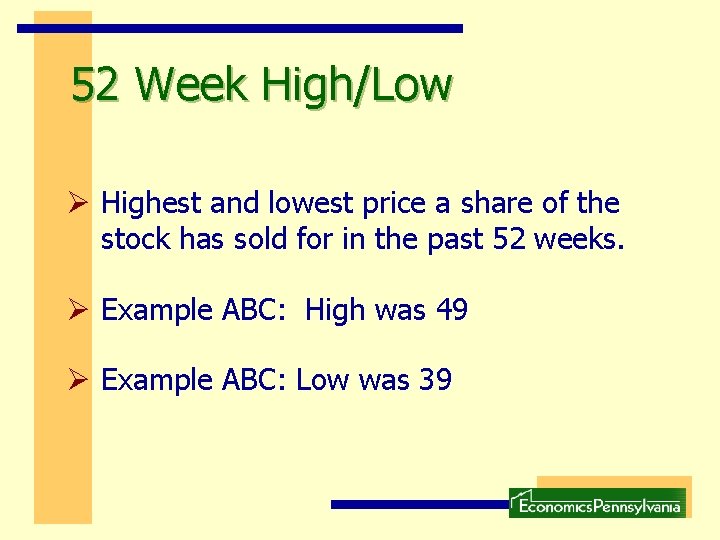
52 Week High/Low Ø Highest and lowest price a share of the stock has sold for in the past 52 weeks. Ø Example ABC: High was 49 Ø Example ABC: Low was 39
Stock Ø Varies by Newspaper Ø Either company abbreviation or ticker symbol Ø In A-Z order
Div Ø Annual Dividend per Share of Stock Ø Based on the rate of the Last Quarterly Payout Ø Annualized Data Ø Example ABC: $1. 30 per share Ø Example: XYZ: $0 per share
Yield Percentage Ø Known as Dividend Yield Ø A Measure of the Income Produced by the Stock Ø Is the Amount of the Dividend divided by the Price of the Stock
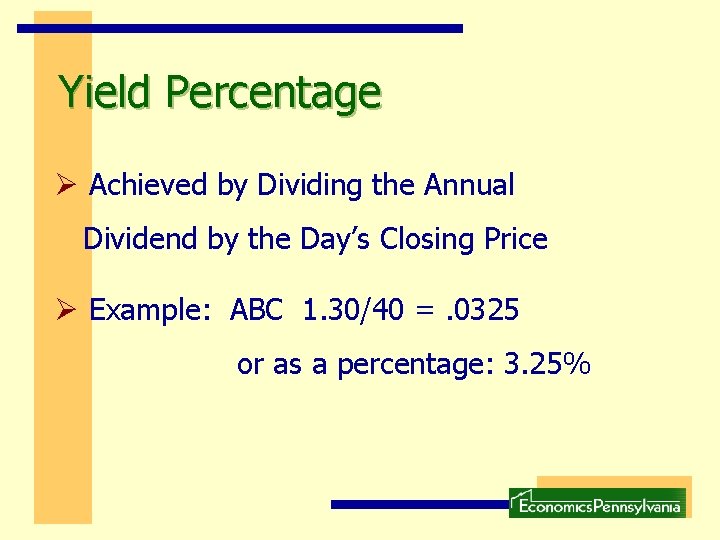
Yield Percentage Ø Achieved by Dividing the Annual Dividend by the Day’s Closing Price Ø Example: ABC 1. 30/40 =. 0325 or as a percentage: 3. 25%
P/E Ratio Ø PRICE- EARNINGS RATIO – Ratio: latest closing price of the stock to the latest available annual earnings per share of the firm – Trailing P/E: is what is reported in the financial section of newspapers – Forward P/E: based on forecasting net year’s future expected earnings
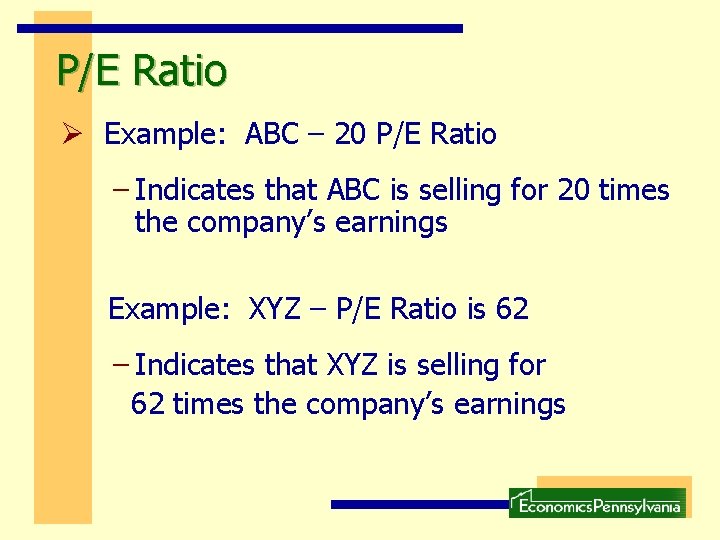
P/E Ratio Ø Example: ABC – 20 P/E Ratio – Indicates that ABC is selling for 20 times the company’s earnings Example: XYZ – P/E Ratio is 62 – Indicates that XYZ is selling for 62 times the company’s earnings
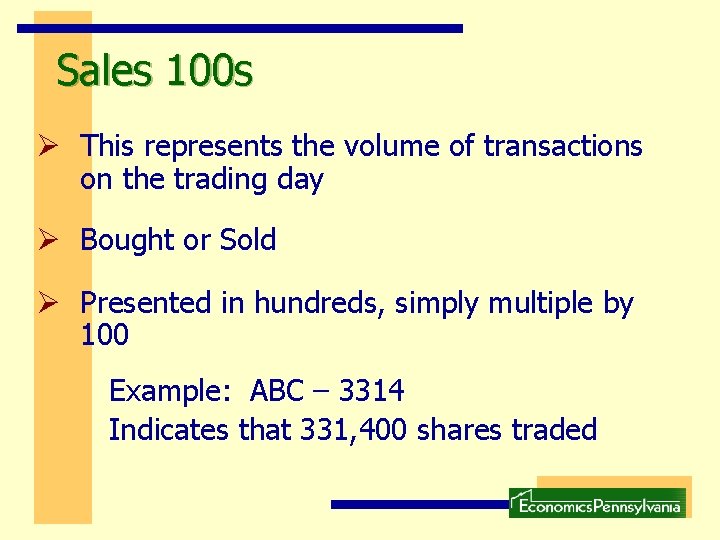
Sales 100 s Ø This represents the volume of transactions on the trading day Ø Bought or Sold Ø Presented in hundreds, simply multiple by 100 Example: ABC – 3314 Indicates that 331, 400 shares traded
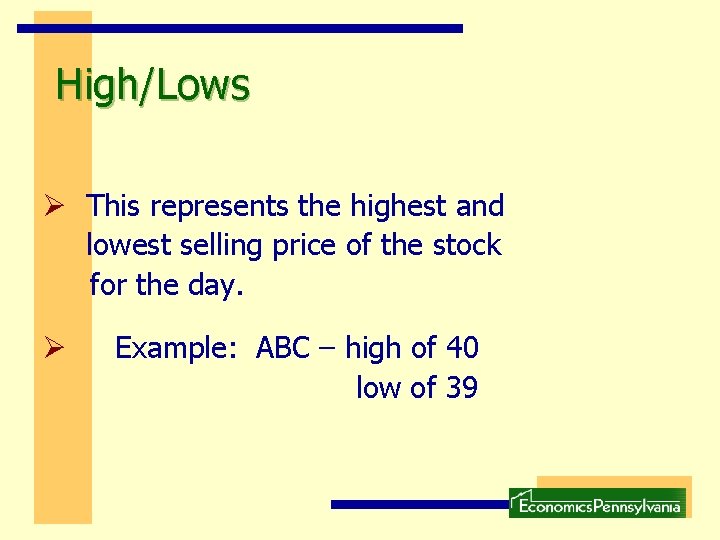
High/Lows Ø This represents the highest and lowest selling price of the stock for the day. Ø Example: ABC – high of 40 low of 39
Close Ø This represents the price of the last stock sold for the day Ø Example: ABC – closed at 40
Net Change Ø This lists the net change between the closing price for the stock for the day and the closing price on the previous trading day Ø Example: BBA: Today’s Close: 76 Net Change: + 1 Previous Day: 75
Earnings per Share Ø A means of valuing common stock. Ø Part of a firm’s profit that is allocated to each outstanding share of common stock. Ø Can be a good indicator of fiscal health
Earnings per Share Ø Many investors carefully watch this number Ø In general, higher earnings per share means better dividend and overall stock performance.
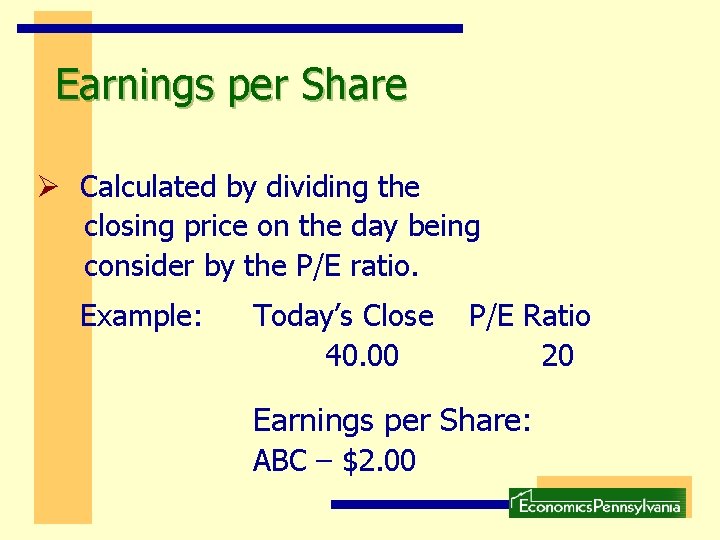
Earnings per Share Ø Calculated by dividing the closing price on the day being consider by the P/E ratio. Example: Today’s Close 40. 00 P/E Ratio 20 Earnings per Share: ABC – $2. 00