Techniques for Developing Computer Systems SSADM l Data


 A standard approach to analysis and design.")


 Provide a graphic representation of information flowing through a system.")
 2 Accounts Dept e.")


 Level 2 (Lower Level) Level")


 This diagram is known")


- Slides: 34
Techniques for Developing Computer Systems SSADM l. Data Flow Diagrams l. Gantt charts l. Critical Path Analysis
Learning Objectives Identify and describe how the use of methodologies / techniques and software tools for developing computer systems aid the systems analyst / designer and programmer in terms of the documentation, step-by-step logical progression through tasks and crosschecking mechanisms.
Why project manage? Need to time the project, both maximum and minimum amounts of time that could be expected for the project. The need to plan when specific workers will be needed. The need for materials to be available when required and not to be there before they are needed. The need to ensure that specific parts of the project are being carried out and not forgotten about. To ensure that one part of the project is finished before reliant parts are begun.
Structured Systems Analysis and Design Method (SSADM) A standard approach to analysis and design. Training is available in the methods used. Designed to assist in the management of large scale software projects. Teams can be used on different aspects of task. Identifies clearly defined stages / modules. Standard documentation throughout. A new manager could take over if necessary. Maintenance is made easier.
SSADM Feasibility Study Covers those aspects of the life-cycle of a system from the feasibility study stage to the production of a physical design Requirements Analysis Requirements Specification Logical System Specification Physical Design
Systems Life Cycle These steps have been explained, informally, in the AS Computing section: n 4. Systems Life Cycle Here we shall show diagrams can help the development of these stages.
Data Flow Diagrams (DFDs) Provide a graphic representation of information flowing through a system. Allows to ask questions like: n n n Are there any other data requirements? Are all data moving between the right departments? Are all the external entities present? The system may be manual, computerized or a mixture of both.
DFDs use four symbols: Entity Outside environment (e. g. Customer) 2 Accounts Dept e. g. Process Data Flow D 1 Data Store Produce Invoices Order e. g. D 1 Customer Orders
Steps to develop DFDs Step 1. Identify dataflows. Notes e. g. documents, VDU screens, phone messages. 2. Identify the external entities. e. g. Customer, Supplier 3. Identify functional areas. 4. Identify data paths. e. g. Departments, individuals. Identify the paths taken by the dataflows identified in step 1. 5. Agree the system boundary. What is inside the system and what is not.
6. Identify the processes. e. g. Production of invoices, delivery notes, payroll production. 7. Identify data stores. Determine which data are to be stored and where. 8. Identify interactions. Identify the interaction between the data stores and the processes. 9. Validate the DFD. Check that meaningful names have been used. Check that all processes have data flows entering and leaving. Check with the user that the diagram represents what is happening now or what is required. 10. Fill in the details.
Different levels used in DFDs Level 1 (Top Level) Level 2 (Lower Level) Level 3 (Not always needed) 0 Payroll System 1 Get hours worked 2. 1 Validate Data 2 Calculate wages 2. 2 Calculate gross wage 3 Produce wage slips 2. 3 Calculate deductions 2. 4 Calculate net wage
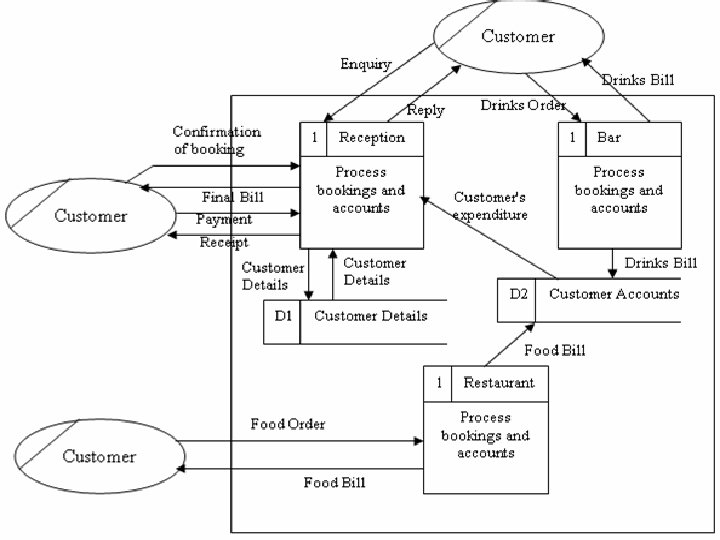
Example Scenario - A hotel reception Receives: n n A large number enquiries (mostly by telephone) each day about the availability of accommodation. Confirmation of bookings which are entered onto a computer database. Any expenses incurred by a guest are passed as bills to a receptionist who enters the details into the database. When guests leave the hotel they are given an invoice detailing all expenditure. When they pay, the database is updated and a receipt is issued.
Flow of data in this example system
Duplication The symbol for the external entity Customer has a diagonal line to indicate that it occurs more than once. This means that any recurrent use of the symbol is the same. n Makes the diagram clearer as otherwise there would be too many flow lines between this symbol and the internal processes.
Duplication Data stores may also be duplicated for the same reason by having a double vertical line on the left hand side. M 1 as shown Customer data N. B. n n n M - manual data store D - computer based data store. There can be no data flows between an external entity and a data store. The flow of data from, or to, an external entity must be between the external entity and a process.
External Entities are always written in the Singular Although there would be more than one customer.
Usually there is more than one external entity. The example of the hotel system only shows one external entity, the customer. Suppose we are dealing with a mail order company. n n One external entity is the customer. The other is the supplier.
Software Modelling Tool to produce DFDs / ER diagrams Library of standard shapes. Appropriate constraints / connections can be imposed. Completed diagrams can be checked according to rules imposed. Data dictionary automatically generated. Tables can be automatically generated.
Gantt Charts When a major project is undertaken, there will be a number of different tasks to be carried out. Some tasks may be able to be done at the same time. It may also be important to work out how long the project should take to complete. Major projects like this can be represented graphically to show the different tasks and how they join together, or relate to each other.
E. g. Building a bungalow A Concreting the foundations takes 4 days B Building the walls takes 4 days C Making the doors and windows takes 7 days D Tiling the roof takes 2 days E Installing the plumbing takes 3 days F Doing the interior carpentry takes 4 days G Installing the electrics takes 6 days H Decorating takes 5 days
Example Gantt Chart
Software tool to draw Gantt charts Provide standard Gantt templates where the duration of tasks can be inserted and later edited. Can automatically: n n Identify parallel tasks and resource loads. Generate cost reports. Project progress: n n n Can be continually superimposed and monitored. Milestones reviewed. Percentages of the chart completed highlighted. Shows: n n Individual components of a task and the relationships between them. Earliest start times, latest end times and shortest time to finish. Simple to follow as completely diagrammatic.
Critical Path Analysis / PERT (Project Evaluation and Review Technique) This diagram is known as a PERT Network: n n Circles = Stages Arrows = The order in which the tasks must be carried out and the time, in days, needed to carry them out.
Stages in Previous Critical Path Analysis Example Diagram 1. 2. 3. 4. 5. 6. 7. Start Foundations finished Start making the windows and doors Walls finished Roof finished Interior finished Bungalow finished
Critical Path The longest journey along the arrows which gives the shortest time for completion. n In this example: 21 days (shortest possible time).
Times Optimum time: n Time to be sure of getting to a node whichever route is chosen. Node 6’s optimum time = 4+4+2+6 = 16 days. Latest starting time: n Time before a node holds up another node. Node 1 must start immediately otherwise the walls (4) won’t be finished by day 8. Node 3 could start immediately or wait a day without affecting the rest.
Software tool to draw Critical Path Analysis diagrams / PERT Different paths / tasks of project represented by different lines of different value according to length of component. Direction of arrows shows the necessary order of completion. Critical path is identified by following the longest journey along the arrows which gives the shortest time for completion. Resources can be allocated at correct times. Deadlines / bottlenecks can be predicted. Changes implemented easily and what ifs can be considered. Network can be validated automatically.
Plenary What are the advantages of using SSADM in designing a new system?
Advantages of using SSADM in designing a new system A standard approach to analysis and design. Training is available in the methods used. Designed to assist in the management of large scale software projects. Teams can be used on different aspects of task. Identifies clearly defined stages / modules. Standard documentation throughout. A new manager could take over if necessary. Maintenance is made easier.
External level Describe the software tools that can assist the work of a project manager.
Software Modelling Tool Produces DFDs / ER diagrams. Library of standard shapes. Appropriate constraints / connections can be imposed. Completed diagrams can be checked according to rules imposed. Data dictionary automatically generated. Tables can be automatically generated.
Software tool to draw Gantt charts Provide standard Gantt templates where the duration of tasks can be inserted and later edited. Can automatically: n n Identify parallel tasks and resource loads. Generate cost reports. Project progress: n n n Can be continually superimposed and monitored. Milestones reviewed. Percentages of the chart completed highlighted. Shows: n n Individual components of a task and the relationships between them. Earliest start times, latest end times and shortest time to finish. Simple to follow as completely diagrammatic.
Software tool to draw Critical Path Analysis diagrams / PERT Different paths / tasks of project represented by different lines of different value according to length of component. Direction of arrows shows the necessary order of completion. Critical path is identified by following the longest journey along the arrows which gives the shortest time for completion. Resources can be allocated at correct times. Deadlines / bottlenecks can be predicted. Changes implemented easily and what ifs can be considered. Network can be validated automatically.