Selecting genomics assays William Stafford Noble Department of

Selecting genomics assays William Stafford Noble Department of Genome Sciences Department of Computer Science and Engineering University of Washington

ENCODE didn’t study my favorite cell type!

We can’t do all possible genomics assays Heart Liver Leukemia … DNase 1 H 3 K 4 me 3 CTCF Cell types As of March, 2016, The ENCODE and Roadmap Epigenomics Consortia have generated 3373 human data sets. Assay types

Which assays should we perform on a new cell type? Cell types A high-quality panel should • measure all types of activity • at minimal total cost. New cell type Assay types

We are interested in choosing representative subsets • Choosing which genomics assays to perform on a new cell type. • Selecting a representative set of existing genomics data sets. • Selecting a representative set of protein sequences.

Removing redundancy in protein sequence data sets An optimization framework for representative set selection Choosing diverse panels of genomics assays

The team Kai Wei Max Libbrecht Jeff Bilmes

Submodular optimization provides a formal framework for selecting representative subsets Continuous optimization : Convexity : : Discrete optimization : ? A. Semidefiniteness B. Submodularity C. Differentiability D. Perspicacity

A set function assigns a real number to every subset of a given set Ground set Set function Quality of the subset
")
How long will it take to find the highest quality subset? n O(2 )

Submodular set functions satisfy the property of diminishing returns Gain from adding v to A f( ) - f( Gain from adding v to A ⋃ B ) ≤ f( ) -f( )

A greedy algorithm maximizes a submodular function within a constant factor of optimal lt! 1. Initialize empty representative set A 2. For 1…k: • Add the item v that most improves the quality of A u s re y e K • Guaranteed to produce a solution within a factor of 1 -1/e ≈ 0. 63 (Nemhauser Mathematical Programming 1978). • Best possible approximation ratio unless P=NP (Feige SIAM 1998). • Can run in practically O(k log n) time (Minoux Optimization Techniques 1978).

Removing redundancy in protein sequence data sets A submodular optimization framework for representative set selection Choosing diverse panels of genomics assays

Problem: What panel of genomics assays should we perform on a new cell type? n Assay type tio i s o Budget = 3 cp i m no e G Cell type Assay similarities New cell type Selection procedure Panel: • H 3 K 4 me 3 • H 3 K 79 me 2 • H 3 K 9 me 3

Estimate the similarity between pairs of assay types via correlation Cell types where both have been performed

The facility location problem has a submodular objective

Facility location function = sum of similarities to most-similar representative

The quality of a panel of genomics assays is estimated via facility location. Similarity of two assay types: Cell types where both have been performed Facility location objective function: Set of all assay types
 selects diverse panels 1 MB Genes H 3 K")
Submodular selection of assays (SSA) selects diverse panels 1 MB Genes H 3 K 27 ac H 3 K 9 ac H 3 K 4 me 1 H 3 K 4 me 2 ► H 3 K 4 me 3 ►H 3 K 79 me 2 H 2 A. Z ► H 3 K 36 me 3 H 4 K 20 me 1 ► H 3 K 9 me 3 ► H 3 K 27 me 3

SSA recapitulates the panel manually selected by the Roadmap Epigenomics consortium Chosen by Roadmap

The submodular function measures the quality of each panel conditional modular value gain function value rank assay 1 H 3 K 4 me 3 3. 183 0 H 3 K 27 ac 2. 615 2 H 3 K 79 me 2 0. 971 2. 403 4. 154 1 H 3 K 79 me 2 0. 836 2. 403 3. 451 3 H 3 K 9 me 3 0. 34 0. 703 4. 494 2 H 3 K 4 me 3 0. 788 3. 183 4. 239 4 H 3 K 27 me 3 0. 246 0. 862 4. 739 3 H 3 K 9 me 3 0. 34 0. 703 4. 579 5 H 3 K 36 me 3 0. 227 1. 214 4. 966 4 H 3 K 27 me 3 0. 246 0. 862 4. 824 6 H 3 K 4 me 1 0. 179 1. 864 5. 145 5 H 3 K 36 me 3 0. 227 1. 214 5. 051 7 H 3 K 4 me 2 0. 083 3. 122 5. 227 6 H 3 K 4 me 1 1. 864 5. 203 8 9 H 3 K 9 ac H 2 A. Z 0. 074 0. 05 3. 128 2. 472 5. 301 5. 352 7 8 H 3 K 27 Ac is H 3 K 4 me 2 H 2 A. Z redundant 0. 153 0. 083 0. 05 3. 122 2. 472 5. 286 5. 336 10 H 4 K 20 me 1 0. 006 1. 412 5. 357 9 H 3 K 9 ac 0. 015 3. 128 5. 352 11 H 3 K 27 ac 0 2. 615 5. 357 10 H 4 K 20 me 1 0. 006 1. 412 5. 357

What happens if we start with H 3 K 27 Ac? conditional modular value gain function value rank assay 1 H 3 K 4 me 3 3. 183 0 H 3 K 27 ac 2. 615 2 H 3 K 79 me 2 0. 971 2. 403 4. 154 1 H 3 K 79 me 2 0. 836 2. 403 3. 451 3 H 3 K 9 me 3 0. 34 0. 703 4. 494 2 H 3 K 4 me 3 0. 788 3. 183 4. 239 4 H 3 K 27 me 3 0. 246 0. 862 4. 739 3 H 3 K 9 me 3 0. 34 0. 703 4. 579 5 H 3 K 36 me 3 0. 227 1. 214 4. 966 4 H 3 K 27 me 3 0. 246 0. 862 4. 824 6 H 3 K 4 me 1 0. 179 1. 864 5. 145 5 H 3 K 36 me 3 0. 227 1. 214 5. 051 7 H 3 K 4 me 2 0. 083 3. 122 5. 227 6 H 3 K 4 me 1 0. 153 1. 864 5. 203 8 9 H 3 K 9 ac H 2 A. Z 0. 074 0. 05 3. 128 2. 472 5. 301 5. 352 7 8 H 3 K 4 me 2 H 2 A. Z 0. 083 0. 05 3. 122 2. 472 5. 286 5. 336 10 H 4 K 20 me 1 0. 006 1. 412 5. 357 9 H 3 K 9 ac 0. 015 3. 128 5. 352 11 H 3 K 27 ac 0 2. 615 5. 357 10 H 4 K 20 me 1 0. 006 1. 412 5. 357 The resulting panels are lower quality.

Selecting TFs in diverse regulatory pathways

How can we objectively evaluate the quality of a panel of genomics assays? Solution: Evaluate the panel’s performance on the most common downstream applications of a panel. 1. Impute the results of assays outside the panel. 2. Identify functional elements (e. g. promoters, enhancers). 3. Use the panel for semi-automated genome annotation.

Evaluation involves holding out some data and comparing to the representative set.

Imputing missing data

Functional element prediction

Semi-automated genome annotation

The facility location objective function is correlated with the evaluation metrics Panels of size 5.

SSA selects panels that are high quality according to all three evaluation metrics Functional element prediction Normalized performance Assay imputation Cell type GM 12878 Panel size Annotation-based evaluation

SSA performs well on various cell types Vertical axis is percentile over 40 random choices.

Problem variant: Which existing assays should you use for a computationally expensive analysis? Existing data Missing data Other variants: • “Given these assays, which experiment should I do next? ” • “Which cell types should I use? ” • “What panel should I use for multiple cell types? ”
 usually increases performance")
Using information about the target cell type (SSA-past) usually increases performance

Removing redundancy in protein sequence data sets A submodular optimization framework for representative set selection Choosing diverse panels of genomics assays

Many people want to find representative sets of protein sequences >4, 000 citations (Google Scholar)

A slightly smaller team Max Libbrecht Jeff Bilmes

Existing solutions use a heuristic algorithm 1. Sort sequences in decreasing order of length. 2. Initialize representative set A as empty 3. For each sequence s: • If the most similar sequence to s in A has similarity <T (e. g. 40% identity), add s to A. CD-HIT (Li Bioinformatics 2006) and Pisces (Wang Bioinformatics 2003).

We need a submodular estimate of the quality of a subset of protein sequences Sum-redundancy objective function: Approaches zero when no sequences are similar to each other. We tested 29 other objective functions on a development set (21% of the data).

Optimizing sum-redundancy effectively removes redundancy in the representative set CD-HIT 40% CD-HIT 90%

Optimizing sum-redundancy chooses very few sequences with detectable similarity at the cost of choosing a small number of closely-related pairs 40%

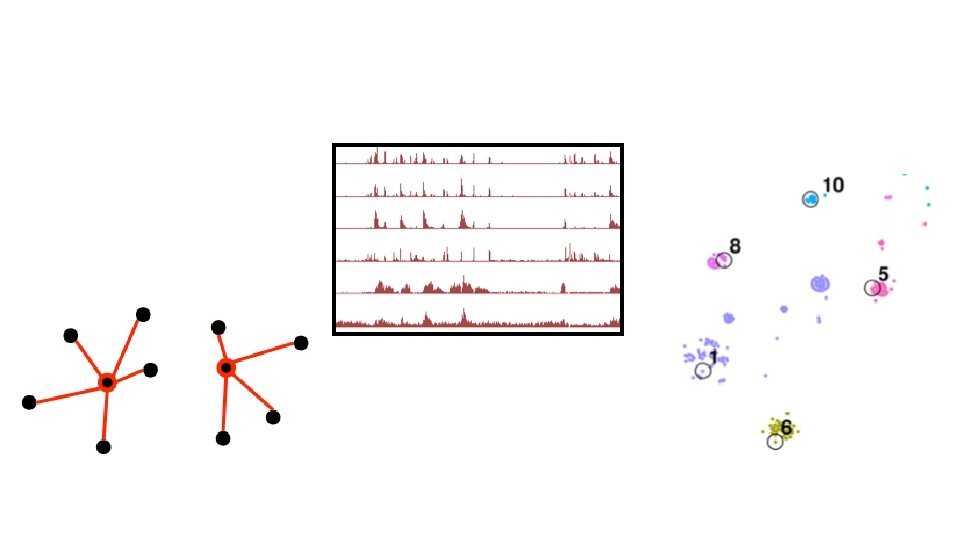
Selection using submodular optimization chooses proteins with diverse structures Bacterial photosystem II reaction center Toxin’s membrane translocation domains Leukocidin-like SCOPe: “Structural Classification of Proteins—extended” SCOPe assigns protein domain sequences to protein structure families. Single transmembrane helix Quality of a subset = Number of families it covers Transmembrane beta barrels; Ligand-gated protein channel Aquaporin-like Family A G protein-coupled receptor. Transmembrane beta-barrels; like Porin Voltage-gated potassium channels Clc choride channel Projection via t-SNE (Van der Maaten JMLR 2008)

Optimizing sum-redundancy results in representative sets with high structural diversity

Optimizing sum-redundancy results in representative sets with high structural diversity Compared to CD-HIT with 40% threshold, we leave 27% fewer families uncovered.

Using a different objective and similarity measure results in better performance for small subsets Rankprop similarity function: Facility-location objective function:

Using a different objective and similarity measure results in better performance for small subsets Rankprop similarity function: Facility-location objective function: (Weston PNAS 2004)

A mixture of objective functions performs better than any single function

What data sets do you want to summarize?
- Slides: 48