Principles of Microeconomics 1 Demand Supply Akos Lada




- Slides: 53
Principles of Microeconomics 1. Demand Supply Akos Lada July 21 st , 2014
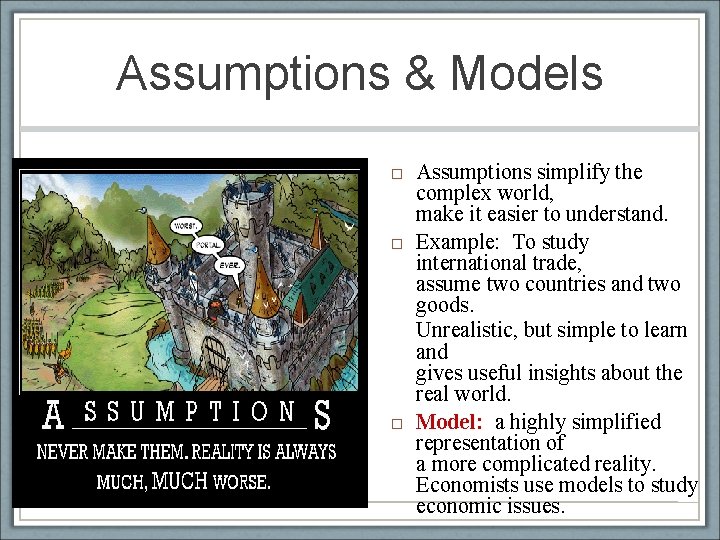
Assumptions & Models Assumptions simplify the complex world, make it easier to understand. Example: To study international trade, assume two countries and two goods. Unrealistic, but simple to learn and gives useful insights about the real world. Model: a highly simplified representation of a more complicated reality. Economists use models to study economic issues.
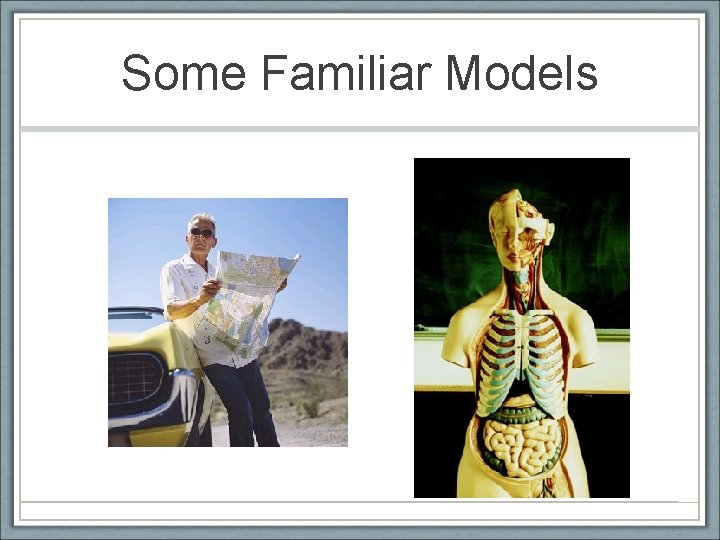
Some Familiar Models
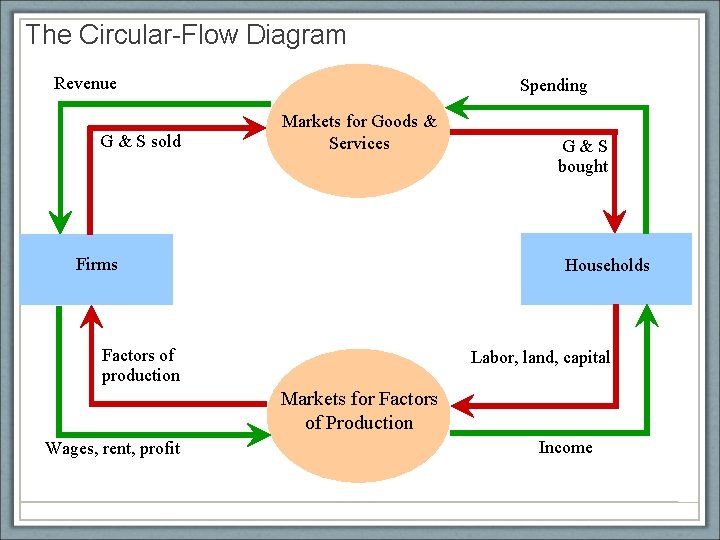
Our First Model: The Circular-Flow Diagram: a visual model of the economy, shows how dollars flow through markets among households and firms Two types of “actors”: households firms Two markets: the market for goods and services the market for “factors of production”
Factors of Production Factors of production: the resources the economy uses to produce goods & services, including labor land capital (buildings & machines used in production)
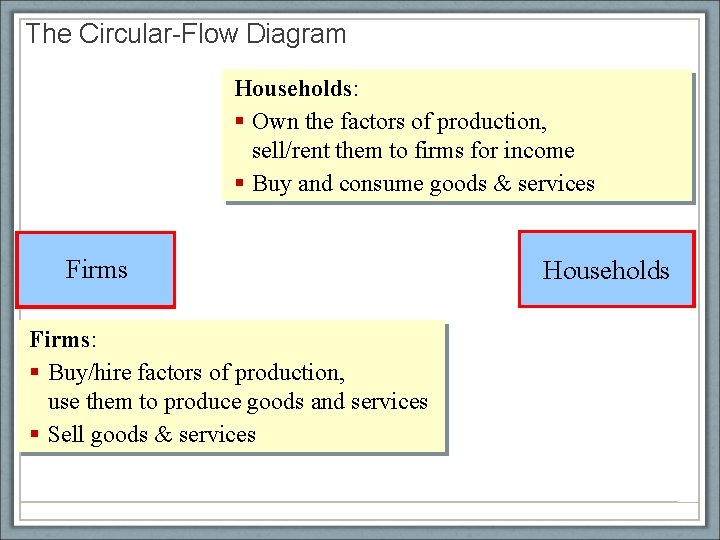
The Circular-Flow Diagram Households: § Own the factors of production, sell/rent them to firms for income § Buy and consume goods & services Firms: § Buy/hire factors of production, use them to produce goods and services § Sell goods & services Households
The Circular-Flow Diagram Revenue G & S sold Spending Markets for Goods & Services Firms G&S bought Households Factors of production Labor, land, capital Markets for Factors of Production Wages, rent, profit Income
Demand
Motivating questions Question: What are the economic forces behind this news?
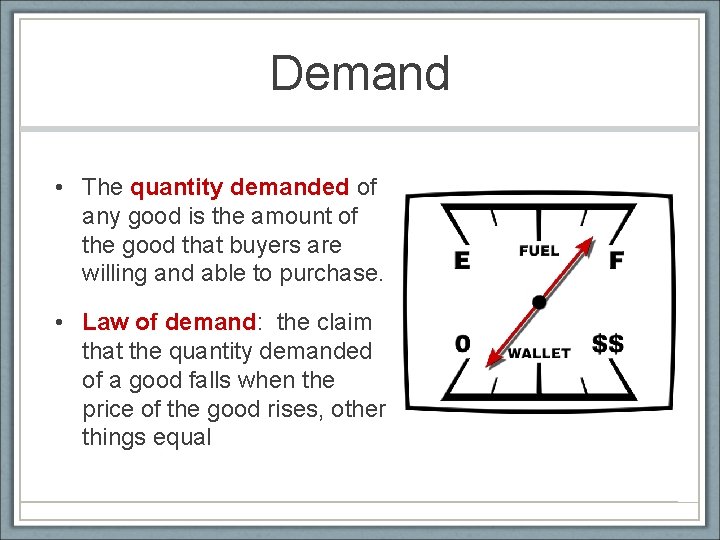
Demand • The quantity demanded of any good is the amount of the good that buyers are willing and able to purchase. • Law of demand: the claim that the quantity demanded of a good falls when the price of the good rises, other things equal
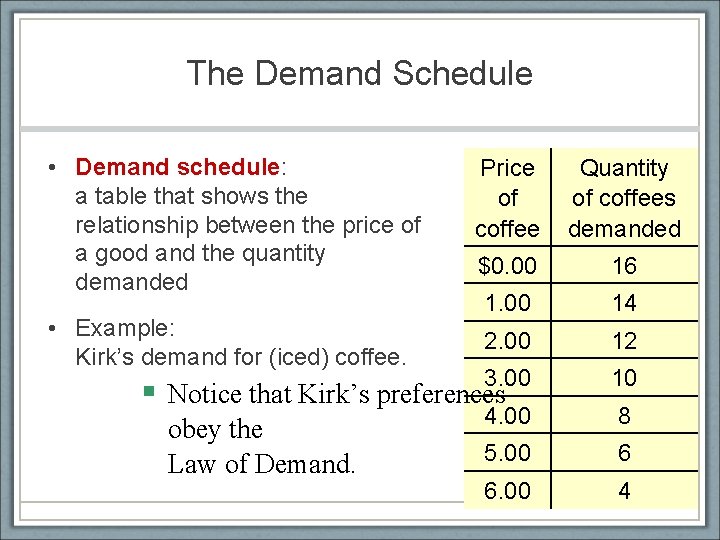
The Demand Schedule • Demand schedule: a table that shows the relationship between the price of a good and the quantity demanded • Example: Kirk’s demand for (iced) coffee. Price of coffee Quantity of coffees demanded $0. 00 16 1. 00 14 2. 00 12 3. 00 10 4. 00 8 5. 00 6 6. 00 4 § Notice that Kirk’s preferences obey the Law of Demand.
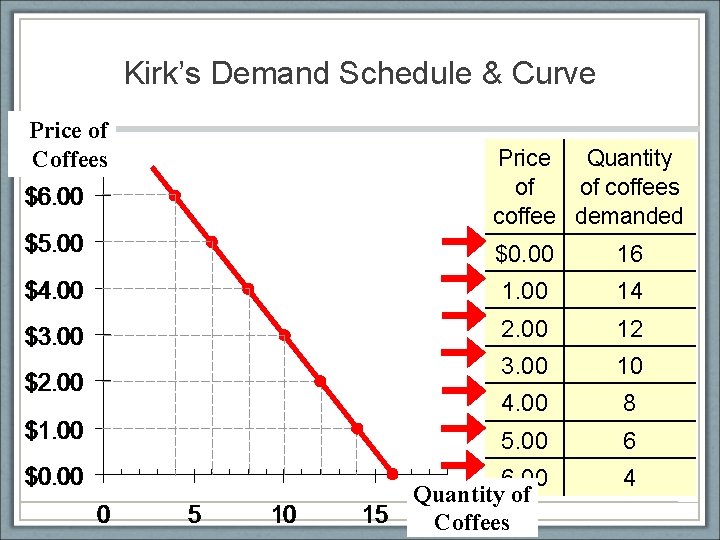
Kirk’s Demand Schedule & Curve Price of Coffees Price Quantity of of coffees coffee demanded $0. 00 16 1. 00 14 2. 00 12 3. 00 10 4. 00 8 5. 00 6 6. 00 Quantity of Coffees 4
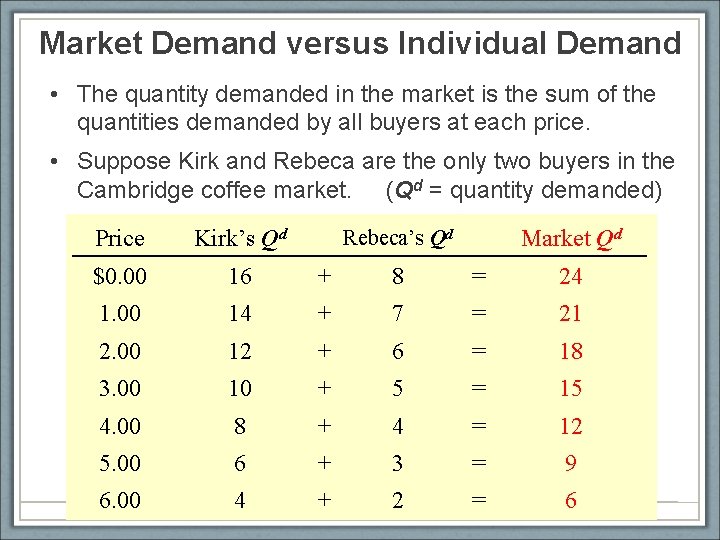
Market Demand versus Individual Demand • The quantity demanded in the market is the sum of the quantities demanded by all buyers at each price. • Suppose Kirk and Rebeca are the only two buyers in the Cambridge coffee market. (Qd = quantity demanded) Price Kirk’s Qd Market Qd $0. 00 16 + 8 = 24 1. 00 14 + 7 = 21 2. 00 12 + 6 = 18 3. 00 10 + 5 = 15 4. 00 8 + 4 = 12 5. 00 6 + 3 = 9 6. 00 4 + 2 = 6 Rebeca’s Qd
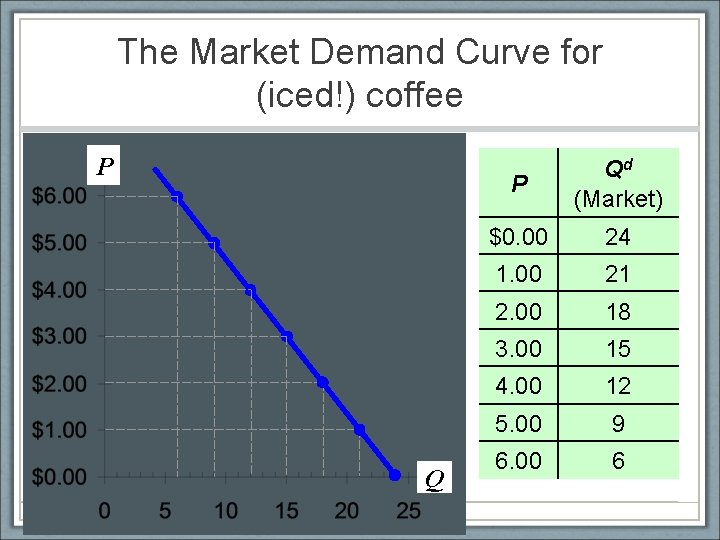
The Market Demand Curve for (iced!) coffee P Qd (Market) $0. 00 24 1. 00 21 2. 00 18 3. 00 15 4. 00 12 5. 00 9 6. 00 6
Demand Curve Shifters • The demand curve shows how price affects quantity demanded, other things being equal. • These “other things” are non-price determinants of demand (i. e. , things that determine buyers’ demand for a good, other than the good’s price). • Changes in them shift the D curve…
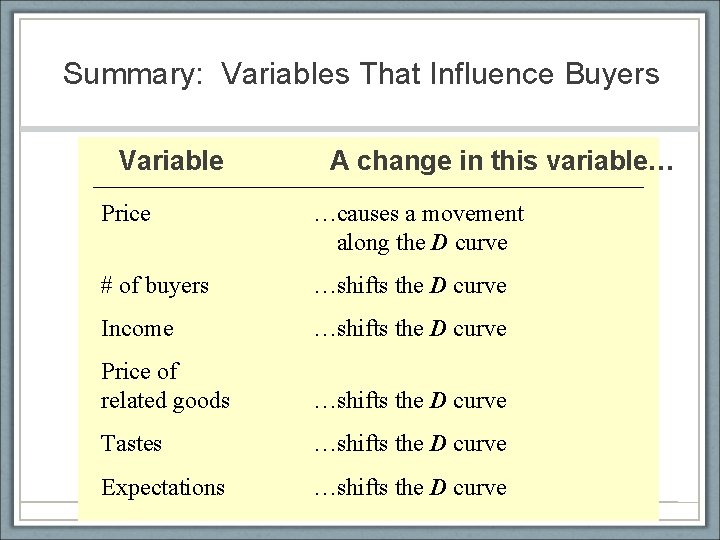
Summary: Variables That Influence Buyers Variable A change in this variable… Price …causes a movement along the D curve # of buyers …shifts the D curve Income …shifts the D curve Price of related goods …shifts the D curve Tastes …shifts the D curve Expectations …shifts the D curve
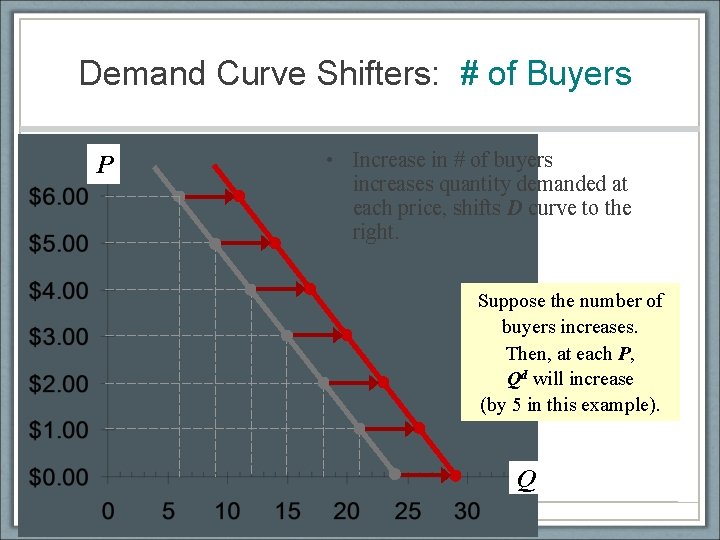
Demand Curve Shifters: # of Buyers P • Increase in # of buyers increases quantity demanded at each price, shifts D curve to the right. Suppose the number of buyers increases. Then, at each P, Qd will increase (by 5 in this example). Q
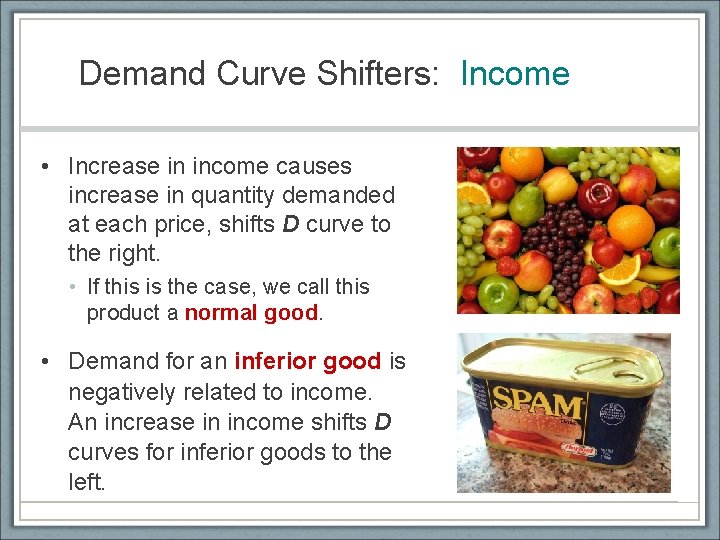
Demand Curve Shifters: Income • Increase in income causes increase in quantity demanded at each price, shifts D curve to the right. • If this is the case, we call this product a normal good. • Demand for an inferior good is negatively related to income. An increase in income shifts D curves for inferior goods to the left.
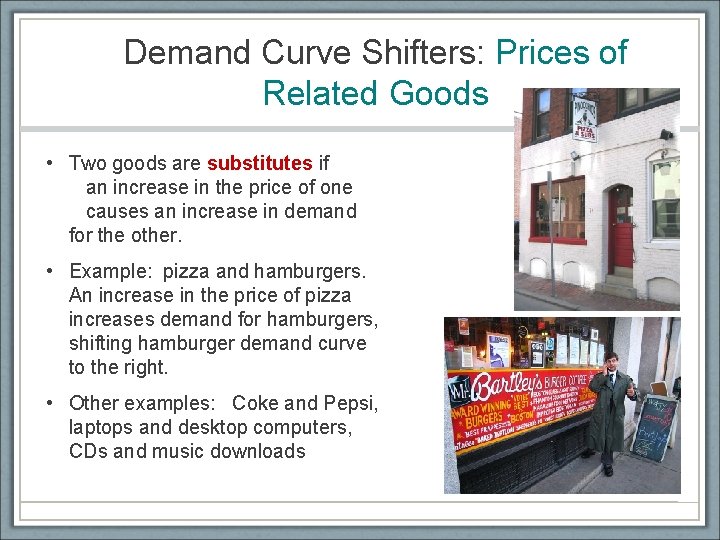
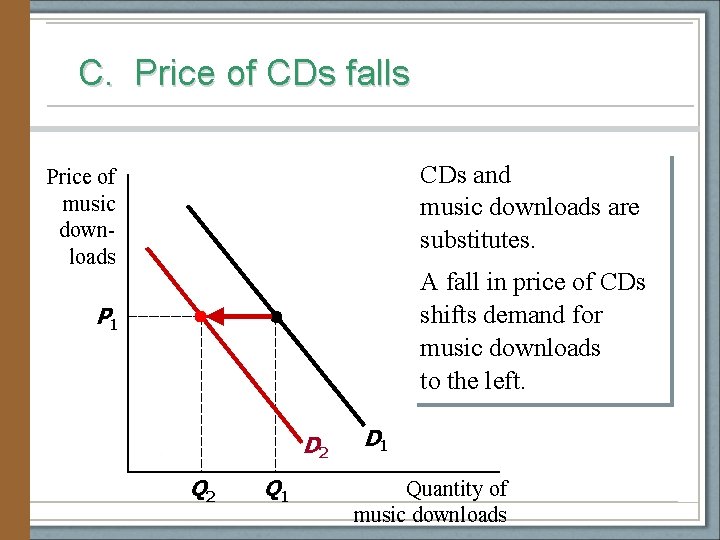
Demand Curve Shifters: Prices of Related Goods • Two goods are substitutes if an increase in the price of one causes an increase in demand for the other. • Example: pizza and hamburgers. An increase in the price of pizza increases demand for hamburgers, shifting hamburger demand curve to the right. • Other examples: Coke and Pepsi, laptops and desktop computers, CDs and music downloads
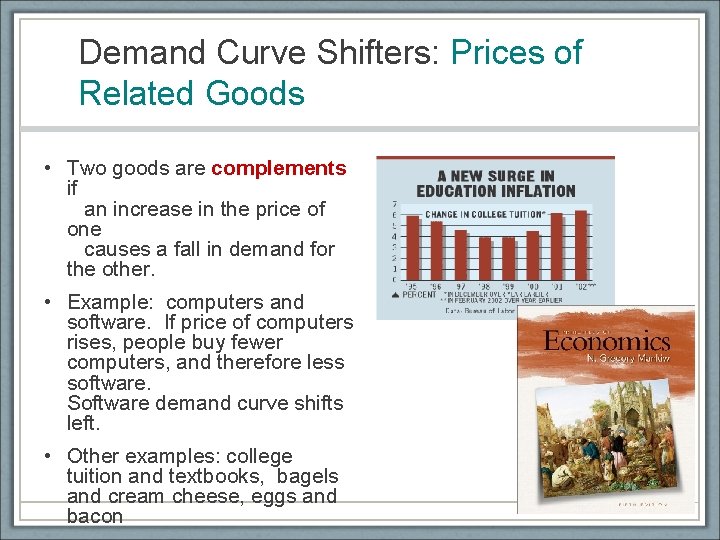
Demand Curve Shifters: Prices of Related Goods • Two goods are complements if an increase in the price of one causes a fall in demand for the other. • Example: computers and software. If price of computers rises, people buy fewer computers, and therefore less software. Software demand curve shifts left. • Other examples: college tuition and textbooks, bagels and cream cheese, eggs and bacon
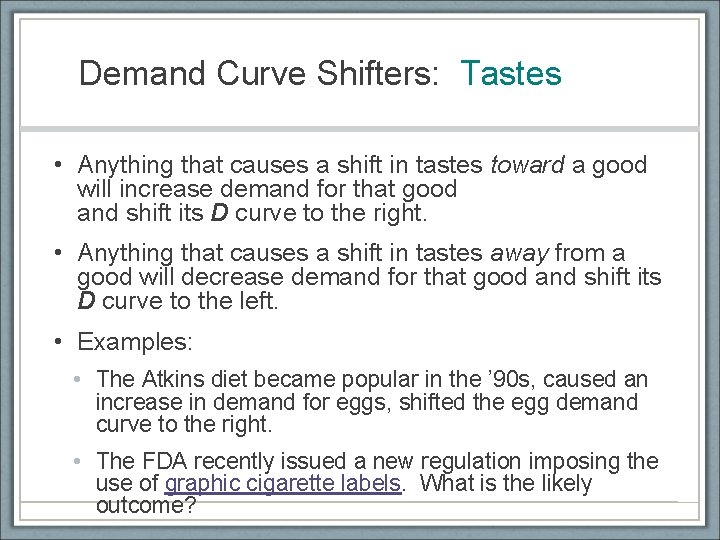
Demand Curve Shifters: Tastes • Anything that causes a shift in tastes toward a good will increase demand for that good and shift its D curve to the right. • Anything that causes a shift in tastes away from a good will decrease demand for that good and shift its D curve to the left. • Examples: • The Atkins diet became popular in the ’ 90 s, caused an increase in demand for eggs, shifted the egg demand curve to the right. • The FDA recently issued a new regulation imposing the use of graphic cigarette labels. What is the likely outcome?
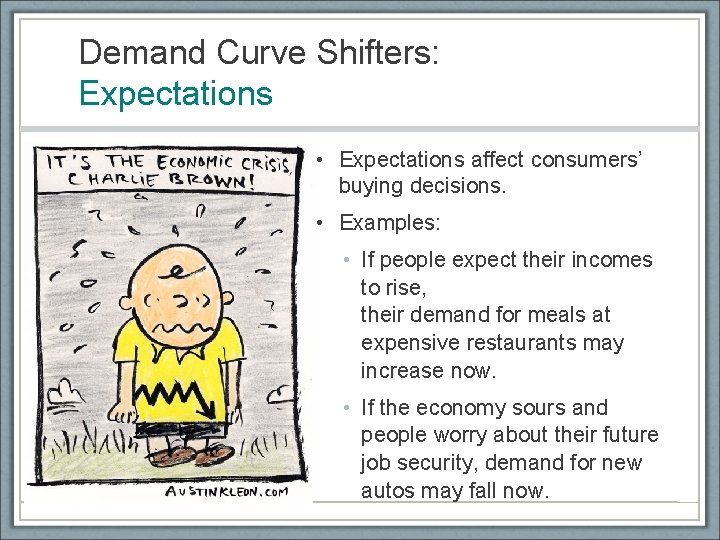
Demand Curve Shifters: Expectations • Expectations affect consumers’ buying decisions. • Examples: • If people expect their incomes to rise, their demand for meals at expensive restaurants may increase now. • If the economy sours and people worry about their future job security, demand for new autos may fall now.
STUDENTS’ TURN: Demand Curve Draw a demand curve for music downloads. What happens to it in the following scenarios? Why? A. The price of i. Pods falls B. The price of music downloads falls C. The price of CDs falls
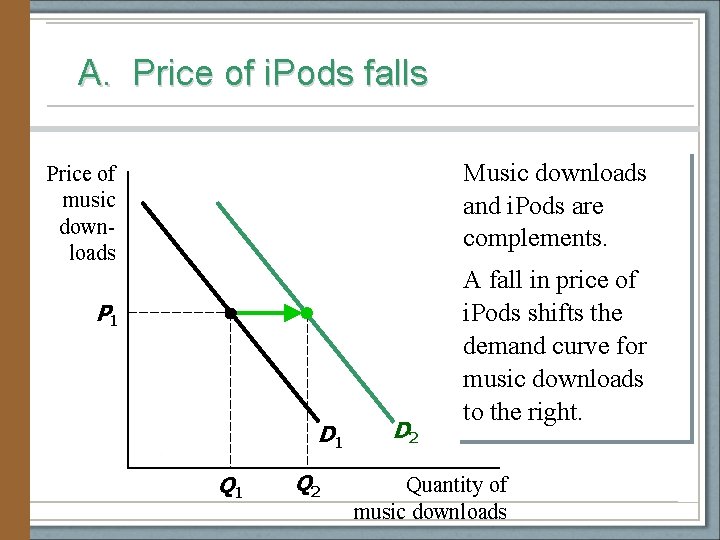
A. Price of i. Pods falls Music downloads and i. Pods are complements. Price of music downloads P 1 D 1 Q 2 D 2 A fall in price of i. Pods shifts the demand curve for music downloads to the right. Quantity of music downloads
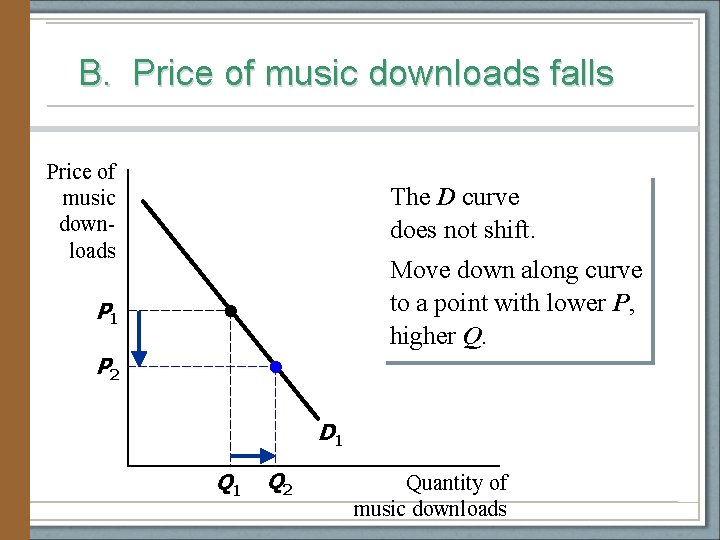
B. Price of music downloads falls Price of music downloads The D curve does not shift. Move down along curve to a point with lower P, higher Q. P 1 P 2 D 1 Q 2 Quantity of music downloads
C. Price of CDs falls CDs and music downloads are substitutes. Price of music downloads A fall in price of CDs shifts demand for music downloads to the left. P 1 D 2 Q 1 D 1 Quantity of music downloads
3. Supply
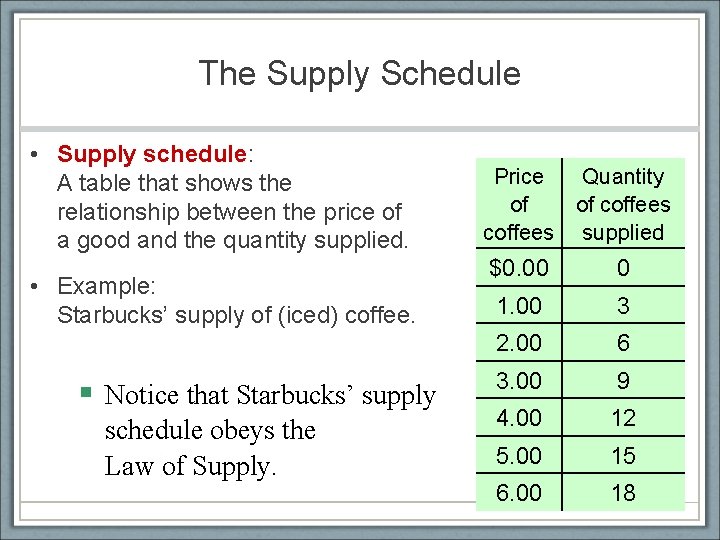
Supply • The quantity supplied of any good is the amount that sellers are willing and able to sell. • Law of supply: the claim that the quantity supplied of a good rises when the price of the good rises, other things equal
The Supply Schedule • Supply schedule: A table that shows the relationship between the price of a good and the quantity supplied. • Example: Starbucks’ supply of (iced) coffee. § Notice that Starbucks’ supply schedule obeys the Law of Supply. Price Quantity of of coffees supplied $0. 00 0 1. 00 3 2. 00 6 3. 00 9 4. 00 12 5. 00 15 6. 00 18
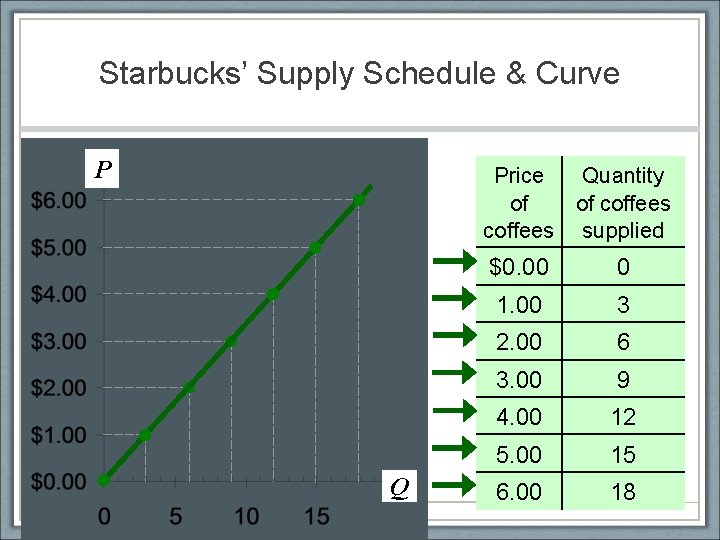
Starbucks’ Supply Schedule & Curve P Price Quantity of of coffees supplied Q $0. 00 0 1. 00 3 2. 00 6 3. 00 9 4. 00 12 5. 00 15 6. 00 18
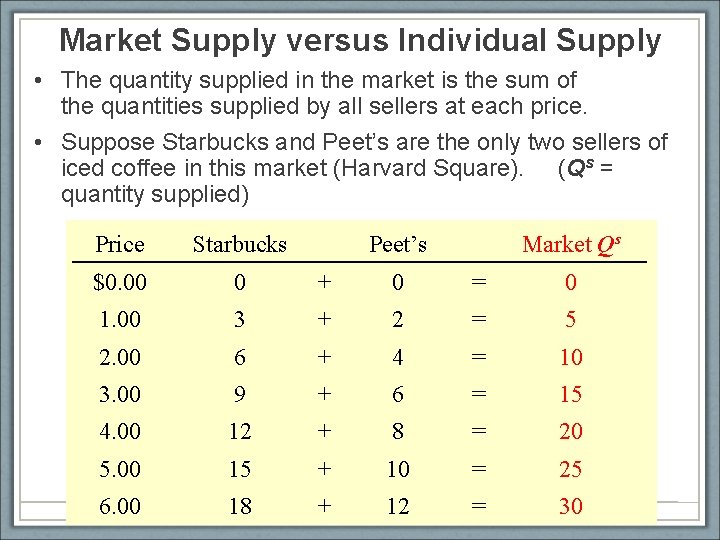
Market Supply versus Individual Supply • The quantity supplied in the market is the sum of the quantities supplied by all sellers at each price. • Suppose Starbucks and Peet’s are the only two sellers of iced coffee in this market (Harvard Square). (Qs = quantity supplied) Price Starbucks Peet’s Market Qs $0. 00 0 + 0 = 0 1. 00 3 + 2 = 5 2. 00 6 + 4 = 10 3. 00 9 + 6 = 15 4. 00 12 + 8 = 20 5. 00 15 + 10 = 25 6. 00 18 + 12 = 30
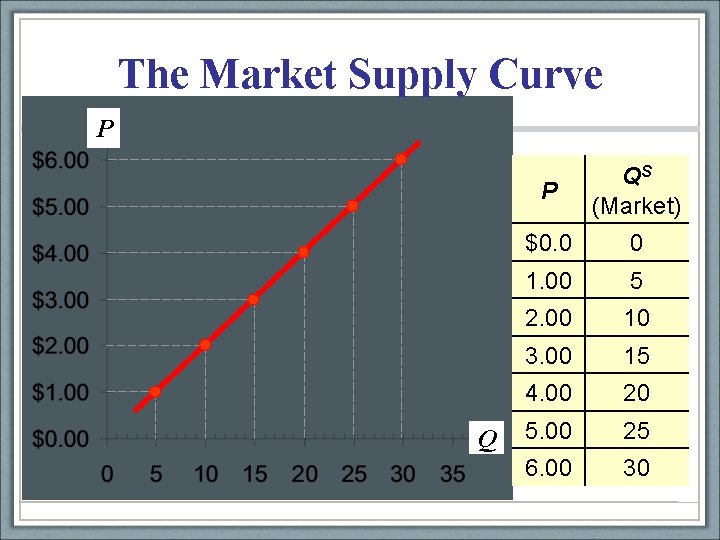
The Market Supply Curve P QS (Market) $0. 0 0 1. 00 5 2. 00 10 3. 00 15 4. 00 20 5. 00 25 6. 00 30
Supply Curve Shifters • The supply curve shows how price affects quantity supplied, other things being equal. • These “other things” are non-price determinants of supply. • Changes in them shift the S curve…
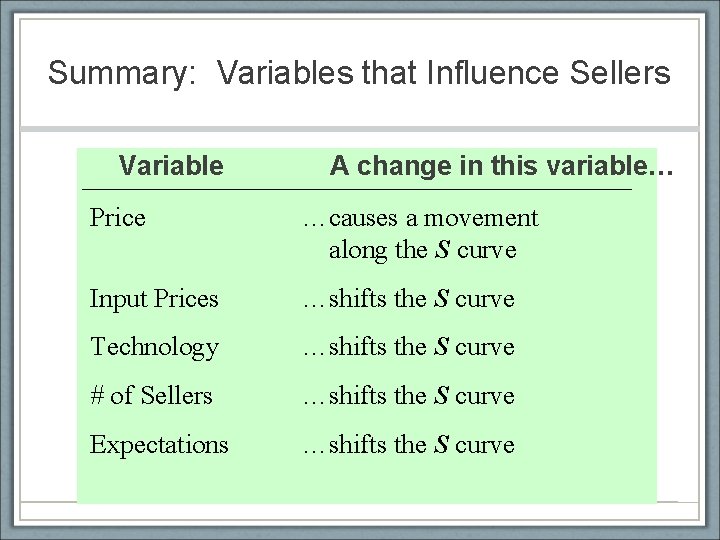
Summary: Variables that Influence Sellers Variable A change in this variable… Price …causes a movement along the S curve Input Prices …shifts the S curve Technology …shifts the S curve # of Sellers …shifts the S curve Expectations …shifts the S curve
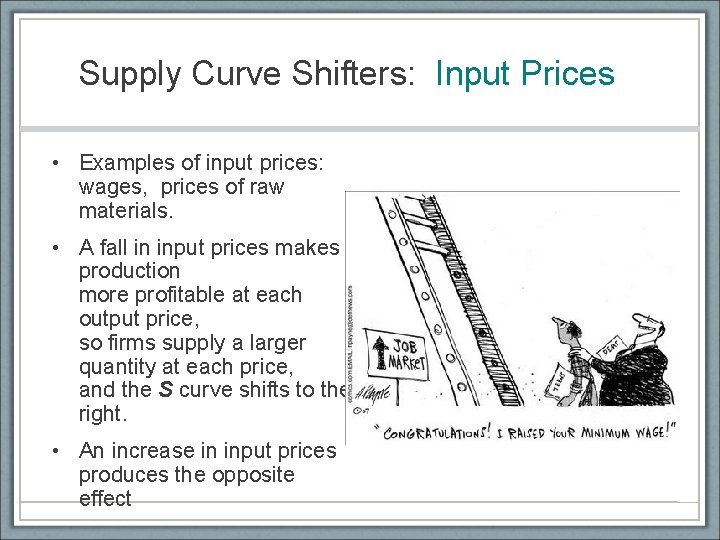
Supply Curve Shifters: Input Prices • Examples of input prices: wages, prices of raw materials. • A fall in input prices makes production more profitable at each output price, so firms supply a larger quantity at each price, and the S curve shifts to the right. • An increase in input prices produces the opposite effect
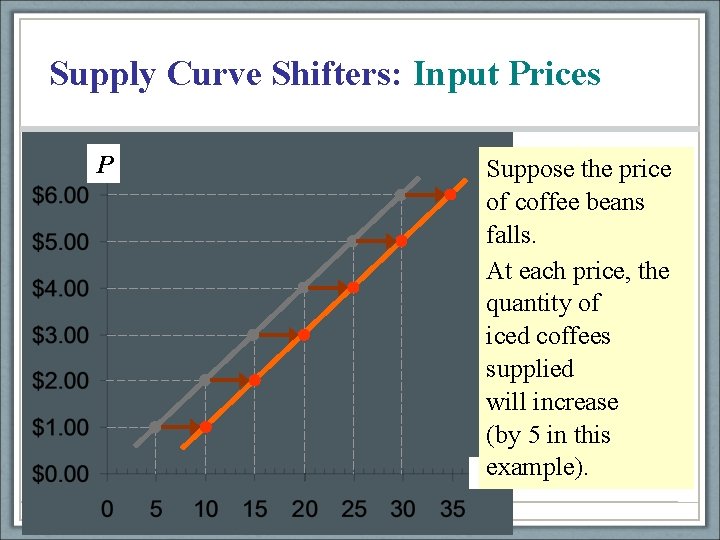
Supply Curve Shifters: Input Prices P Suppose the price of coffee beans falls. At each price, the quantity of iced coffees supplied will increase (by 5 in this Qexample).
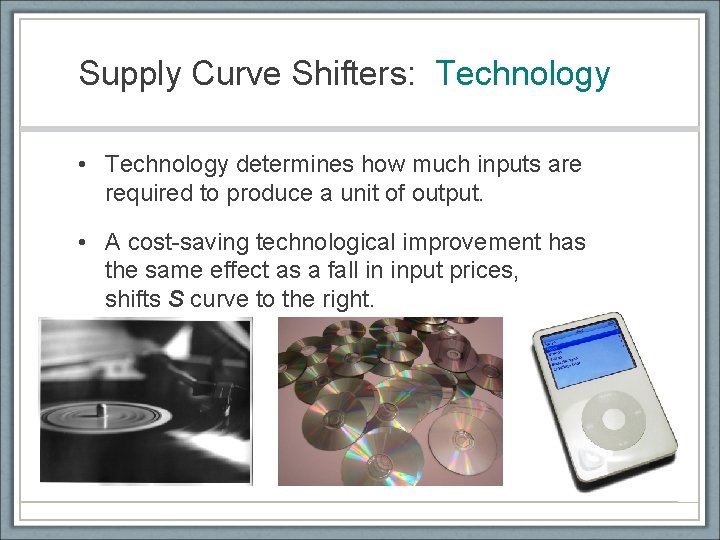
Supply Curve Shifters: Technology • Technology determines how much inputs are required to produce a unit of output. • A cost-saving technological improvement has the same effect as a fall in input prices, shifts S curve to the right.
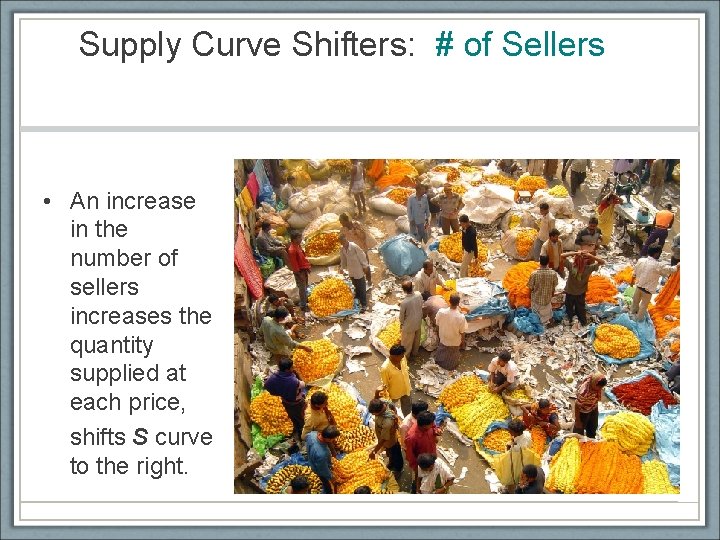
Supply Curve Shifters: # of Sellers • An increase in the number of sellers increases the quantity supplied at each price, shifts S curve to the right.
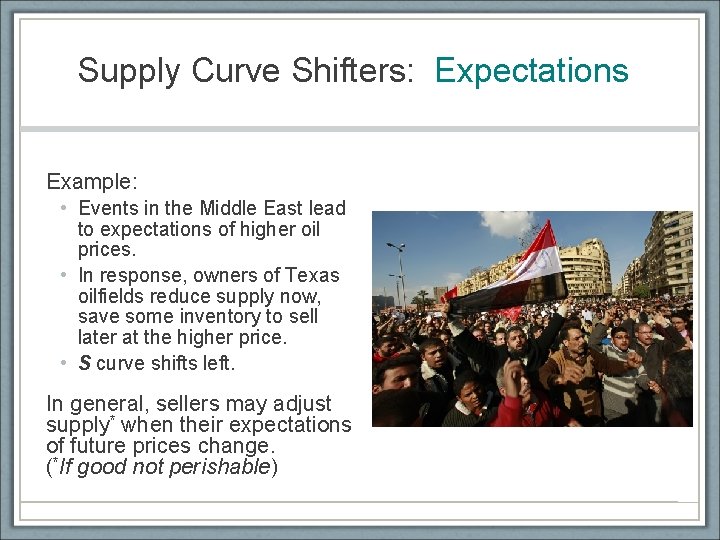
Supply Curve Shifters: Expectations Example: • Events in the Middle East lead to expectations of higher oil prices. • In response, owners of Texas oilfields reduce supply now, save some inventory to sell later at the higher price. • S curve shifts left. In general, sellers may adjust supply* when their expectations of future prices change. (*If good not perishable)
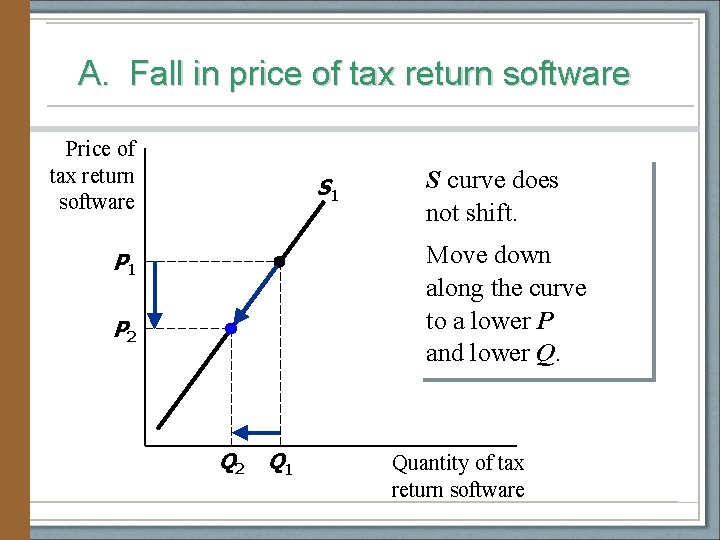
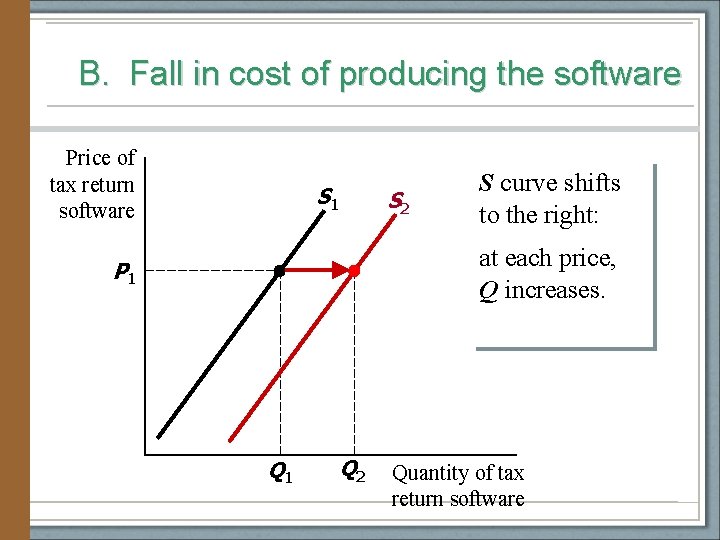
STUDENTS’ TURN: Supply Curve Draw a supply curve for tax return preparation software. What happens to it in each of the following scenarios? A. Retailers cut the price of the software. B. A technological advance allows the software to be produced at lower cost.
A. Fall in price of tax return software Price of tax return software S 1 S curve does not shift. Move down along the curve to a lower P and lower Q. P 1 P 2 Q 1 Quantity of tax return software
B. Fall in cost of producing the software Price of tax return software S 1 S 2 S curve shifts to the right: at each price, Q increases. P 1 Q 2 Quantity of tax return software
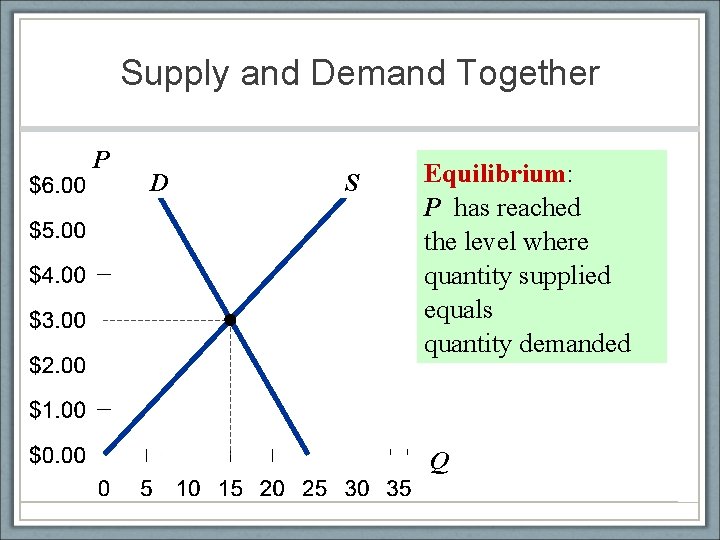
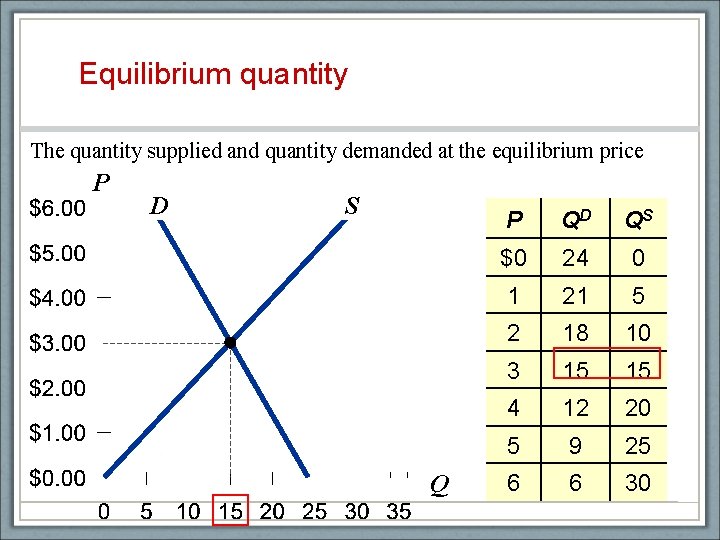
Supply and Demand Together P D S Equilibrium: P has reached the level where quantity supplied equals quantity demanded Q
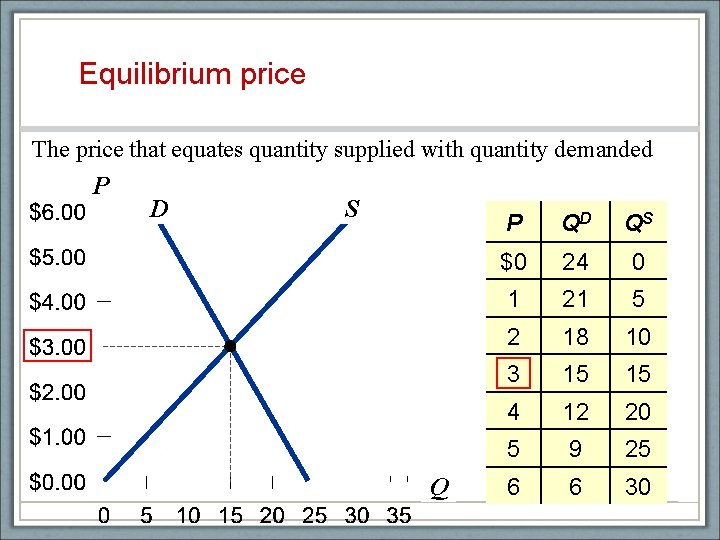
Equilibrium price The price that equates quantity supplied with quantity demanded P D S Q P QD QS $0 24 0 1 21 5 2 18 10 3 15 15 4 12 20 5 9 25 6 6 30
Equilibrium quantity The quantity supplied and quantity demanded at the equilibrium price P D S Q P QD QS $0 24 0 1 21 5 2 18 10 3 15 15 4 12 20 5 9 25 6 6 30
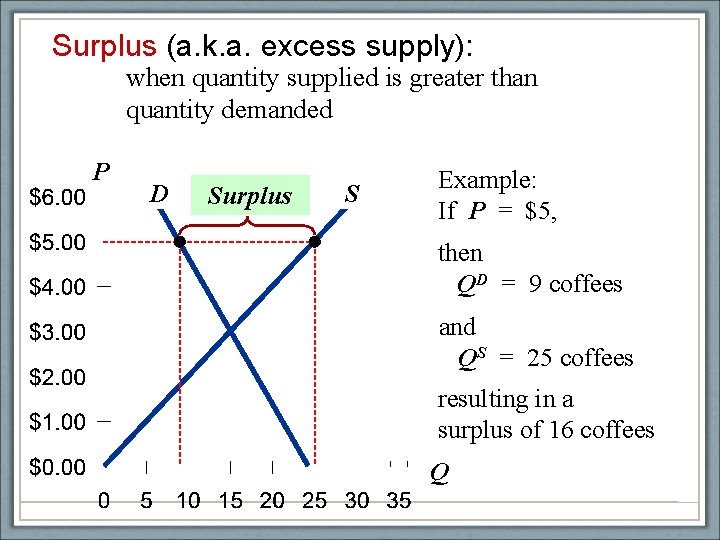
Surplus (a. k. a. excess supply): when quantity supplied is greater than quantity demanded P D Surplus S Example: If P = $5, then QD = 9 coffees and QS = 25 coffees resulting in a surplus of 16 coffees Q
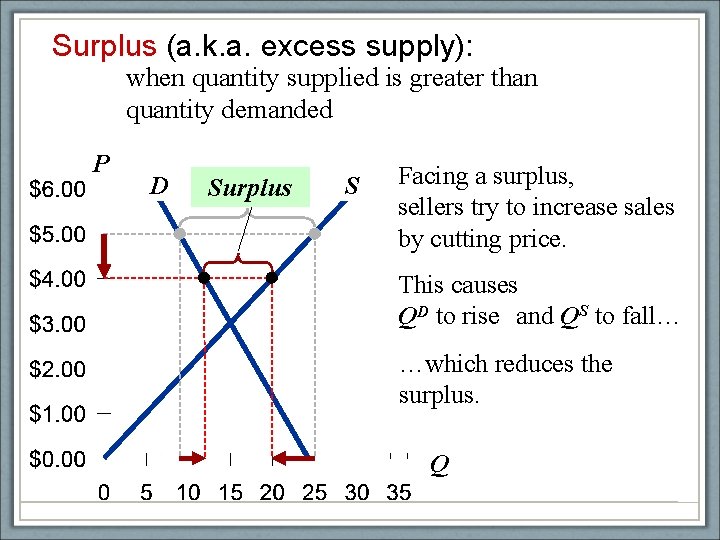
Surplus (a. k. a. excess supply): when quantity supplied is greater than quantity demanded P D Surplus S Facing a surplus, sellers try to increase sales by cutting price. This causes QD to rise and QS to fall… …which reduces the surplus. Q
Equilibrium Quantity and Price
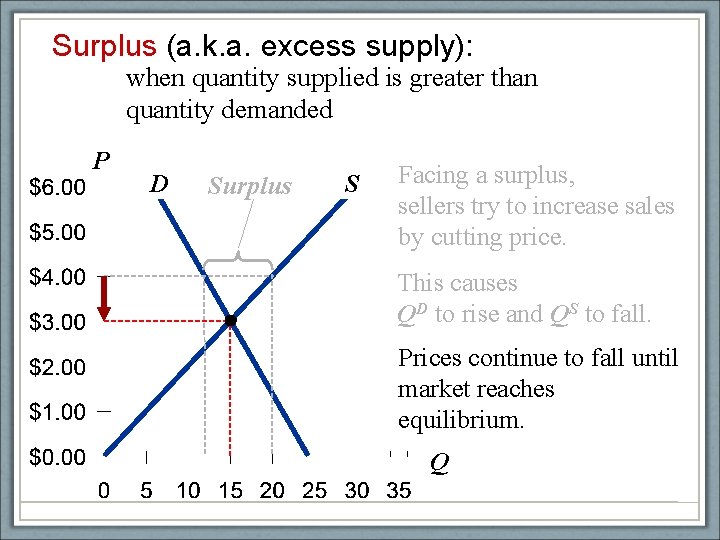
Surplus (a. k. a. excess supply): when quantity supplied is greater than quantity demanded P D Surplus S Facing a surplus, sellers try to increase sales by cutting price. This causes QD to rise and QS to fall. Prices continue to fall until market reaches equilibrium. Q
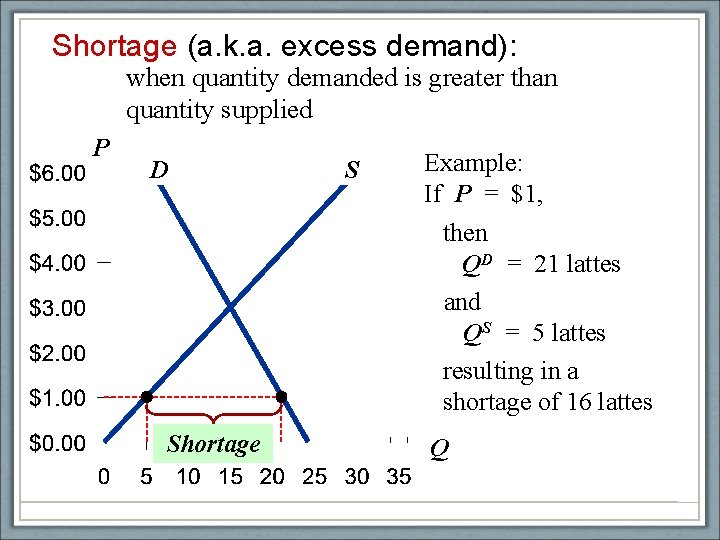
Shortage (a. k. a. excess demand): when quantity demanded is greater than quantity supplied P D Shortage S Example: If P = $1, then QD = 21 lattes and QS = 5 lattes resulting in a shortage of 16 lattes Q
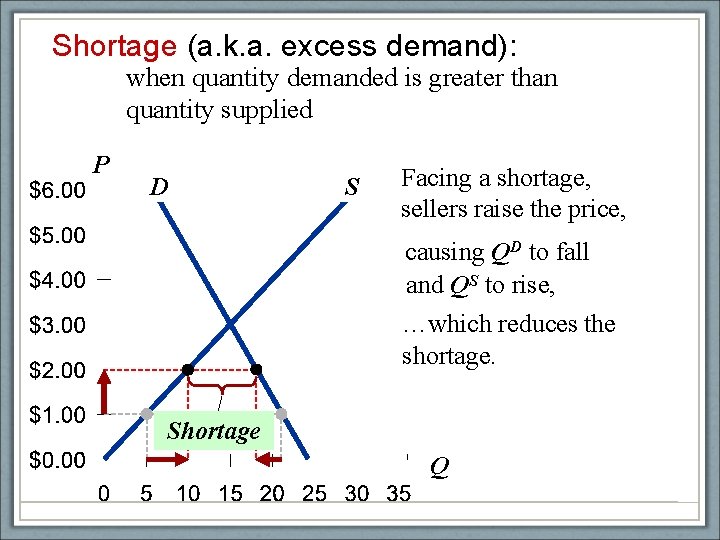
Shortage (a. k. a. excess demand): when quantity demanded is greater than quantity supplied P D S Facing a shortage, sellers raise the price, causing QD to fall and QS to rise, …which reduces the shortage. Shortage Q
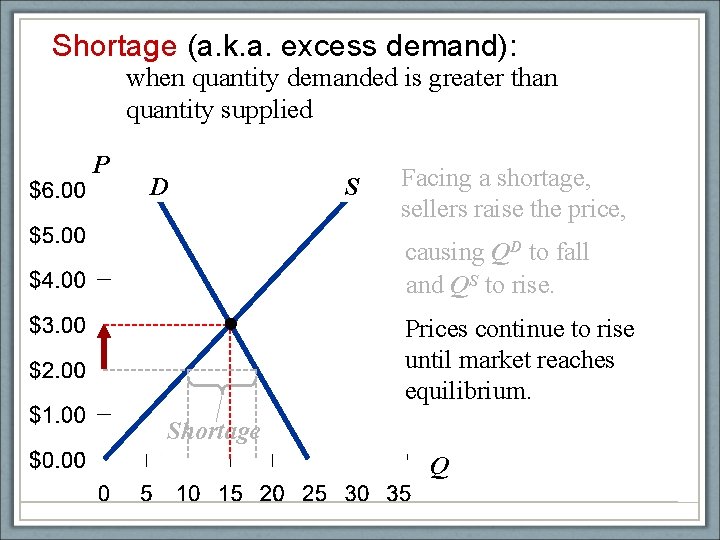
Shortage (a. k. a. excess demand): when quantity demanded is greater than quantity supplied P D S Facing a shortage, sellers raise the price, causing QD to fall and QS to rise. Prices continue to rise until market reaches equilibrium. Shortage Q
Prince Controls • If price is set above market equilibrium --> we have a surplus, or excess supply • If price is set below market equilibrium --> we have a shortage, or excess demand • Price ceiling: legally mandated maximum price • Price floor: legally mandated minimum price