Power and Sample Size Issues in Study Design

- Slides: 85
Power and Sample Size: Issues in Study Design John Mc. Gready Department of Biostatistics, Bloomberg School
Lecture Topics n Re-visit concept of statistical power n Factors influencing power n Sample size determination when comparing two means n Sample size determination when comparing two proportions 2
Section A Power and Its Influences
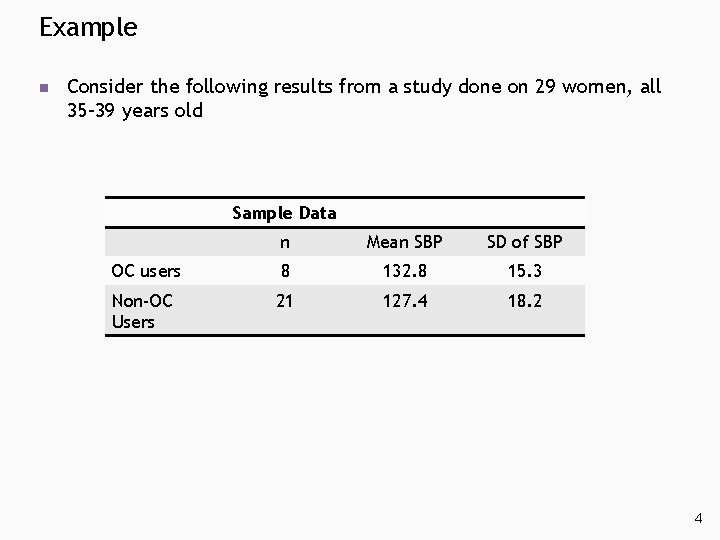
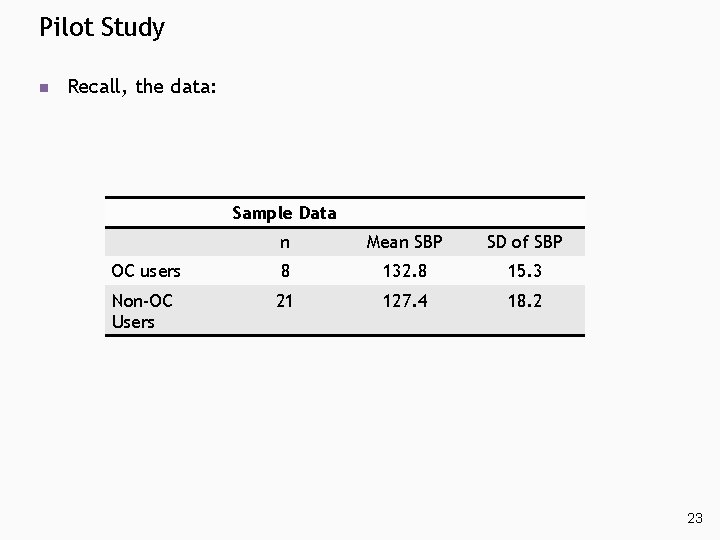
Example n Consider the following results from a study done on 29 women, all 35– 39 years old Sample Data n Mean SBP SD of SBP OC users 8 132. 8 15. 3 Non-OC Users 21 127. 4 18. 2 4
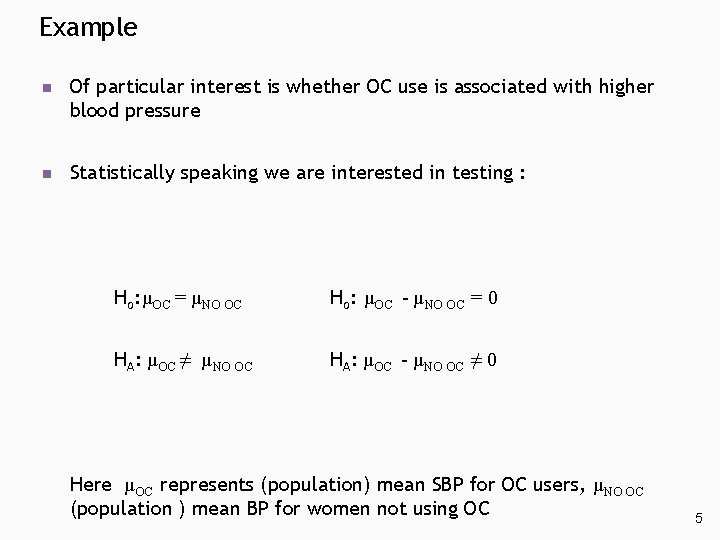
Example n Of particular interest is whether OC use is associated with higher blood pressure n Statistically speaking we are interested in testing : Ho: µOC = µNO OC Ho: µOC - µNO OC = 0 HA: µOC ≠ µNO OC HA: µOC - µNO OC ≠ 0 Here µOC represents (population) mean SBP for OC users, µNO OC (population ) mean BP for women not using OC 5
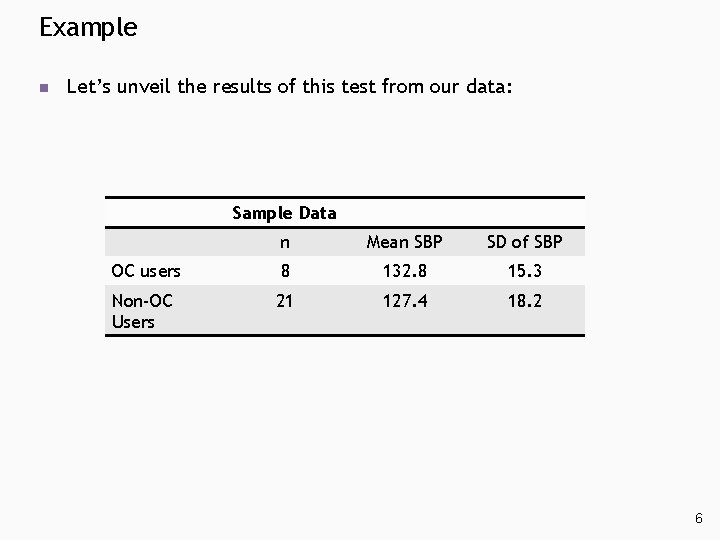
Example n Let’s unveil the results of this test from our data: Sample Data n Mean SBP SD of SBP OC users 8 132. 8 15. 3 Non-OC Users 21 127. 4 18. 2 6
Example n The sample mean difference in blood pressures is 132. 8 – 127. 4 = 5. 4 n This could be considered scientifically significant, however, the result is not statistically significant (or even close to it!) at the =. 05 level n Suppose, as a researcher, you were concerned about detecting a population difference of this magnitude if it truly existed n This particular study of 29 women has low power to detect a difference of such magnitude 7
Power n Recall, from lecture four of SR 1: D E C I S I O N TRUTH Ho Reject Ho HA Type I Error Power alpha-level 1 -beta Not Type II Error Reject Ho beta 8
Power n Power is a measure of “doing the right thing” when HA is true! n Higher power is better (the closer the power is to 1. 0 or 100%) n We can calculate power for a given study if we specify a specific HA n This OC/Blood pressure study has power of. 13 to detect a difference in blood pressure of 5. 4 or more, if this difference truly exists in the population of women 35 -39 years old! n When power is this low, it is difficult to determine whethere is no statistical difference in population means or we just could not detect it 9
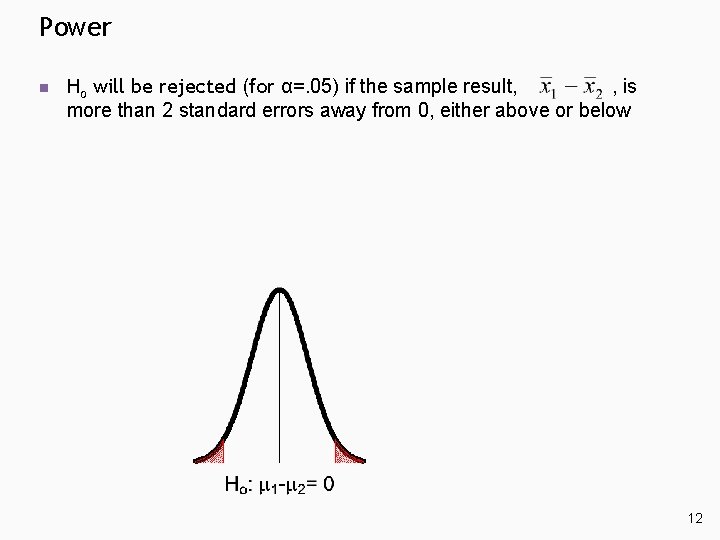
Power n Recall, the sampling behavior of is normally distributed (large samples) with this sampling distributed centered at true mean difference. If Ho truth, then curve is centered at 0 10
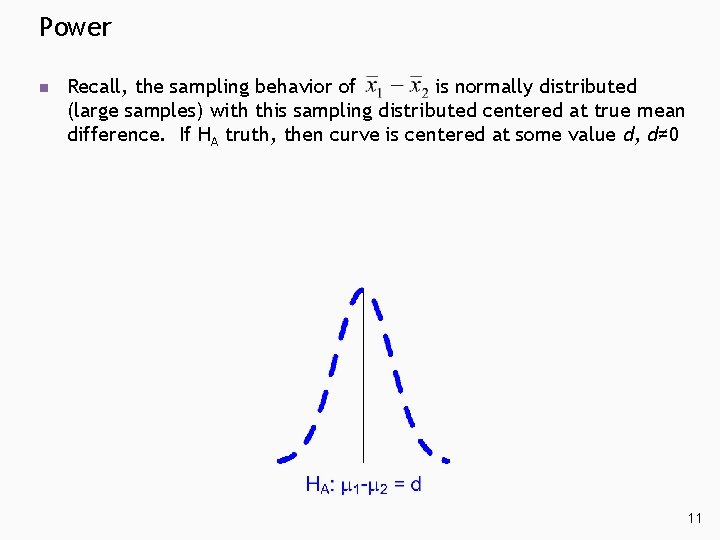
Power n Recall, the sampling behavior of is normally distributed (large samples) with this sampling distributed centered at true mean difference. If HA truth, then curve is centered at some value d, d≠ 0 11
Power n Ho will be rejected (for α=. 05) if the sample result, , is more than 2 standard errors away from 0, either above or below 12
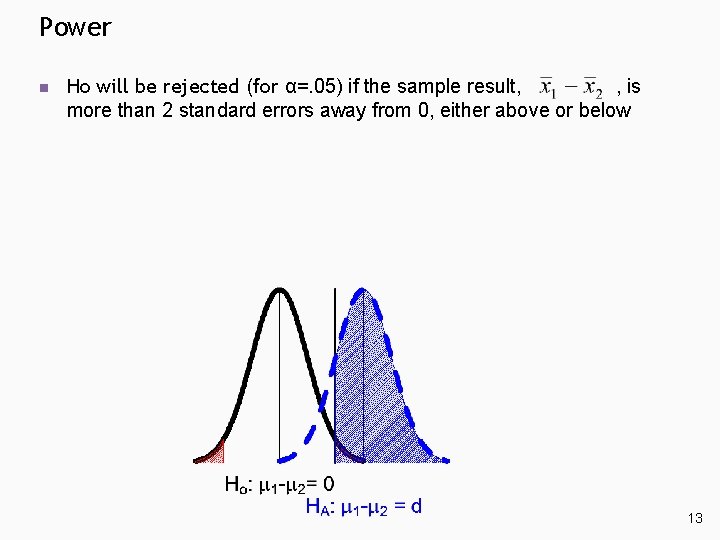
Power n Ho will be rejected (for α=. 05) if the sample result, , is more than 2 standard errors away from 0, either above or below 13
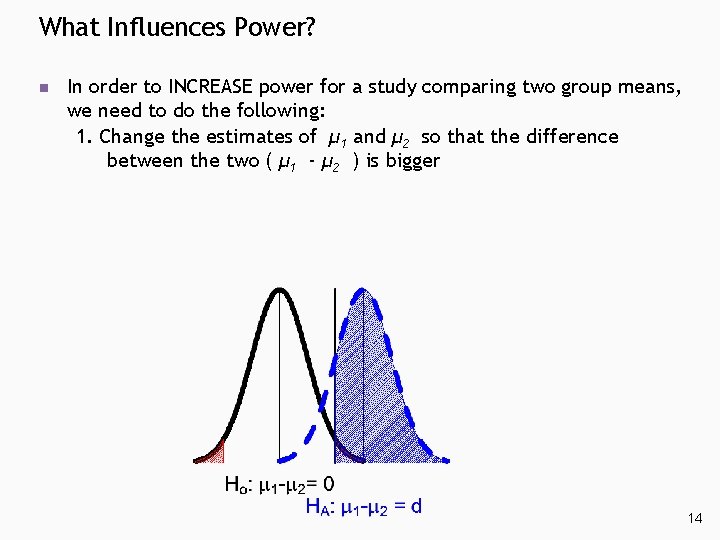
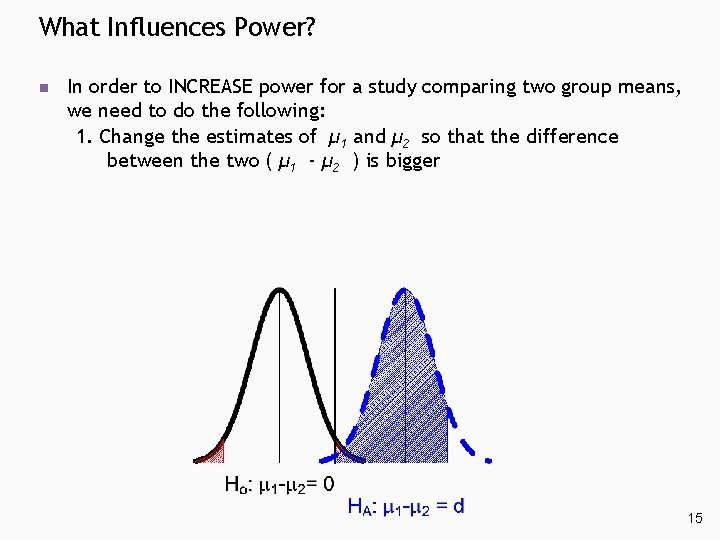
What Influences Power? n In order to INCREASE power for a study comparing two group means, we need to do the following: 1. Change the estimates of µ 1 and µ 2 so that the difference between the two ( µ 1 - µ 2 ) is bigger 14
What Influences Power? n In order to INCREASE power for a study comparing two group means, we need to do the following: 1. Change the estimates of µ 1 and µ 2 so that the difference between the two ( µ 1 - µ 2 ) is bigger 15
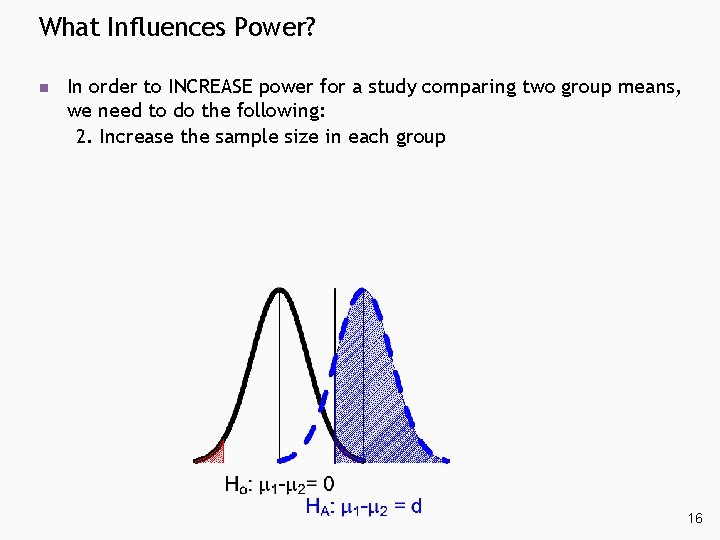
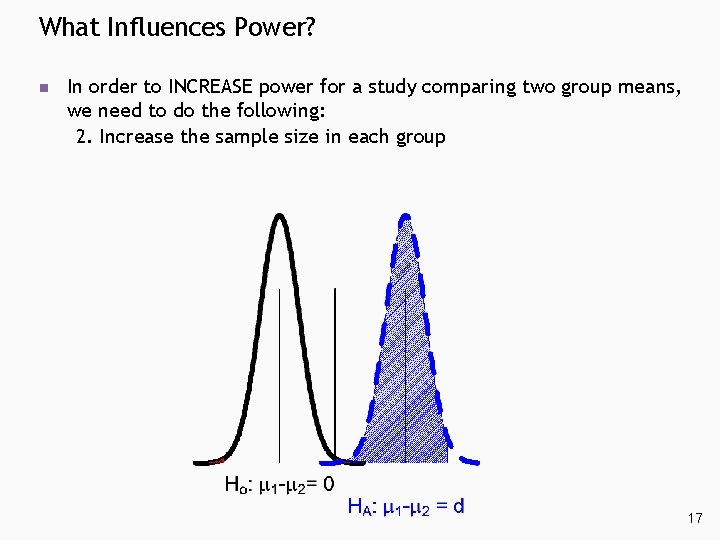
What Influences Power? n In order to INCREASE power for a study comparing two group means, we need to do the following: 2. Increase the sample size in each group 16
What Influences Power? n In order to INCREASE power for a study comparing two group means, we need to do the following: 2. Increase the sample size in each group 17
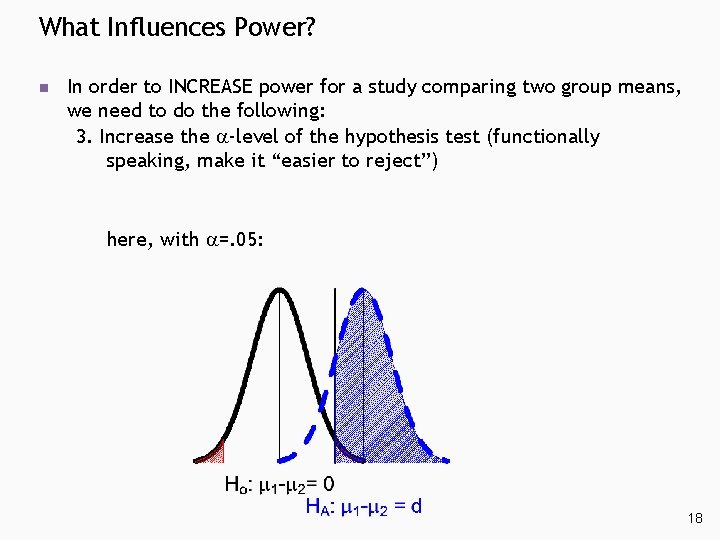
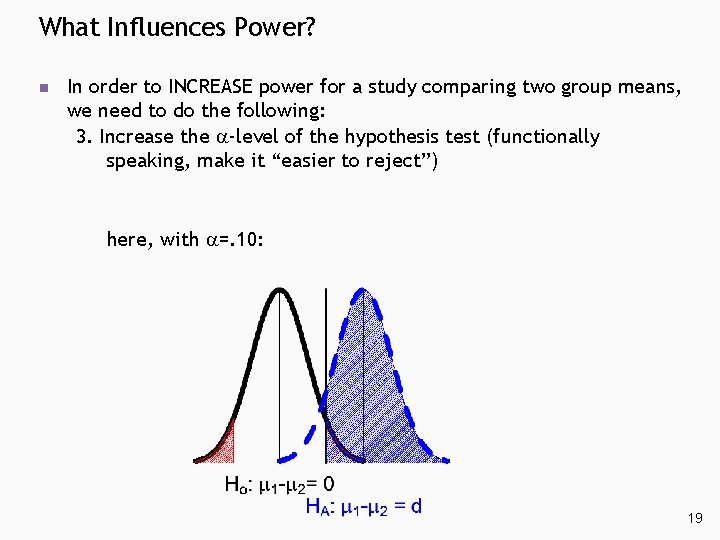
What Influences Power? n In order to INCREASE power for a study comparing two group means, we need to do the following: 3. Increase the -level of the hypothesis test (functionally speaking, make it “easier to reject”) here, with =. 05: 18
What Influences Power? n In order to INCREASE power for a study comparing two group means, we need to do the following: 3. Increase the -level of the hypothesis test (functionally speaking, make it “easier to reject”) here, with =. 10: 19
Power and Studies n Power can be computed after a study is completed Can only be computed for specific HA’s: i. e. this study had XX% to detect a difference in population means of YY or greater. Sometimes presented as an “excuse” for non statistically significant finding: “the lack of a statically significant association between A and B could be because of low power (< 15%) to detect a mean difference of YY or greater between. . ” Can also be presented to corroborate with a non statistically significant result n Many times, in study design, a required sample size is computed to actually achieve a certain preset power level to find a “Clinically/scientifically” minimal important difference in means In next section we will show to do this using Stata “Industry standard” for power: 80% (or greater) 20
Section B Sample Size Calculations when Comparing Group Means
Example n Blood pressure and oral contraceptives Suppose we used data from the example in Section A to motivate the following question: Is oral contraceptive use associated with higher blood pressure among individuals between the ages of 35– 39? 22
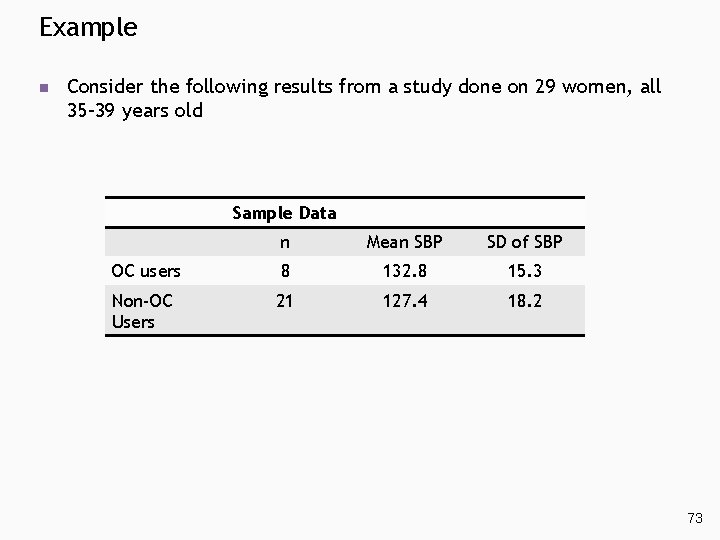
Pilot Study n Recall, the data: Sample Data n Mean SBP SD of SBP OC users 8 132. 8 15. 3 Non-OC Users 21 127. 4 18. 2 23
Pilot Study n We think this research has a potentially interesting association n We want to do a bigger study We want this larger study to have ample power to detect this association, should it really exist in the population n What we want to do is determine sample sizes needed to detect about a 5 mm increase in blood pressure in O. C. users with 80% power at significance level α =. 05 Using pilot data, we estimate that the standard deviations are 15. 3 and 18. 2 in O. C. and non-O. C. users respectively 24
Pilot Study n Here we have a desired power in mind and want to find the sample sizes necessary to achieve a power of 80% to detect a population difference in blood pressure of five or more mm. Hg between the two groups 25
Pilot Study n We can find the necessary sample size(s) of this study if we specify. α-level of test (. 05) Specific values for μ 1 and μ 2 (specific HA) and hence d= μ 1 -μ 2: usually represents the minimum scientific difference of interest) Estimates of σ1 and σ2 The desired power(. 80) 26
Pilot Study n How can we specify d= μ 1 -μ 2 and estimate population SDs? Researcher knowledge—experience makes for good educated guesses Make use of pilot study data! 27
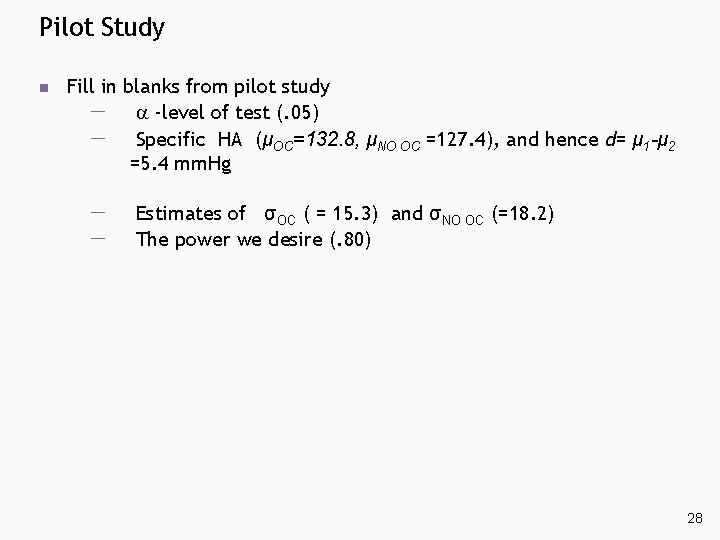
Pilot Study n Fill in blanks from pilot study -level of test (. 05) Specific HA (μOC=132. 8, μNO OC =127. 4), and hence d= μ 1 -μ 2 =5. 4 mm. Hg Estimates of σOC ( = 15. 3) and σNO OC (=18. 2) The power we desire (. 80) 28
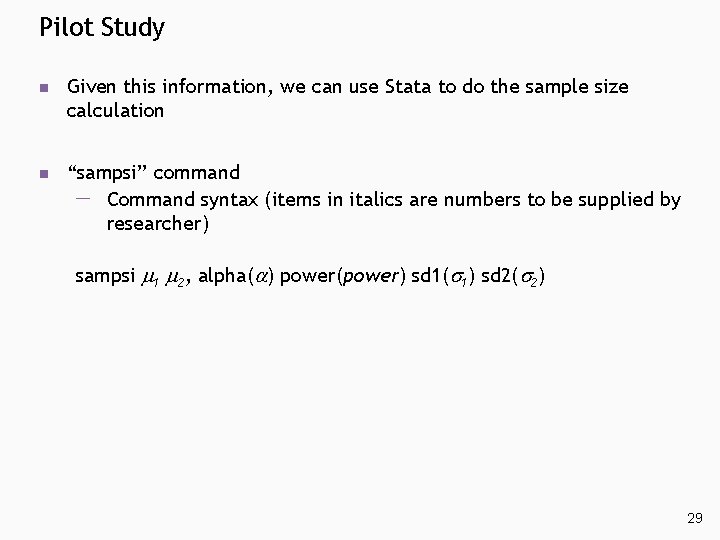
Pilot Study n Given this information, we can use Stata to do the sample size calculation n “sampsi” command Command syntax (items in italics are numbers to be supplied by researcher) sampsi 1 2, alpha( ) power(power) sd 1( 1) sd 2( 2) 29
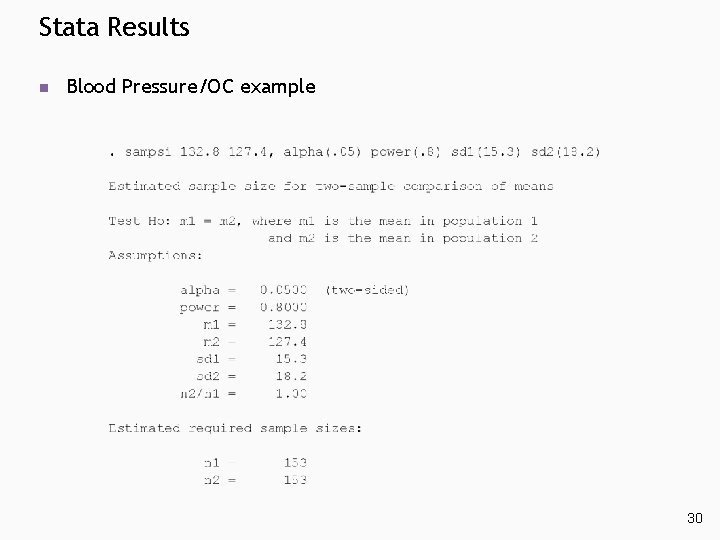
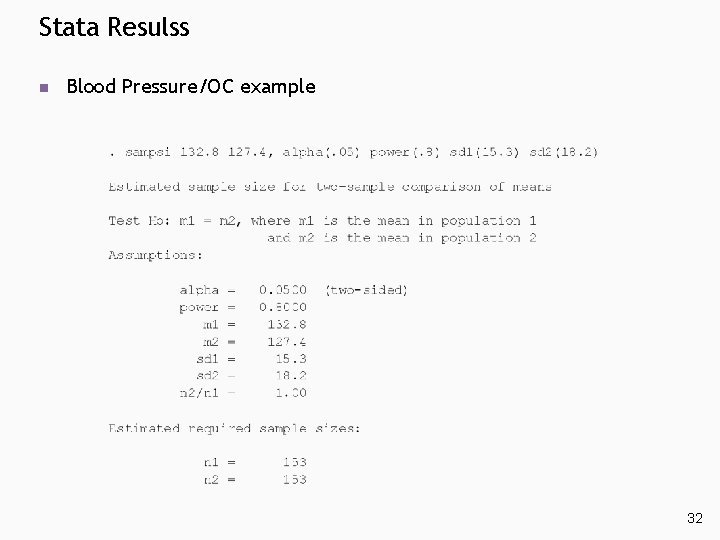
Stata Results n Blood Pressure/OC example 30
Pilot Study/Stata Results n Our results from Stata suggest that in order to detect a difference in B. P. of 5. 4 units (if it really exists in the population) with high (80%) certainty, we would need to enroll 153 O. C. users and 153 non-users n This assumed that we wanted equal numbers of women in each group! 31
Stata Resulss n Blood Pressure/OC example 32
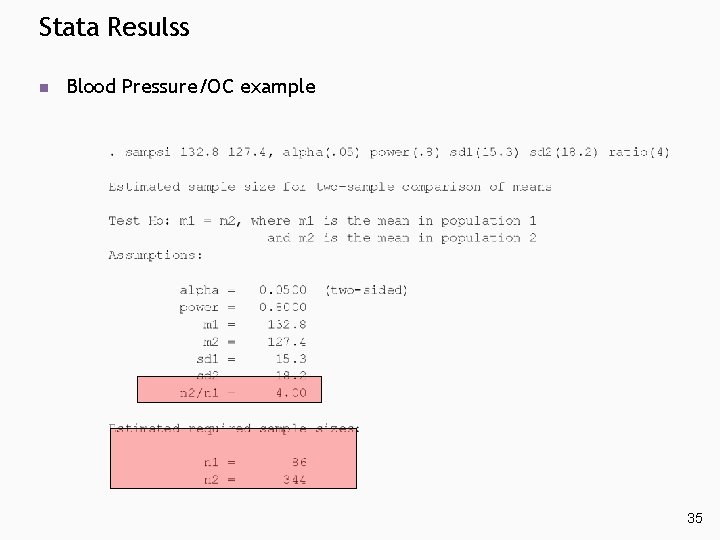
Pilot Study/Stata Results n Suppose we estimate that the prevalence of O. C. use amongst women 35– 39 years of age is 20% We wanted this reflected in our group sizes n If O. C. users are 20% of the population, non-OC users are 80% There are four times as many non-users as there are users (4: 1 ratio) 33
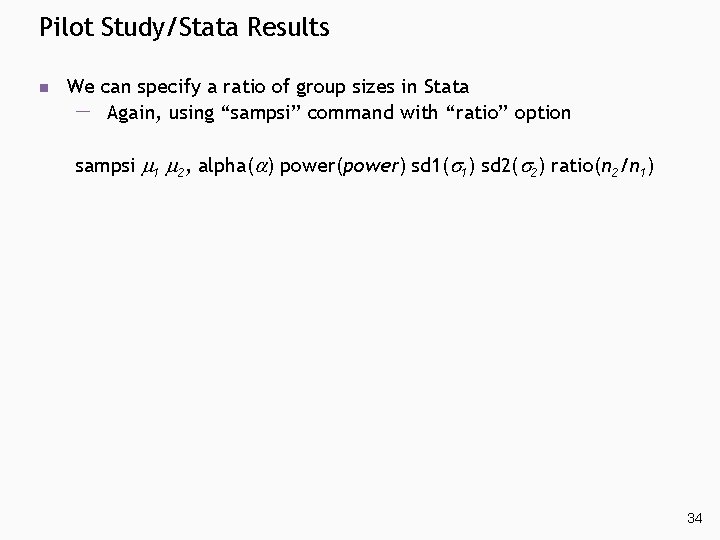
Pilot Study/Stata Results n We can specify a ratio of group sizes in Stata Again, using “sampsi” command with “ratio” option sampsi 1 2, alpha( ) power(power) sd 1( 1) sd 2( 2) ratio(n 2/n 1) 34
Stata Resulss n Blood Pressure/OC example 35
Section C Sample Size Determination for Comparing Two Proportions
Power for Comparing Two Proportions n Same ideas as with comparing means 37
Pilot Study n We can find the necessary sample size(s) of this study if we specify. α-level of test Specific values for p 1 and p 2 (specific HA) and hence d= p 1 -p 2: usually represents the minimum scientific difference of interest) The desired power 38
Pilot Study n Given this information, we can use Stata to do the sample size calculation n “sampsi” command Command syntax (items in italics are numbers to be supplied by researcher) sampsi p 1 p 2, alpha( ) power(power) 39
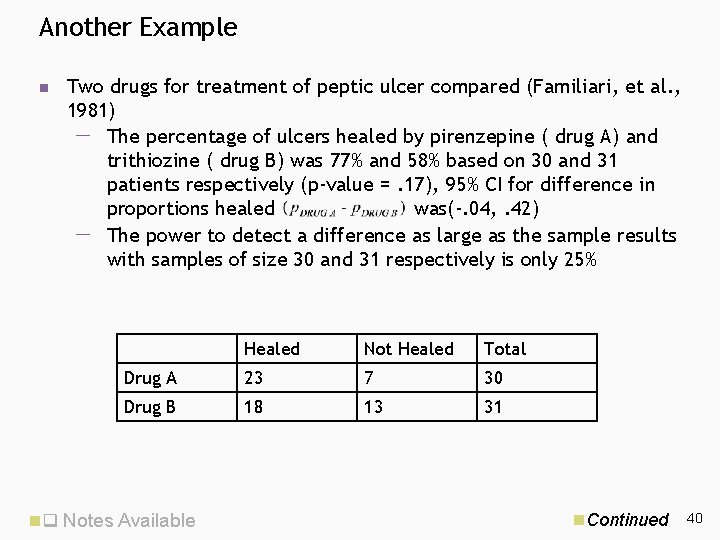
Another Example n Two drugs for treatment of peptic ulcer compared (Familiari, et al. , 1981) The percentage of ulcers healed by pirenzepine ( drug A) and trithiozine ( drug B) was 77% and 58% based on 30 and 31 patients respectively (p-value =. 17), 95% CI for difference in proportions healed was(-. 04, . 42) The power to detect a difference as large as the sample results with samples of size 30 and 31 respectively is only 25% Healed Not Healed Total Drug A 23 7 30 Drug B 18 13 31 n Notes Available n. Continued 40
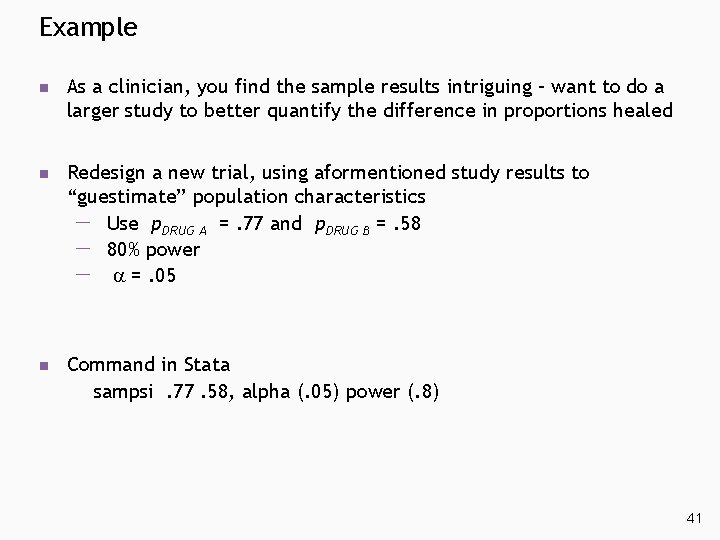
Example n As a clinician, you find the sample results intriguing – want to do a larger study to better quantify the difference in proportions healed n Redesign a new trial, using aformentioned study results to “guestimate” population characteristics Use p. DRUG A =. 77 and p. DRUG B =. 58 80% power =. 05 n Command in Stata sampsi. 77. 58, alpha (. 05) power (. 8) 41
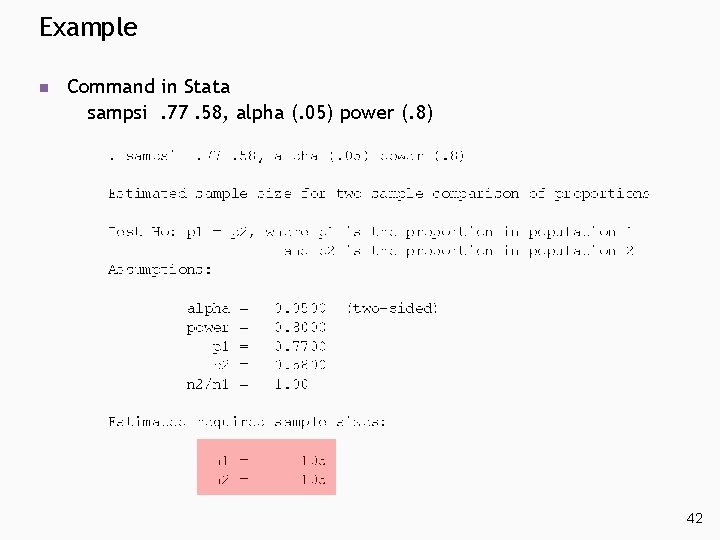
Example n Command in Stata sampsi. 77. 58, alpha (. 05) power (. 8) 42
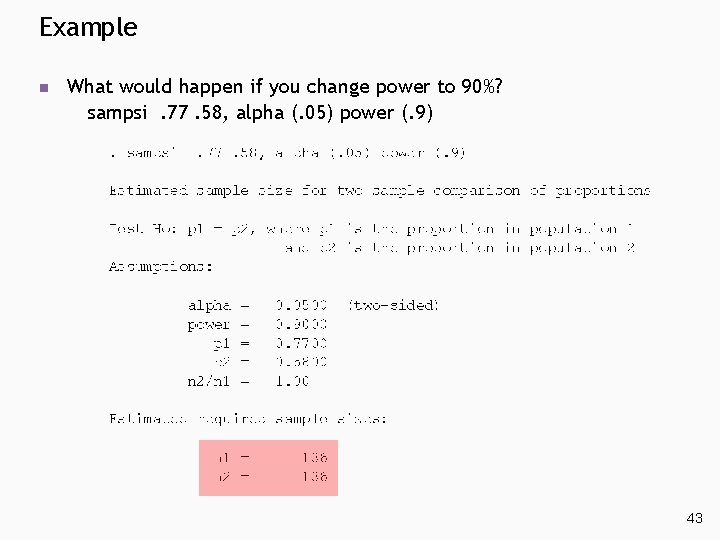
Example n What would happen if you change power to 90%? sampsi. 77. 58, alpha (. 05) power (. 9) 43
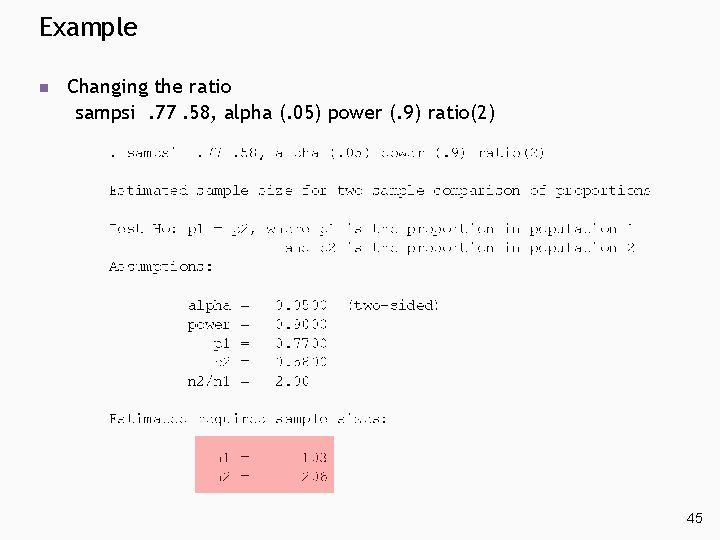
Example n Suppose you wanted two times as many people on trithiozone (“Drug B”) as compared to pirenzephine (“Drug A”) Here, the ratio of sample size for Group 2 to Group 1 is 2. 0 n Can use “ratio” option in “sampsi” command 44
Example n Changing the ratio sampsi. 77. 58, alpha (. 05) power (. 9) ratio(2) 45
Sample Size for Comparing Two Proportions n A randomized trial is being designed to determine if vitamin A supplementation can reduce the risk of breast cancer The study will follow women between the ages of 45– 65 for one year Women were randomized between vitamin A and placebo n What sample sizes are recommended? 46
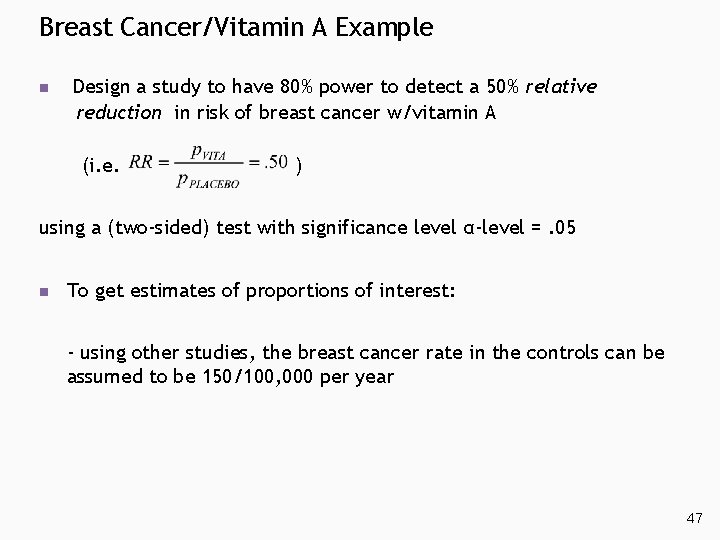
Breast Cancer/Vitamin A Example n Design a study to have 80% power to detect a 50% relative reduction in risk of breast cancer w/vitamin A (i. e. ) using a (two-sided) test with significance level α-level =. 05 n To get estimates of proportions of interest: - using other studies, the breast cancer rate in the controls can be assumed to be 150/100, 000 per year 47
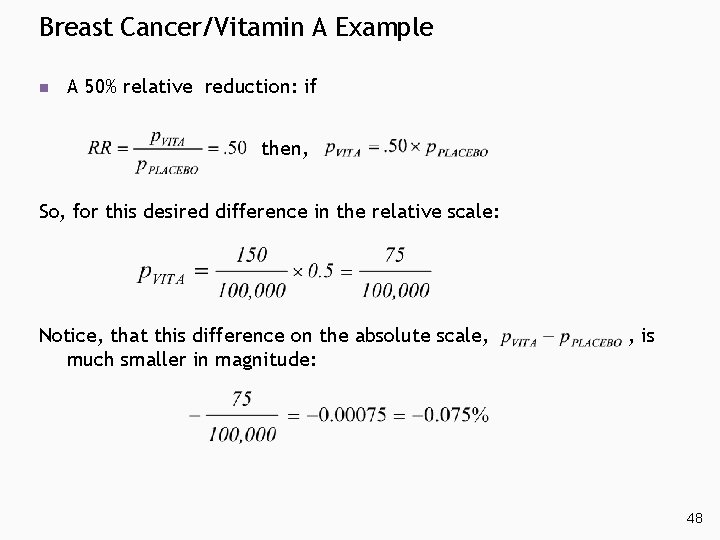
Breast Cancer/Vitamin A Example n A 50% relative reduction: if then, So, for this desired difference in the relative scale: Notice, that this difference on the absolute scale, much smaller in magnitude: , is 48
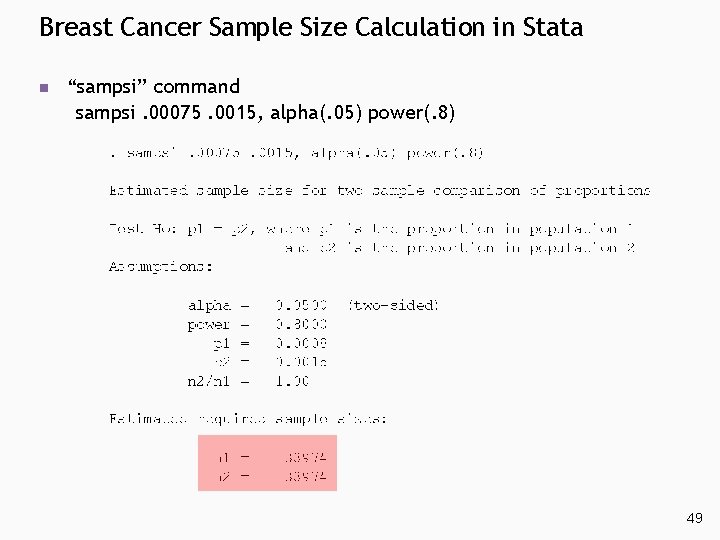
Breast Cancer Sample Size Calculation in Stata n “sampsi” command sampsi. 00075. 0015, alpha(. 05) power(. 8) 49
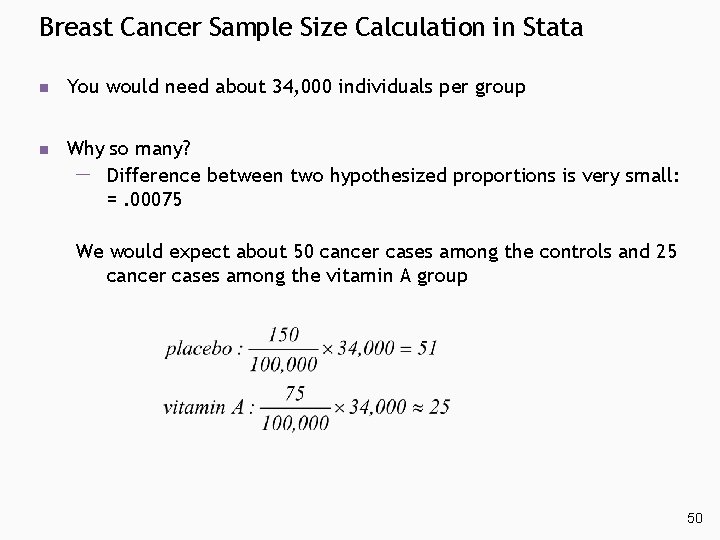
Breast Cancer Sample Size Calculation in Stata n You would need about 34, 000 individuals per group n Why so many? Difference between two hypothesized proportions is very small: =. 00075 We would expect about 50 cancer cases among the controls and 25 cancer cases among the vitamin A group 50
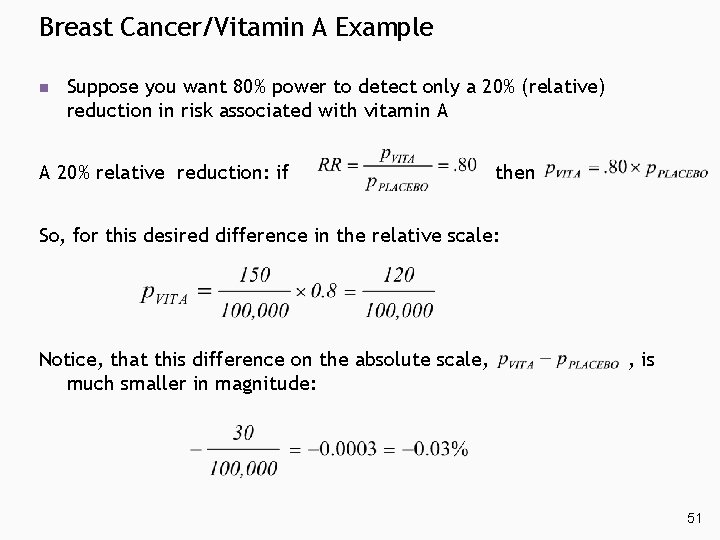
Breast Cancer/Vitamin A Example n Suppose you want 80% power to detect only a 20% (relative) reduction in risk associated with vitamin A A 20% relative reduction: if then So, for this desired difference in the relative scale: Notice, that this difference on the absolute scale, much smaller in magnitude: , is 51
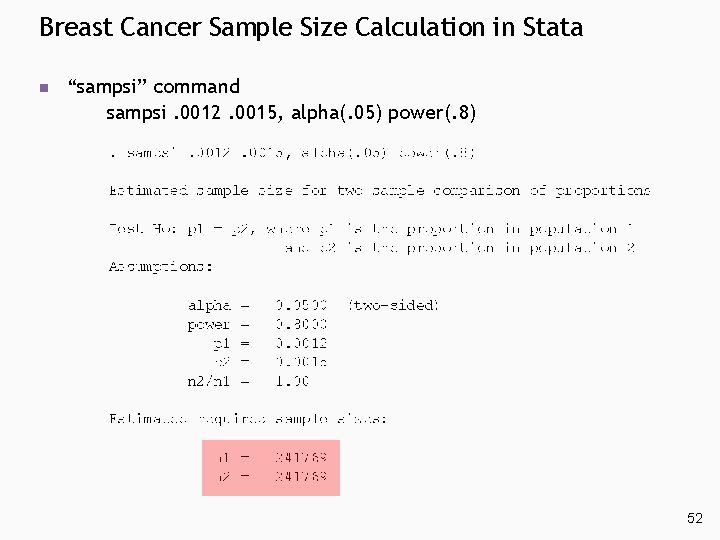
Breast Cancer Sample Size Calculation in Stata n “sampsi” command sampsi. 0012. 0015, alpha(. 05) power(. 8) 52
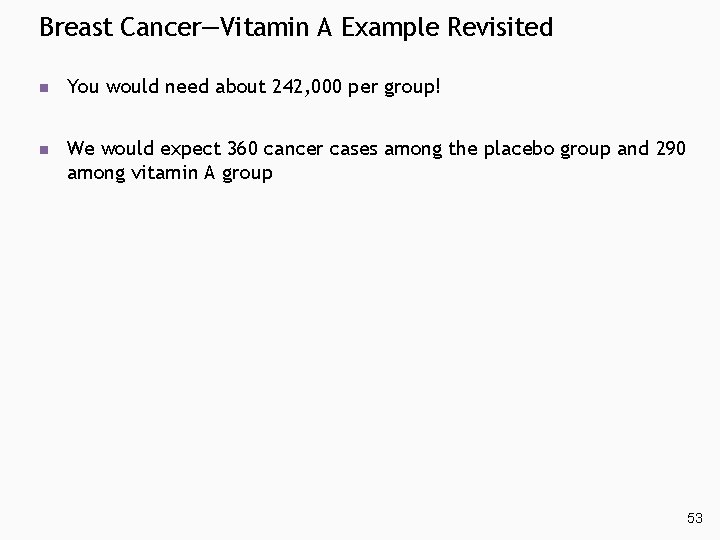
Breast Cancer—Vitamin A Example Revisited n You would need about 242, 000 per group! n We would expect 360 cancer cases among the placebo group and 290 among vitamin A group 53
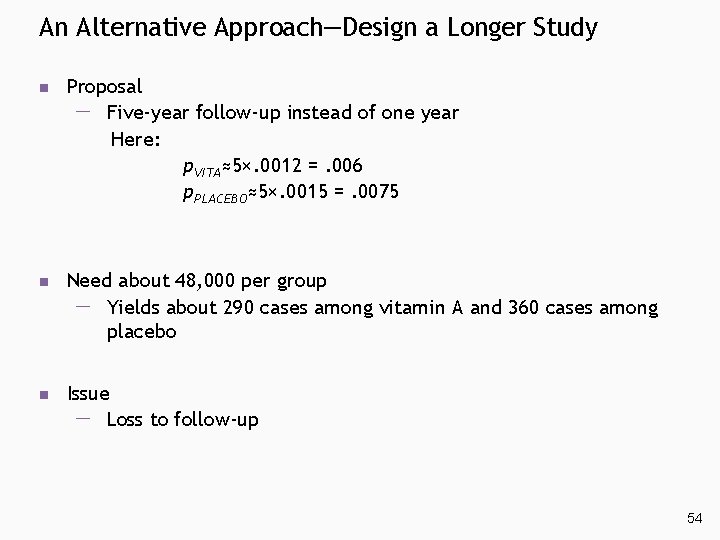
An Alternative Approach—Design a Longer Study n Proposal Five-year follow-up instead of one year Here: p. VITA≈5×. 0012 =. 006 p. PLACEBO≈5×. 0015 =. 0075 n Need about 48, 000 per group Yields about 290 cases among vitamin A and 360 cases among placebo n Issue Loss to follow-up 54
Section D Sample Size and Study Design Principles: A Brief Summary
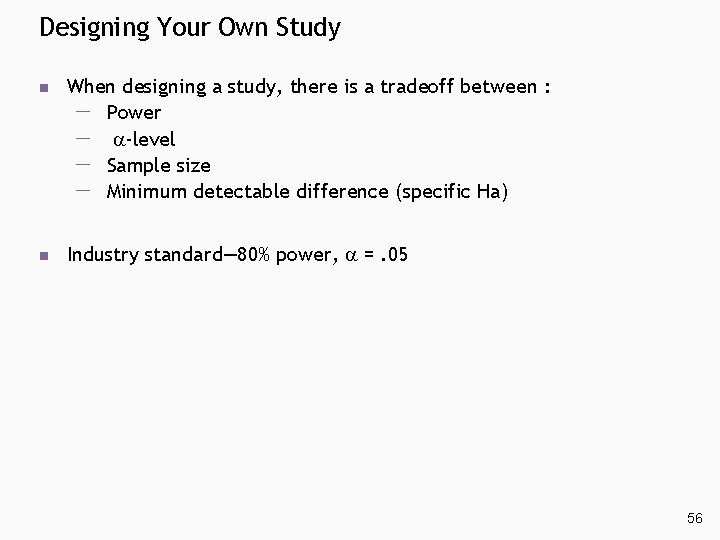
Designing Your Own Study n When designing a study, there is a tradeoff between : Power -level Sample size Minimum detectable difference (specific Ha) n Industry standard— 80% power, =. 05 56
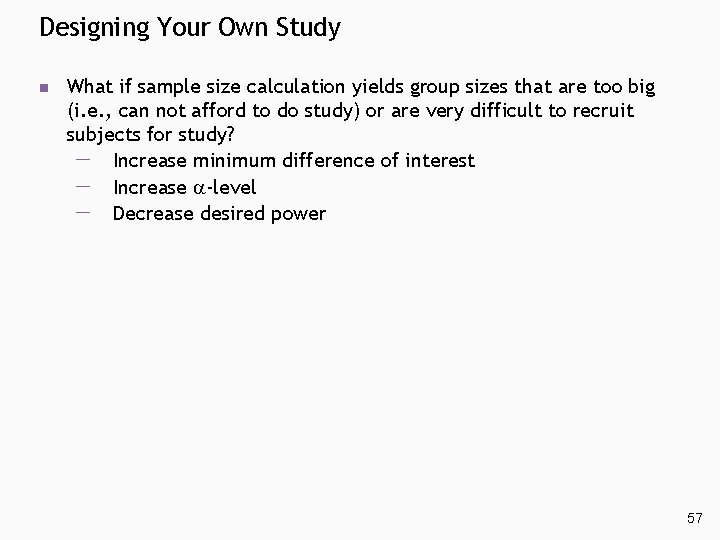
Designing Your Own Study n What if sample size calculation yields group sizes that are too big (i. e. , can not afford to do study) or are very difficult to recruit subjects for study? Increase minimum difference of interest Increase -level Decrease desired power 57
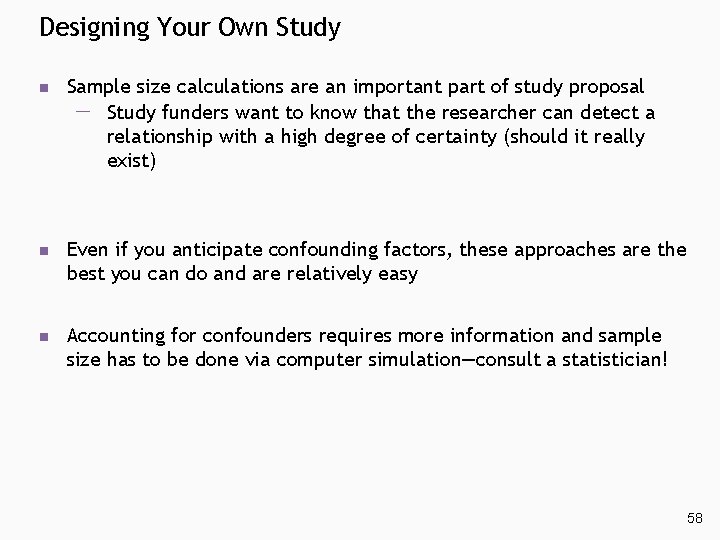
Designing Your Own Study n Sample size calculations are an important part of study proposal Study funders want to know that the researcher can detect a relationship with a high degree of certainty (should it really exist) n Even if you anticipate confounding factors, these approaches are the best you can do and are relatively easy n Accounting for confounders requires more information and sample size has to be done via computer simulation—consult a statistician! 58
Designing Your Own Study n When would you calculate the power of a study? Secondary data analysis Data has already been collected, sample size is fixed Pilot Study—to illustrate that low power may be a contributing factor to non-significant results and that a larger study may be appropriate 59
Designing Your Own Study n What is this specific alternative hypothesis? Power or sample size can only be calculated for a specific alternative hypothesis When comparing two groups this means estimating the true population means (proportions) for each group 60
Designing Your Own Study n What is this specific alternative hypothesis? Therefore specifying a difference between the two groups This difference is frequently called minimum detectable difference or effect size, referring to the minimum detectable difference with scientific interest 61
Designing Your Own Study n Where does this specific alternative hypothesis come from? Hopefully, not the statistician! As this is generally a quantity of scientific interest, it is best estimated by a knowledgeable researcher or pilot study data This is perhaps the most difficult component of sample size calculations, as there is no magic rule or “industry standard” 62
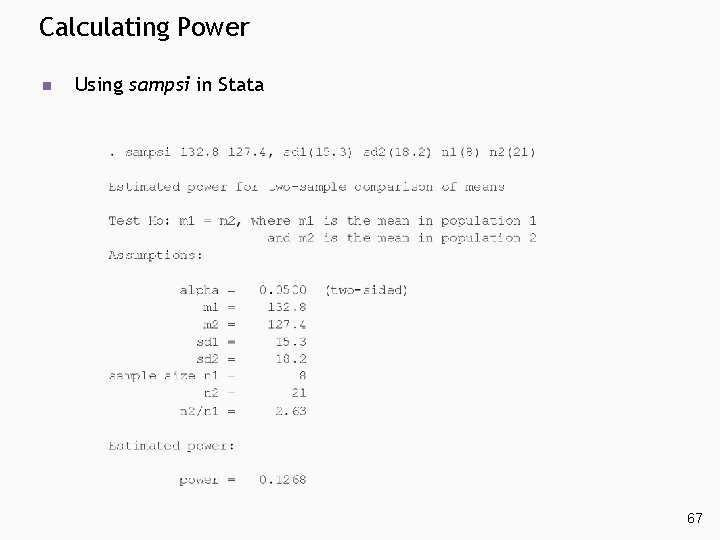
FYI—Using Stata to Compute Power n I promised you in part A of this lecture that I would eventually show you how to compute the power to detect difference in a study that has already been conducted n The “sampsi” command is still the command for this—we just need to feed it slightly different information for it to compute power 63
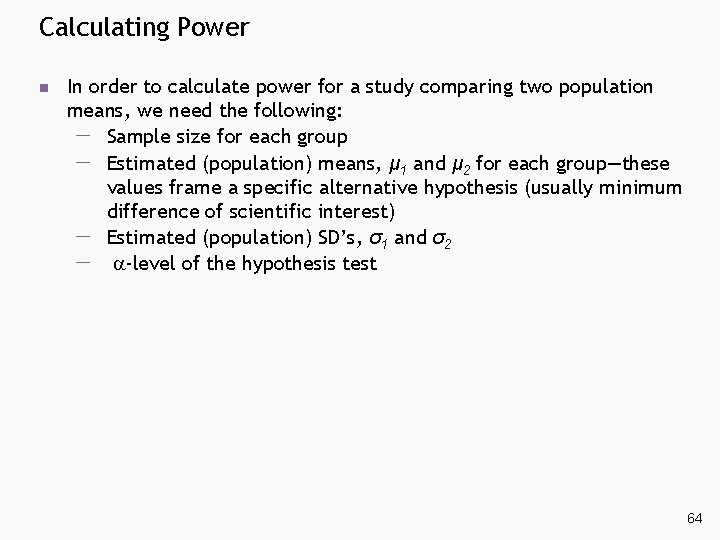
Calculating Power n In order to calculate power for a study comparing two population means, we need the following: Sample size for each group Estimated (population) means, μ 1 and μ 2 for each group—these values frame a specific alternative hypothesis (usually minimum difference of scientific interest) Estimated (population) SD’s, σ1 and σ2 -level of the hypothesis test 64
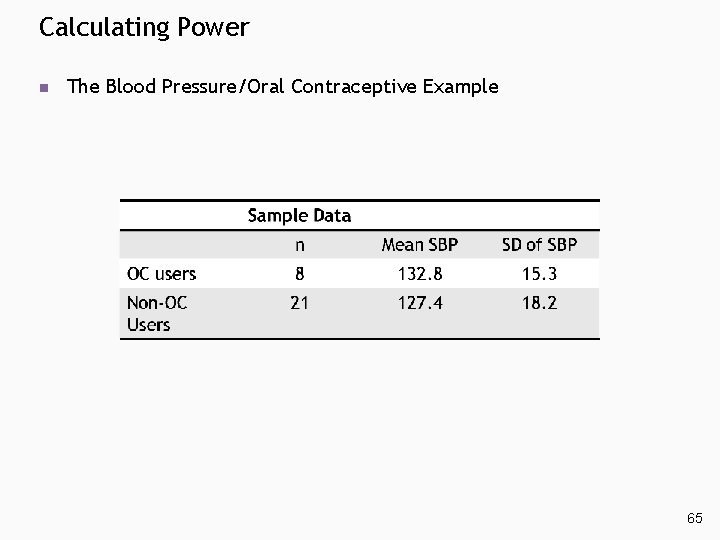
Calculating Power n The Blood Pressure/Oral Contraceptive Example 65
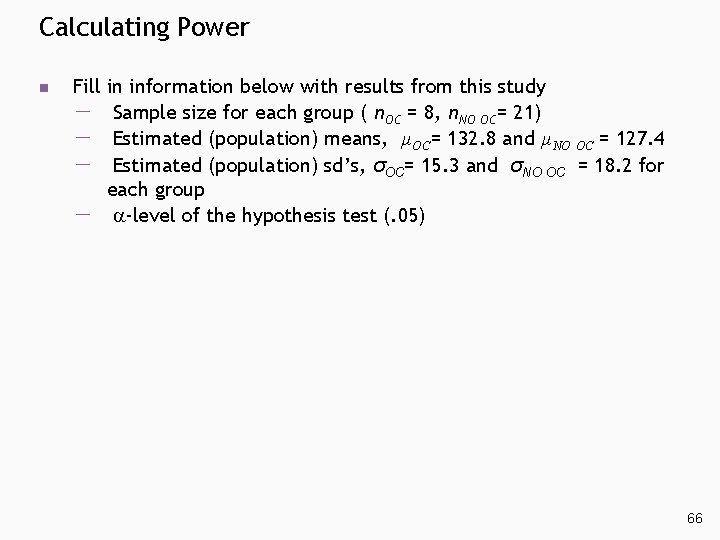
Calculating Power n Fill in information below with results from this study Sample size for each group ( n. OC = 8, n. NO OC= 21) Estimated (population) means, µOC= 132. 8 and µNO OC = 127. 4 Estimated (population) sd’s, σOC= 15. 3 and σNO OC = 18. 2 for each group -level of the hypothesis test (. 05) 66
Calculating Power n Using sampsi in Stata 67
Calculating Power n In order to calculate power for a study comparing two population proportions, we need : Sample size for each group Estimated (population) proportions, p 1 and p 2 for each group : these values frame a specific alternative hypothesis (it usually is the minimum difference of scientific interest) -level of the hypothesis test 68
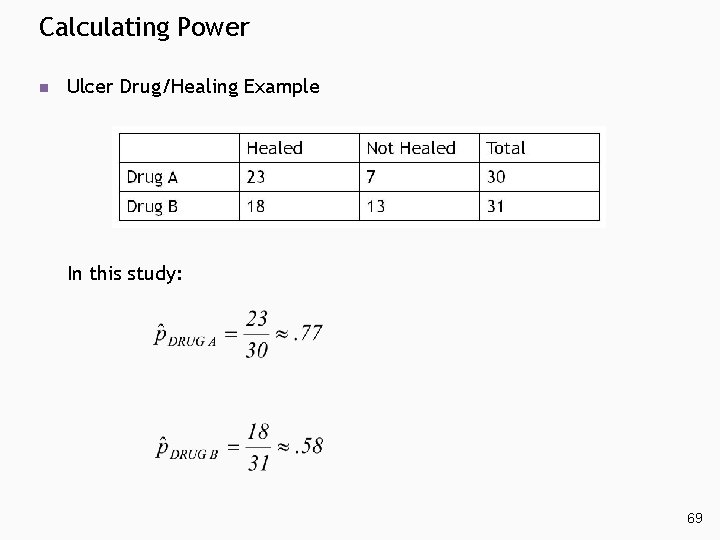
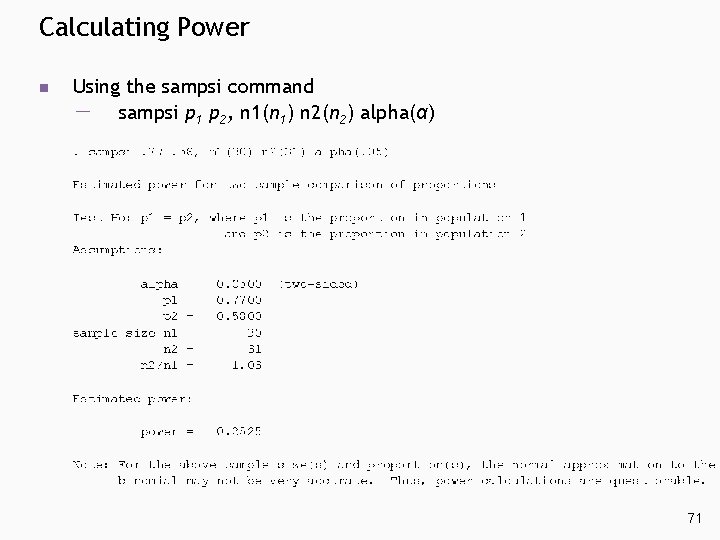
Calculating Power n Ulcer Drug/Healing Example In this study: 69
Calculating Power n Fill in information below with results form this study Sample size for each group ( n. DRUG A = 30, n. DRUG B= 31) Estimated (population) proportions, p. DRUG A =. 77 and p. DRUG B=. 58 -level of the hypothesis test (. 05) 70
Calculating Power n Using the sampsi command sampsi p 1 p 2, n 1(n 1) n 2(n 2) alpha(α) 71
Section E FYI if Interested
Example n Consider the following results from a study done on 29 women, all 35– 39 years old Sample Data n Mean SBP SD of SBP OC users 8 132. 8 15. 3 Non-OC Users 21 127. 4 18. 2 73
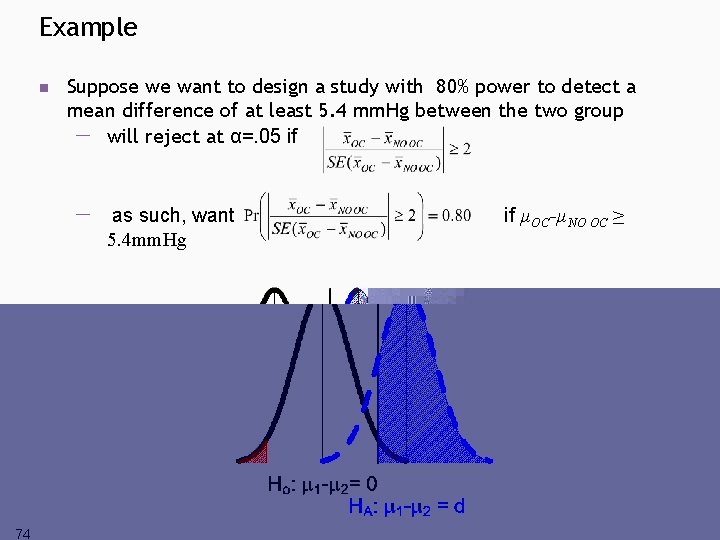
Example n Suppose we want to design a study with 80% power to detect a mean difference of at least 5. 4 mm. Hg between the two group will reject at α=. 05 if as such, want 5. 4 mm. Hg if µOC-µNO OC ≥ 74
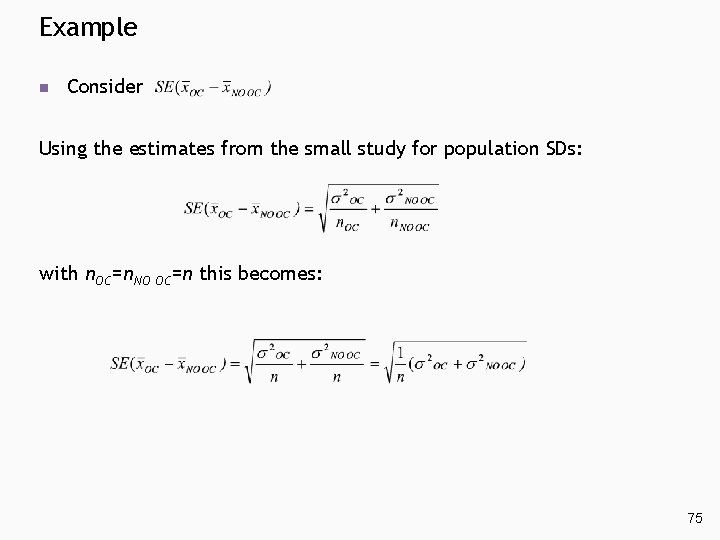
Example n Consider Using the estimates from the small study for population SDs: with n. OC=n. NO OC=n this becomes: 75
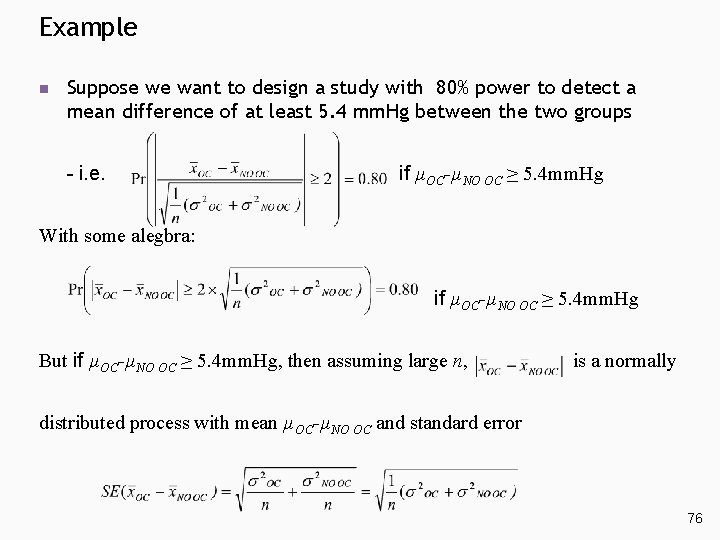
Example n Suppose we want to design a study with 80% power to detect a mean difference of at least 5. 4 mm. Hg between the two groups - i. e. if µOC-µNO OC ≥ 5. 4 mm. Hg With some alegbra: if µOC-µNO OC ≥ 5. 4 mm. Hg But if µOC-µNO OC ≥ 5. 4 mm. Hg, then assuming large n, is a normally distributed process with mean µOC-µNO OC and standard error 76
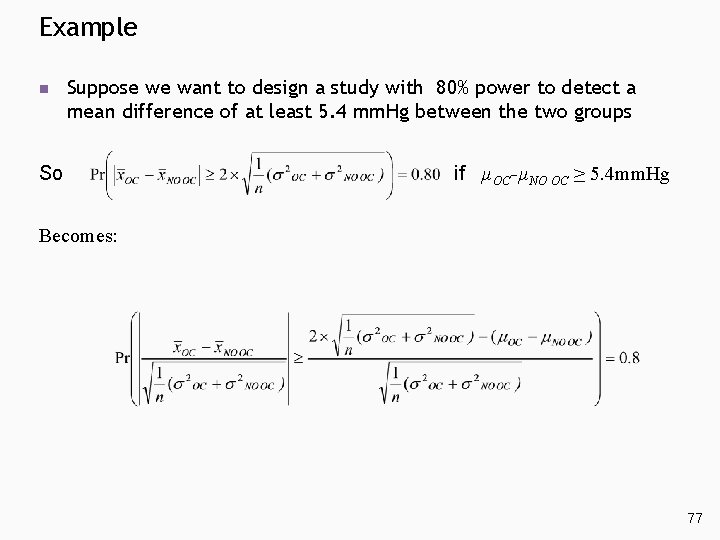
Example n Suppose we want to design a study with 80% power to detect a mean difference of at least 5. 4 mm. Hg between the two groups So if µOC-µNO OC ≥ 5. 4 mm. Hg Becomes: 77
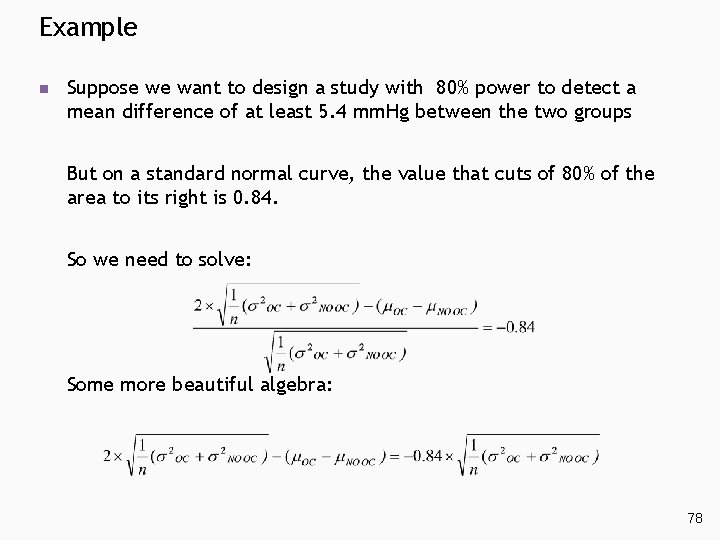
Example n Suppose we want to design a study with 80% power to detect a mean difference of at least 5. 4 mm. Hg between the two groups But on a standard normal curve, the value that cuts of 80% of the area to its right is 0. 84. So we need to solve: Some more beautiful algebra: 78
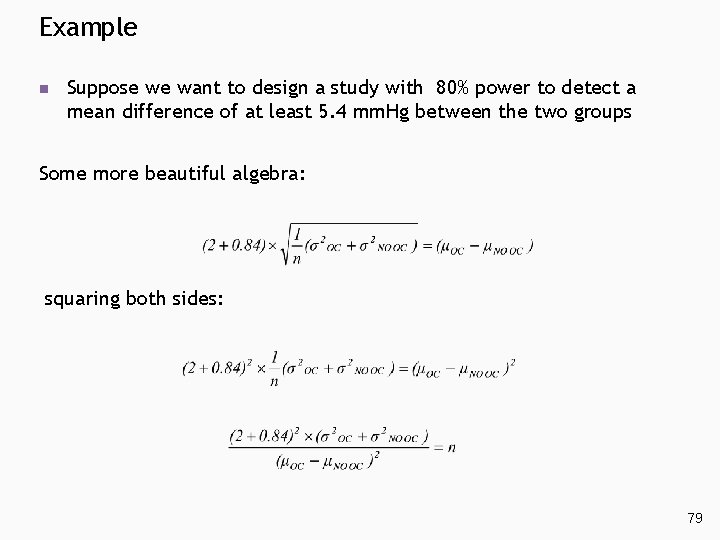
Example n Suppose we want to design a study with 80% power to detect a mean difference of at least 5. 4 mm. Hg between the two groups Some more beautiful algebra: squaring both sides: 79
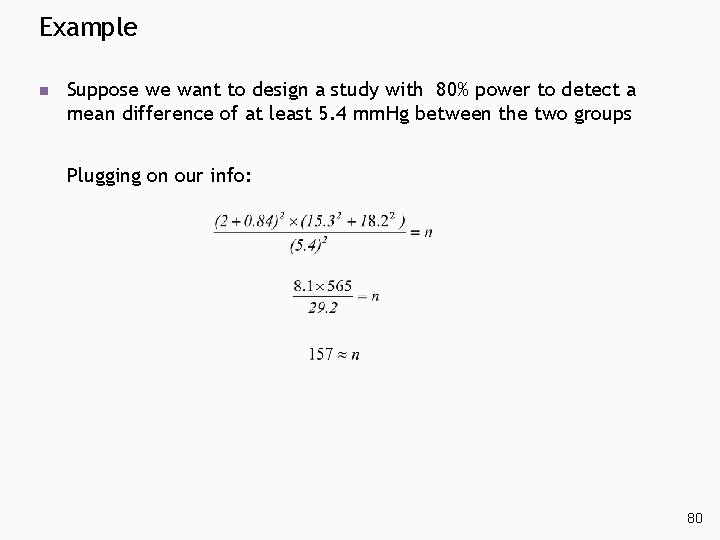
Example n Suppose we want to design a study with 80% power to detect a mean difference of at least 5. 4 mm. Hg between the two groups Plugging on our info: 80
Example n It is also possible to design a study to estimate a quantity, such as a mean difference or difference in proportions with a desired level of precision n In other word, the necessary sample sizes can be estimated to try to get a confidence interval of a desired maximum width 81
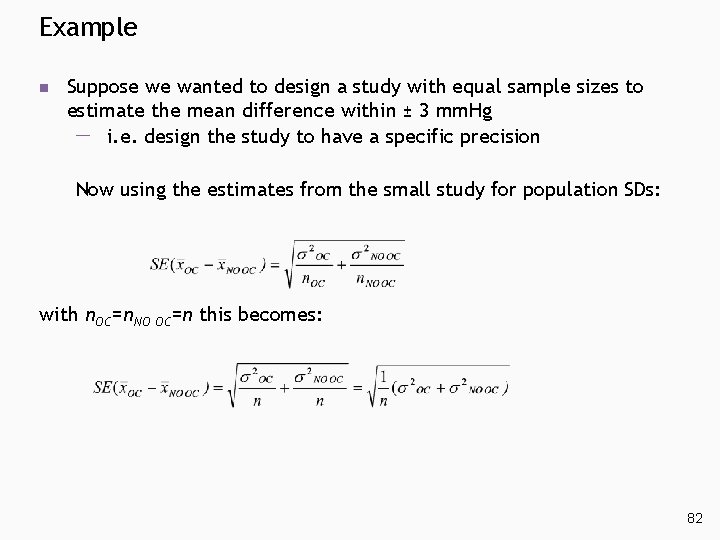
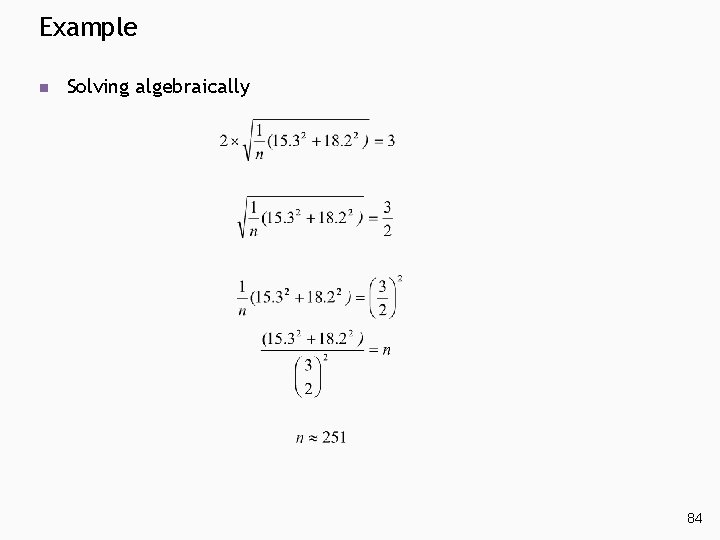
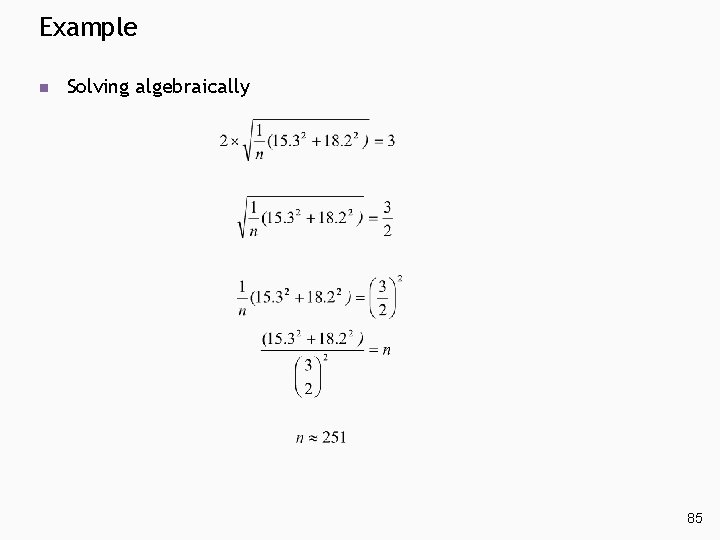
Example n Suppose we wanted to design a study with equal sample sizes to estimate the mean difference within ± 3 mm. Hg i. e. design the study to have a specific precision Now using the estimates from the small study for population SDs: with n. OC=n. NO OC=n this becomes: 82
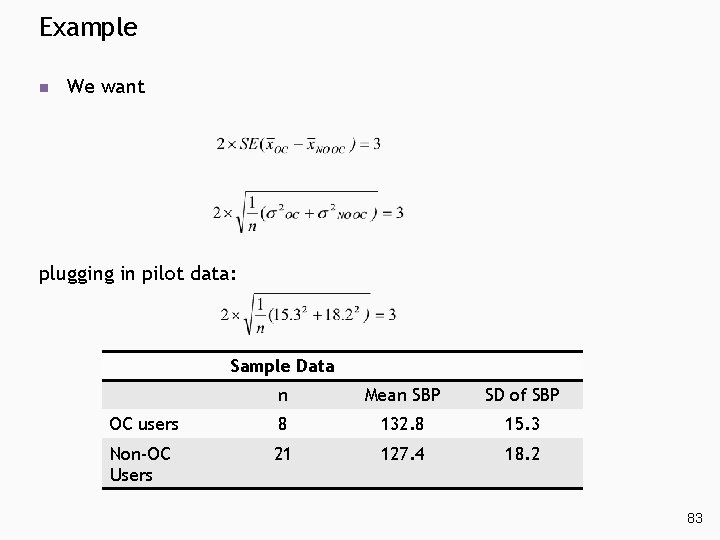
Example n We want plugging in pilot data: Sample Data n Mean SBP SD of SBP OC users 8 132. 8 15. 3 Non-OC Users 21 127. 4 18. 2 83
Example n Solving algebraically 84
Example n Solving algebraically 85