Diagnosing Sample Ratio Mismatch in Online Controlled Experiments


 Learnings 1. Online Controlled Experiments consist of several stages that")

- Slides: 19
Diagnosing Sample Ratio Mismatch in Online Controlled Experiments Aleksander Fabijan alfabija@microsoft. com
Analysis & Experimentation @ Microsoft We started in Bing with the goal of providing trustworthy experimentation at scale. 10 years of experimentation learnings have been incorporated into the platform as capabilities. Ex. P is now one of the largest and most advanced experimentation systems on the planet. 4, 000+ 2, 000+ 250, 000+ Platform Users/month Experiments/month Scorecards/year + 2
https: //exp-platform. com/Documents/2019_KDDFabijan. Gupchup. Fupta. Omhover. Vermeer. Dmitriev. pdf 3
Source: https: //medium. com/@penguinpress/an-excerpt-from-how-not-to-be-wrong-by-jordan-ellenberg-664 e 708 cfc 3 d Abraham Wald https: //commons. wikimedia. org/wiki/File: Survivorship-bias. png Mc. Geddon [CC BY-SA 4. 0 (https: //creativecommons. org/licenses/by-sa/4. 0)] 4
Users / Devices T: 50% Users C: 50% Treatment: Existing System with Feature X Control System: Existing System Interactions are instrumented Data is collected and ‘cooked’ Statistical Analysis to determine the winner is done 5
821, 588 815, 482 50. 2% 49. 8% Bias alert Variant A Variant B 6
How critical and frequent are SRMs? • Most SRMs completely invalidate the experiment. • Identifying why there is an SRM is hard. “If it is a browser related SRM it may take me a week, if it is not browser related it can take me months. ” -- Senior Data Scientist @ A&E Ratio of OCEs with an SRM at Microsoft.
MSN Carousel Experiment Facts • Increased rotating cards from 12 to 16. • Expectation was to see an increase in engagement (clicks) on carousel. • Outcome: decrease in engagement. • An SRM alert fired. 49. 8 percent of users in treatment instead of 50%. 12 rotating cards 16 rotating cards What happened? 8
Users / Devices A: 50% Users B: 50% Treatment: Existing System with Feature X Control System: Existing System Interactions are instrumented Data is collected and ‘cooked’ Statistical Analysis to determine the winner is done A bot filtering algorithm removed most active users from the analysis. 9
Microsoft Store Homepage Facts • Correctly designed experiment. • Developers have a way to assign into treatment through URL parameters. What happened?
A search engine campaign was pointing directly to the variant. Users / Devices A: 50% Users B: 50% Treatment: Existing System with Feature X Control System: Existing System Interactions are instrumented Data is collected and ‘cooked’ Statistical Analysis to determine the winner is done 11
Teams UI Experiment • • Microsoft Teams ran an experiment testing a new design of the welcome page. Scorecard with the users that saw/would have seen the welcome page had an SRM. The new design of the welcome page took longer to load. There were less users in the treatment variation with the new design. What happened?
Users / Devices A: 50% Users B: 50% Treatment: Existing System with Feature X Control System: Existing System Interactions are instrumented Data is collected and ‘cooked’ Statistical Analysis to determine the winner is done Users quit the app before the load event was logged. 14
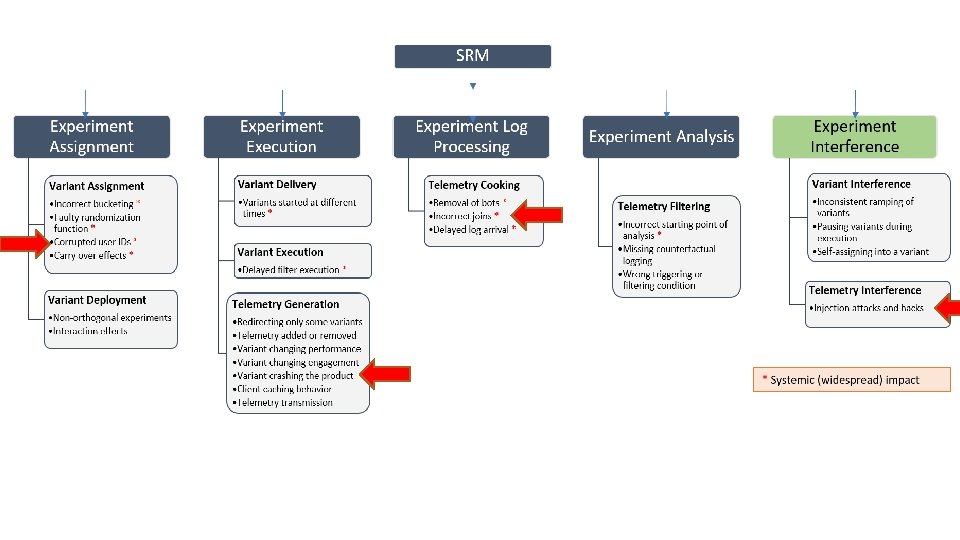
3 Puzzling Experiments with SRMs Experiment log Processing Experiment interference Experiment Analysis MSN MS Store Homepage Microsoft Teams SRM due to bot filtering. Someone bought a search engine campaign pointing directly to the variant. Users had more time to quit in the new design, increasing the probability of losing their tracking events.
Rules of thumb for debugging an SRM 1. Examine several scorecards: SRM in a triggered/filtered scorecard? 2. Examine user segments: SRM in a segment with slow internet connections? 3. Examine time segments: delayed start of a variant? 4. Analyze performance metrics: If there is a large degradation in key performance metrics? 5. Analyze engagement metrics: Are more/less engaged users impacted more? 6. Count frequency of SRMs: Localized or widespread SRM? 7. Examine AA experiment: If an A/A experiment has an SRM then it’s likely a systemic issue. 8. Examine severity: No users in control? 9. Examine downstream: introspection of data at different collection and aggregation stages? 10. Examine across pipelines : Two data pipelines?
Learnings & Take Away(s) Learnings 1. Online Controlled Experiments consist of several stages that need to be executed in a trustworthy way. • An SRM is one of the critical indicators for the health of the overall experiment. 2. Investigating why an experiment has an SRM is a hard problem. It’s like fever: • Sometimes it’s just from a cold, • Other times it’s a symptom of something much harder to heal. Practical Takeaways 1. Compute a Sample Ratio Mismatch for every experiment. 2. Use the SRM Taxonym to be aware of the root causes for your experiment. 3. Follow the 10 rules of thumb to eliminate hypotheses. Aleksander Fabijan alfabija@microsoft. com
Research at A&E 1. Architecture: • Safe Velocity: A Practical Guide to Software Deployment at Scale using Controlled Rollout (Tong et al. ) • Three Key Checklists and Remedies for Trustworthy Analysis of Online Experiments (Fabijan et al. ) • The Anatomy of a Large-Scale Online Experimentation Platform (Gupta et al. ) 2. Growth: • The Evolution of Continuous Experimentation in Software Product Development (Fabijan et al. ) • Enterprise Level Controlled Experiments at Scale: Challenges and Solutions ( Liu et al. ) 3. Statistics: • Applying the Delta method in metric analytics: A practical guide with novel ideas. (Deng et al. ) • On Heavy-user Bias in A/B Testing (Wang et al. ) + many other areas. 19