Overview of National Trends for Pediatricians and Patients


 80 70 90 69, 8 67, 2 63, 7 62,")
, 1980 -2018* 5, 00 4, 80")
, Recorded (1980 -2018) and Projected (2019")


 Who Speak a Language Other Than English")

 Living Below the Poverty Level")


 Who Reported Burnout, Career")

- Slides: 26
Overview of National Trends for Pediatricians and Patients From: American Academy of Pediatrics Research February 2020
Who are US Children?
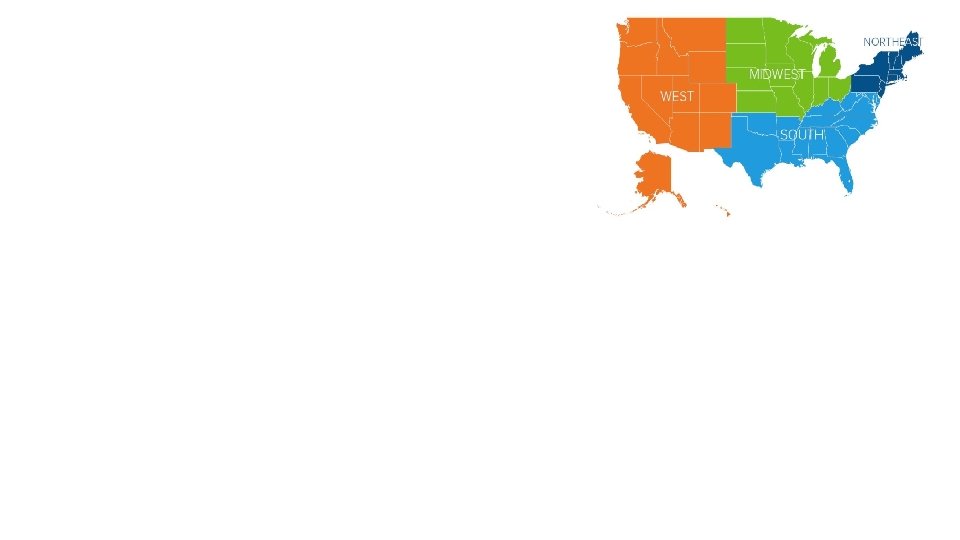
Overview of Key Trends • US child population • Birth rates • Racial/ethnic composition • Immigrant children • Geographic shifts • Poverty trends
90 Number (in millions) 80 70 90 69, 8 67, 2 63, 7 62, 6 64, 2 69, 5 72, 4 73, 5 74, 1 73, 6 73, 4 80 70 60 50 100 60 34% 50 22% 40 40 30 30 20 20 10 10 0 0 1975 1980 1985 1990 1995 2000 2005 2010 2015 2018 Number in Millions Source: US Census Bureau (http: //www. childstats. gov/americaschildren/tables/pop 1. asp and http: //www. childstats. gov/americaschildren/tables/pop 2. asp) % of Population 100 US Child (under 18) Population Trends: Number and % of Overall Population, 1970 -2018
US Birth Trends (in Millions of Children Born), 1980 -2018* 5, 00 4, 80 Number (in millions) 4, 60 12% decline 2007 - 2018 4, 32 4, 40 4, 16 4, 20 4, 00 3, 79 3, 80 3, 61 3, 60 3, 40 3, 20 3, 00 1985 1990 1995 2000 2005 2010 *Data for 1980 -2017 are final; data for 2018 are preliminary. Source: CDC/NCHS, National Vital Statistics Reports (data for 1980 -2015: https: //www. cdc. gov/nchs/data/nvsr 66/nvsr 66_01. pdf; 2016 and beyond: https: //www. cdc. gov/nchs/data/nvsr 67/nvsr 67_08 -508. pdf and https: //www. cdc. gov/nchs/data/vsrr-007 -508. pdf) 2015 2018
Trends in Race/Ethnicity of US Children (under 18), Recorded (1980 -2018) and Projected (2019 -2050) 80 74, 0 Non-Hispanic Asian 70 Projected 2019 -2050 Non-Hispanic Black 60 % of Population Hispanic Non-Hispanic White 50, 3 50 40 39, 4 30 25, 5 20 14, 5 13, 7 10 8, 9 0 1980 30, 8 13, 9 5, 1 1990 2000 2010 Source: US Census Bureau (http: //www. childstats. gov/americaschildren/tables/pop 3. asp) 2020 7, 2 2030 2040 2050
Immigrant Children as Share of All Children, 1920– 2050 40% Actual 35% 30% Projected 27% 26% 23% 25% 31% 23% 20% 29% 34% 15% 18% 12% 10% 12% 6% 7% 9% 5% 0% 0 2 19 0 3 19 0 4 19 0 5 19 0 6 19 0 7 19 0 8 19 0 9 19 0 0 20 9 0 20 0 2 20 0 3 20 0 4 20 Source: Passel, Jeffrey. “Demography of Immigrant Youth: Past, Present, and Future. ” The Future of Children, 2011 Note: “Immigrant children” defined as children under age eighteen who are either foreign-born or U. S. -born to immigrant parents; Gray shaded region (2020 -2050) refers to population projections 0 5 20
Total Foreign-Born as Share of Total Population and Immigrant Children as Share of All Children, 1920– 2050 40% 30% Actual Projected 27% 26% 23% 18% 20% 12% 0% 13% 11% 31% 23% 20% 10% 29% 34% 12% 6% 9% 7% 5% 9% 11% 6% 13% 15% 16% 17% 19% 8% 1920 1930 1940 1950 1960 1970 1980 1990 2009 2020 2030 2040 2050 Immigrant Children as a Share of All Children Total Foreign-Born as Share of Total Population Source: Passel, Jeffrey. “Demography of Immigrant Youth: Past, Present, and Future. ” The Future of Children, 2011 Note: “Immigrant children” defined as children under age eighteen who are either foreign-born or U. S. -born to immigrant parents; Gray shaded region (2020 -2050) refers to population projections
% of US Children (ages 5 -17) Who Speak a Language Other Than English at Home, 1979 -2017 30 25 21, 1 Percent 20 16, 7 15 10 22, 5 12, 3 8, 5 5 0 1979 1989 Source: US Census Bureau, Current Population Survey and American Community Survey (http: //www. childstats. gov/americaschildren/tables/fam 5. asp) 1999 2009 2017
60 Figure 1. Percent of Persons in the US Living Below the Poverty Level by Age Group, 19802018* Children under 18 50 Adults 18 -64 Adults 65+ Percent 40 30 22, 0% 20 [VALUE]% 13, 8% [VALUE]% 10 [VALUE]% 8, 9% 0 1985 1990 1995 2000 *Estimates for 2013 and beyond are not directly comparable to previous years due to a re-design of the income questions. Estimates for 2017 and beyond are not directly comparable to previous years due to the implementation of an updated CPS ASEC processing system. Source: US Census Bureau, Current Population Survey, Annual Social and Economic Supplement (https: //www. census. gov/content/dam/Census/library/publications/2019/demo/p 60 -266. pdf) 2005 2010 2015 Poverty Level in 2018: $25, 465 (family of 4 with 2 children) 2018
60 Figure 2. Percent of US Children (under 18) Living Below the Poverty Level by Race/Ethnicity, 1980 -2018* White 50 Hispanic 39, 0% 40 Percent Black [VALUE]% 34, 9% 30 [VALUE]% 20 12, 3% [VALUE]% 10 0 1985 1990 1995 2000 *Estimates for 2013 and beyond are not directly comparable to previous years due to a re- design of the income questions. Estimates for 2017 and beyond are not directly comparable to previous years due to the implementation of an updated CPS ASEC processing system. Source: US Census Bureau, Current Population Survey, Annual Social and Economic Supplement (https: //www. census. gov/content/dam/Census/library/publications/2019/demo/p 60 -266. pdf) 2005 2010 2015 Poverty Level in 2018: $25, 465 (family of 4 with 2 children) 2018
Who are US Pediatricians?
Overview of Key Trends • Substantial gender shift • Shift toward subspecialty careers • Employees in larger practice settings • High satisfaction with career • High frustration with administrative burdens
US Medical School First-Year Enrollment Number of 1 st Year Students 12000 52. 4% 110000 47. 6% 9000 Males 8000 Females 7000 6000 Source: AAMC Applicants and Matriculants Data https: //www. aamc. org/download/492954/data/factstablea 7_2. pdf 19 20 18 20 17 20 16 20 15 20 14 20 13 20 12 20 11 20 10 20 09 20 08 20 07 20 06 20 05 20 04 20 03 20 02 20 01 20 19 92 5000
% Female: Top 12 Specialties Specialty Female % Pediatrics Obstetrics/Gynecology Geriatric Medicine Endocrinology 63 57 53 49 Dermatology Rheumatology Infectious Disease Family Med. / General Practice 49 45 41 40 Psychiatry Allergy and Immunology Internal Medicine Anatomic / Clinical Pathology 39 38 38 38 Source: AMA Masterfile 2017 / AAMC (www. aamc. org/data/workforce/reports/492560/1 -3 -chart. html)
Age & Gender Distribution of Pediatricians: 1987 -89 & 2017 -19 1987 -89 (28% female) 2017 -19 (69% female) Source: AAP Periodic Survey 1987 -1989 and 2017 -2019 Note: Resident and senior members excluded
Early Career Pediatricians less likely to pursue primary care • From about 70% of residents in 1998 to one-third today • Similar trend for men and women
Percentage of graduating pediatric residents whose future clinical practice goal is primary care 100 90 Percentage 80 66 70 60 71 68 66 63 62 49 51 50 45 44 43 42 45 43 40 41 40 40 40 37 37 39 35 34 30 20 10 19 97 19 98 19 99 20 00 20 01 20 02 20 03 20 04 20 05 20 06 20 07 20 08 20 09 20 10 20 11 20 12 20 13 20 14 20 15 20 16 20 17 20 18 20 19 0 Survey Year Source: AAP Annual Survey of Graduating Residents, 1997 -2019
Pediatricians are very satisfied with being a pediatrician • Nearly all graduating residents report they would choose pediatric residency again • Consistent across decades: High satisfaction with career and position • Significant minority report burnout
% of Graduating Pediatric Residents Who Report They Would Choose a Categorical Pediatric Residency Again 100 94 93 93 94 94 94 96 96 94 93 93 94 94 93 90 80 70 60 % 50 40 30 20 10 0 2003 2004 2005 2006 2007 2008 2009 2010 2011 2012 2013 2014 2015 2016 2017 2018 2019 Source: AAP Annual Survey of Graduating Residents, 2003 -2019
Satisfaction with Career as a Pediatrician: Member Views 1987 & 2018 50 84% 45 88% Percentage 40 Very dissatisfied Dissatisfied Uncertain Satisfied Very Satisfied 35 30 25 20 15 10 5 0 1987 Source: Periodic Survey #2 and #100 2018
% of PLACES Participants PLACES Pediatricians (Early to Mid Career) Who Reported Burnout, Career Dissatisfaction, or Often Sad or Depressed, 2019 50% 45% 40% 35% 30% 25% 20% 15% 10% 5% 0% 36% 11% Burnout Source: PLACES Annual Survey 8, 2019; n=1430 Sad or Depressed 7% Career Dissatisfaction
Reflections? Questions?