NTA results for Spain Measuring the degree of



- Slides: 27
NTA results for Spain: Measuring the degree of intervention of the public sector on intergenerational intra family transfers in Spain using NTA/GA Preliminary draft NTA Workshop Berkeley, January 2009 Ció Patxot CAEPS (UB), IEF Elisenda Rentería, Cedeplar - UFMG Guadalupe Souto, UAB 1
Outine 1. Motivation: rethinking the role of the welfare state 2. Measuring the degree of intervention of public sector in intergenerational intra family transfers using GA/NTA 1. Theoretical Background 2. NTA application 3. GA application 2
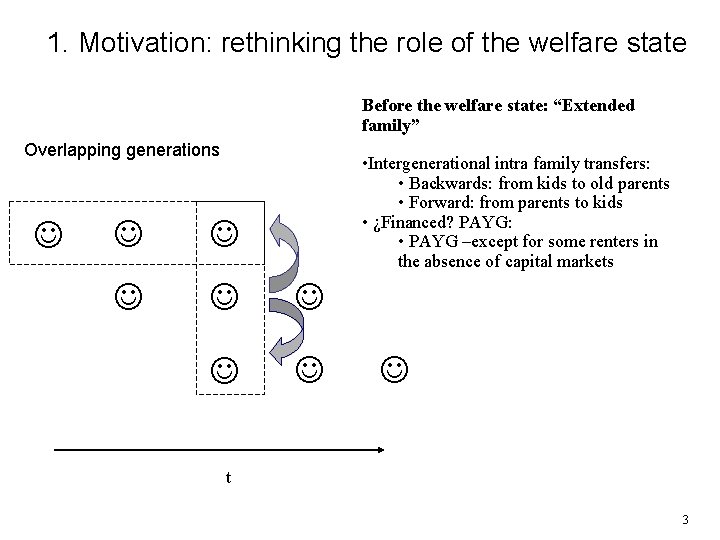
1. Motivation: rethinking the role of the welfare state Before the welfare state: “Extended family” Overlapping generations • Intergenerational intra family transfers: • Backwards: from kids to old parents • Forward: from parents to kids • ¿Financed? PAYG: • PAYG –except for some renters in the absence of capital markets t 3
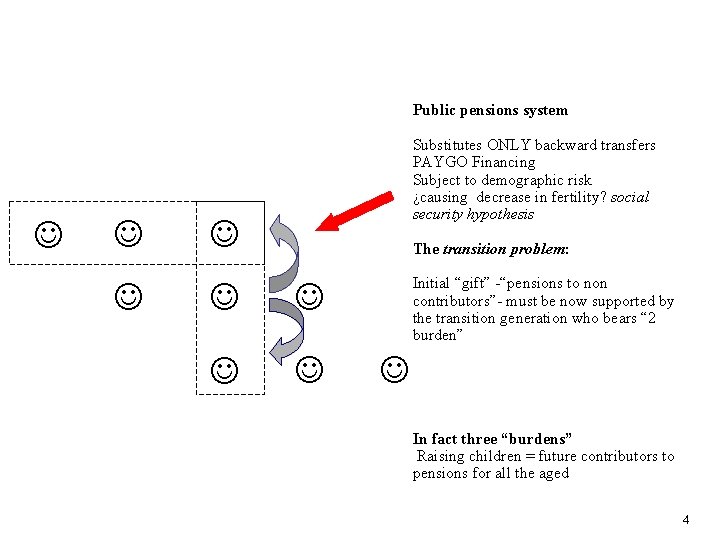
Public pensions system Substitutes ONLY backward transfers PAYGO Financing Subject to demographic risk ¿causing decrease in fertility? social security hypothesis The transition problem: Initial “gift” -“pensions to non contributors”- must be now supported by the transition generation who bears “ 2 burden” In fact three “burdens” Raising children = future contributors to pensions for all the aged 4
2. 1. Theoretical framework Two main strands of literature: • Private motives for intergenerational intra family transfers (IIT) and for government intervention on it – Saving motives: bequest motive – Motives for other IIT (inter-vivos donation, bequest, gifts to parents) –including fertility – Public sector intervention: Social policy as government intervention on IIT. • Population ageing: – Effects on the economy and on the public budget – Is the demographic transition endogenous (economic decision) Theoretical tool: Dynamic macroeconomic general equilibrium models (Overlapping generations models, GE-OLG): allowing for the analysis of IIT, i. e. with • Backward and forward altruism • Strategic behavior Applied techniques: GA, NTA, large scale OLG, / microsimulation 5
Previous well known result: Diamond model without any altruism –non private IIT– and exogenous fertility Competitive economy is not Pareto optimal in Diamond model: Over or under accumulation. Pension policy: • Under accumulation: Funding Though NOT Pareto optimal • Over accumulation: PAYG is Pareto optimal Samuelson’s Serendipity Theorem: the only golden rule that is a steady state of the CE is the goldenest (optimal n planner), only reached by chance –n* = exogenous n in the CE • The policy above does not lead to the goldenest, nor to the golden rule. Why? : • Both “production factors” need to be optimized at once. • We need to consider endogenous fertility. 6
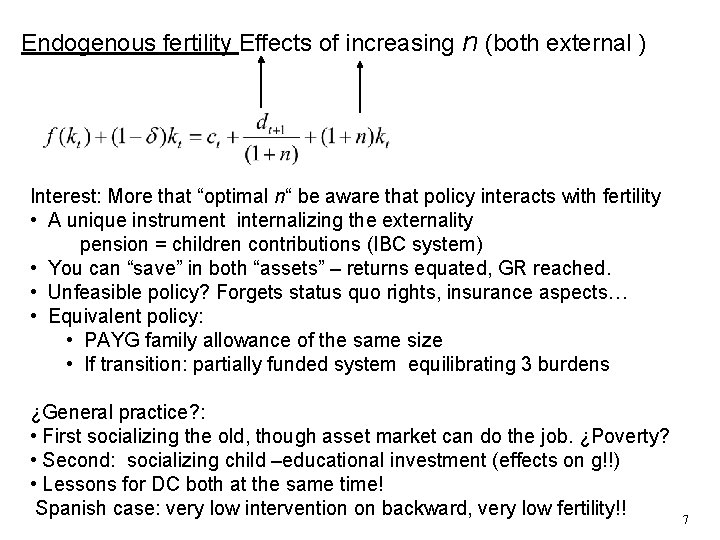
Endogenous fertility Effects of increasing n (both external ) Interest: More that “optimal n“ be aware that policy interacts with fertility • A unique instrument internalizing the externality pension = children contributions (IBC system) • You can “save” in both “assets” – returns equated, GR reached. • Unfeasible policy? Forgets status quo rights, insurance aspects… • Equivalent policy: • PAYG family allowance of the same size • If transition: partially funded system equilibrating 3 burdens ¿General practice? : • First socializing the old, though asset market can do the job. ¿Poverty? • Second: socializing child –educational investment (effects on g!!) • Lessons for DC both at the same time! Spanish case: very low intervention on backward, very low fertility!! 7
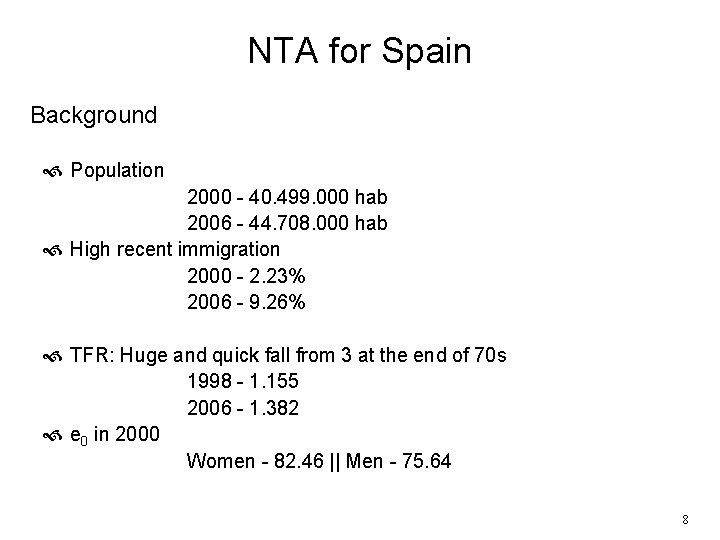
NTA for Spain Background Population 2000 - 40. 499. 000 hab 2006 - 44. 708. 000 hab High recent immigration 2000 - 2. 23% 2006 - 9. 26% TFR: Huge and quick fall from 3 at the end of 70 s 1998 - 1. 155 2006 - 1. 382 e 0 in 2000 Women - 82. 46 || Men - 75. 64 8
Background Spain 9
Objectives First approach to the Lifecycle Deficit in Spain for 2000 First approach of the Public transfers profiles by age for the year 2000 in Spain Comparison of both profiles: measuring the degree of intervention of public sector in intergenerational intra family transfers using NTA/GA 10
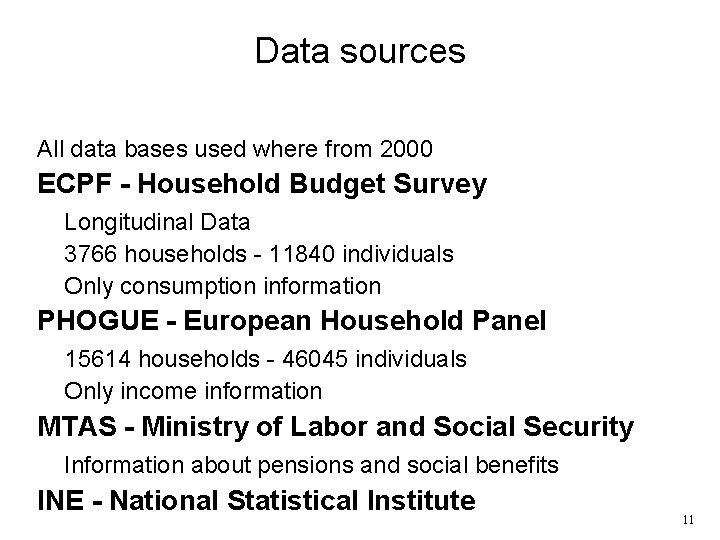
Data sources All data bases used where from 2000 ECPF - Household Budget Survey Longitudinal Data 3766 households - 11840 individuals Only consumption information PHOGUE - European Household Panel 15614 households - 46045 individuals Only income information MTAS - Ministry of Labor and Social Security Information about pensions and social benefits INE - National Statistical Institute 11
Labor Income per capita 12
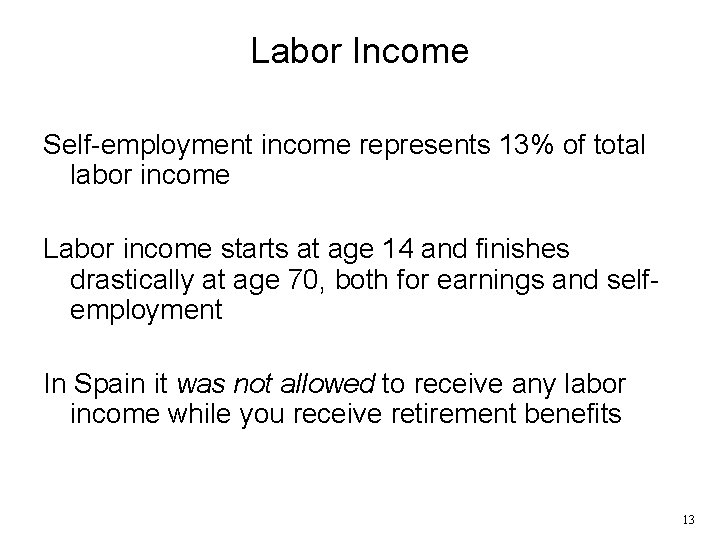
Labor Income Self-employment income represents 13% of total labor income Labor income starts at age 14 and finishes drastically at age 70, both for earnings and selfemployment In Spain it was not allowed to receive any labor income while you receive retirement benefits 13
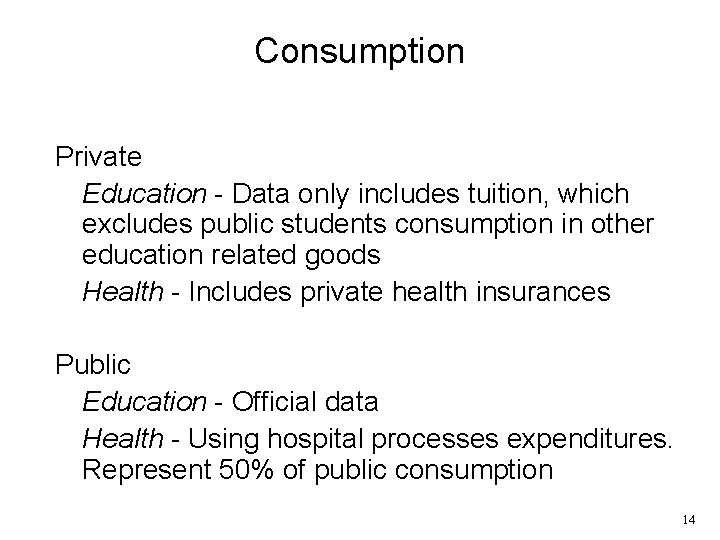
Consumption Private Education - Data only includes tuition, which excludes public students consumption in other education related goods Health - Includes private health insurances Public Education - Official data Health - Using hospital processes expenditures. Represent 50% of public consumption 14
Private consumption 15
Public consumption 16
Lifecycle Deficit 17
Lifecycle Deficit Surplus from 27 to 57 - 30 years Bigger deficit for the elderly than for the children Long-term care is included in other public consumption 18
Public transfers outflows 19
Public transfers inflows Education Health Retirement benefits Social Protection benefits Other public transfers (in-kind and cash) Transfers from the rest of the world (ROW) Age profiles from public consumption (health and education) and from MTAS for Social Protection benefits 20
Public transfers inflows 21
Net Public Transfers 22
LCD and TG 23
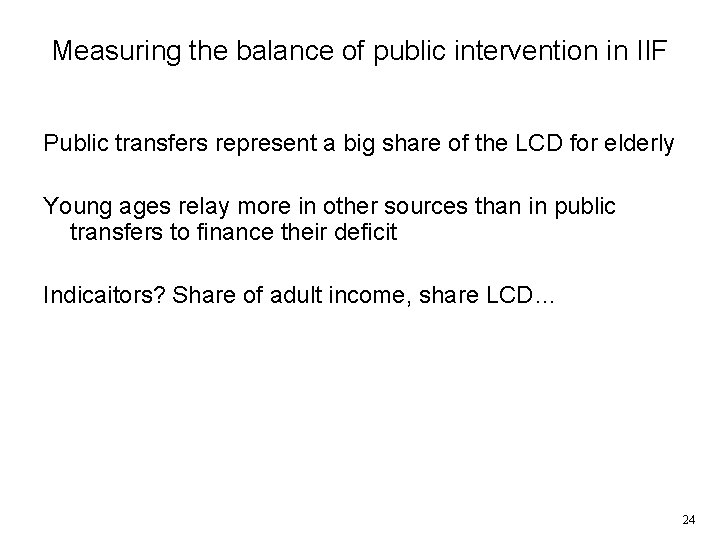
Measuring the balance of public intervention in IIF Public transfers represent a big share of the LCD for elderly Young ages relay more in other sources than in public transfers to finance their deficit Indicaitors? Share of adult income, share LCD… 24
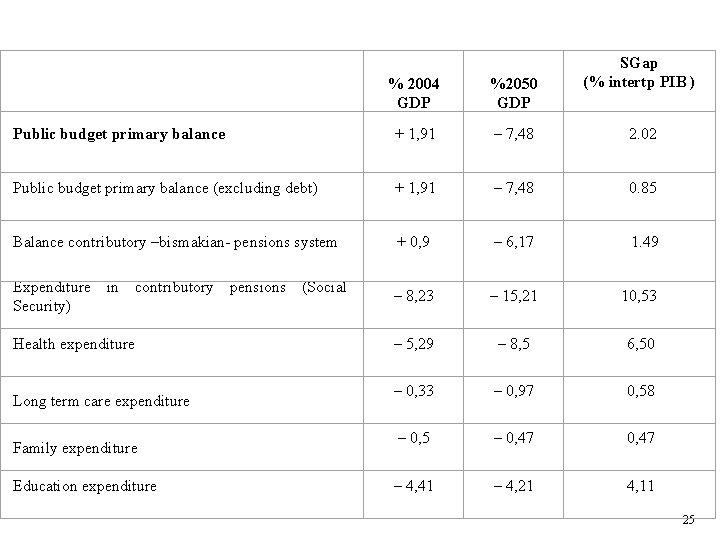
% 2004 GDP %2050 GDP SGap (% intertp PIB ) Public budget primary balance + 1, 91 – 7, 48 2. 02 Public budget primary balance (excluding debt) + 1, 91 – 7, 48 0. 85 Balance contributory –bismakian- pensions system + 0, 9 – 6, 17 1. 49 Expenditure in contributory pensions (Social Security) – 8, 23 – 15, 21 10, 53 Health expenditure – 5, 29 – 8, 5 6, 50 – 0, 33 – 0, 97 0, 58 – 0, 5 – 0, 47 – 4, 41 – 4, 21 4, 11 Long term care expenditure Family expenditure Education expenditure 25
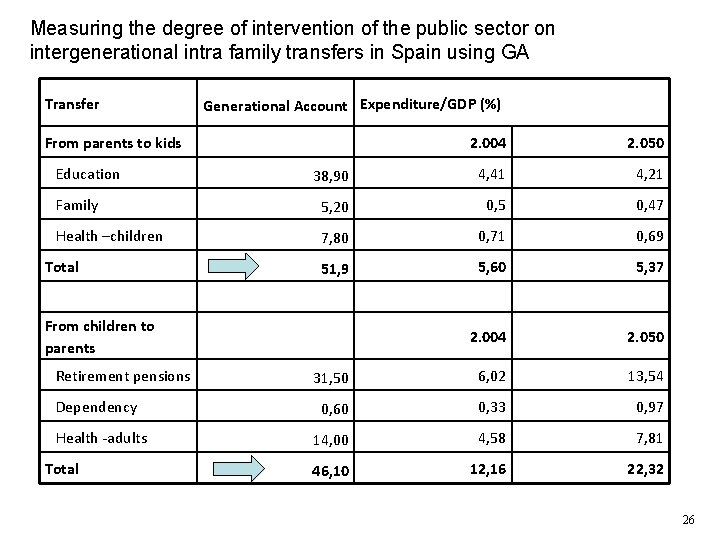
Measuring the degree of intervention of the public sector on intergenerational intra family transfers in Spain using GA Transfer Generational Account Expenditure/GDP (%) From parents to kids 2. 004 2. 050 38, 90 4, 41 4, 21 Family 5, 20 0, 5 0, 47 Health –children 7, 80 0, 71 0, 69 51, 9 5, 60 5, 37 2. 004 2. 050 31, 50 6, 02 13, 54 0, 60 0, 33 0, 97 14, 00 4, 58 7, 81 46, 10 12, 16 22, 32 Education Total From children to parents Retirement pensions Dependency Health -adults Total 26
Thanks for your attention 27