
NTA basic concepts policy implications and some results
NTA: basic concepts, policy implications and some results for LAC Cassio M. Turra Departamento de Demografia
Fundamental question: how do different age groups, including children and the elderly, acquire and use economic resources? Lee and Mason
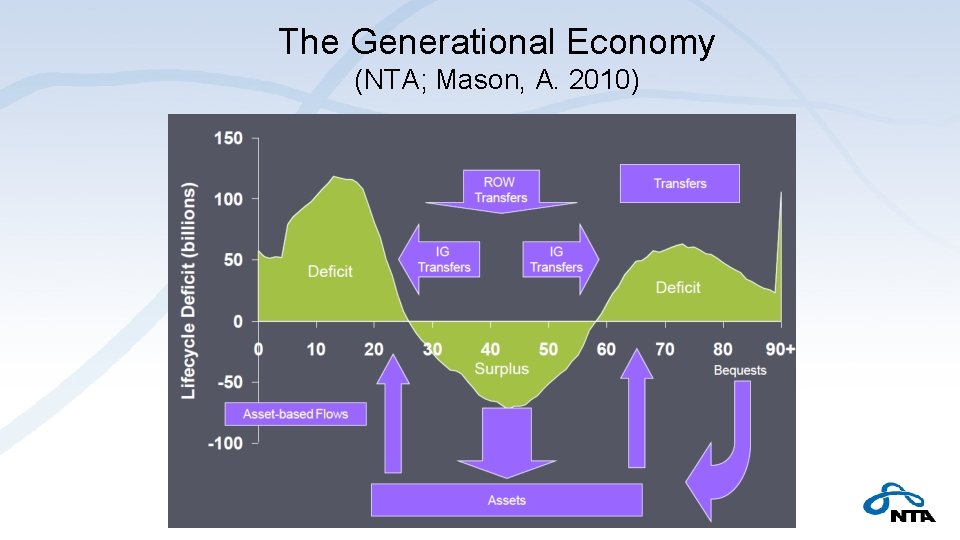
The Generational Economy (NTA; Mason, A. 2010)
1) Economic lifecycle and reallocation systems – Reallocation is facilitated by institutions and mechanisms • Transfer systems – Private (families, non‐profits) – Public (government mandated programs) • Assets that can act as a store of value over time 2) Age and the individual perspective – NTA classifies economic flows by age of the individual – Individuals receive inflows and give outflows, with saving as the balancing item – Challenges to the individual perspective • Institutions are just agents, so NTA must make assumptions to attribute all flows through institutions to individuals • Measurement
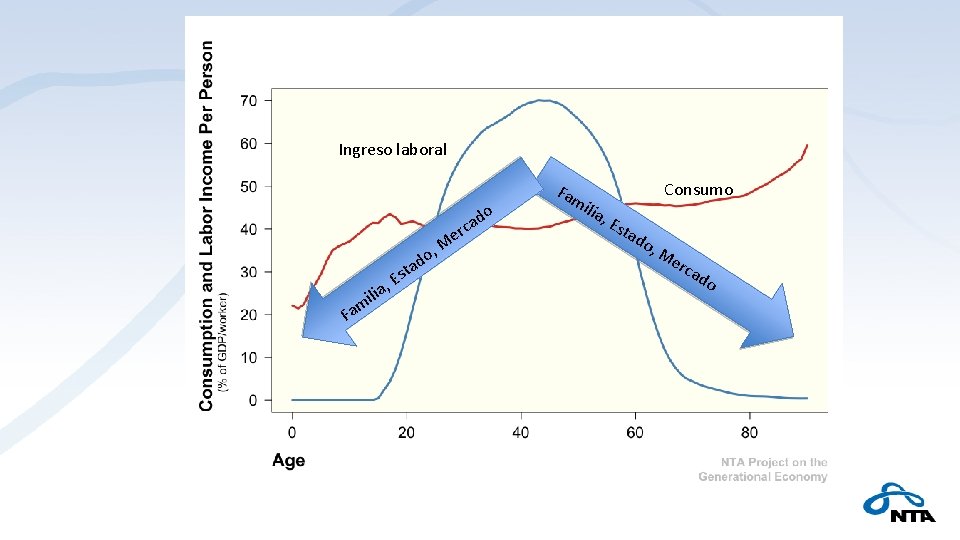
Ingreso laboral , M do a erc F i m a l ia, o d a t Es Fam ilia , E Consumo sta do , M erc ad o

NTA Flow Identity • Inflows – Labor Income – Assets Income – In‐Transfers • Outflows – Consumption – Savings (residual) – Out‐Transfers
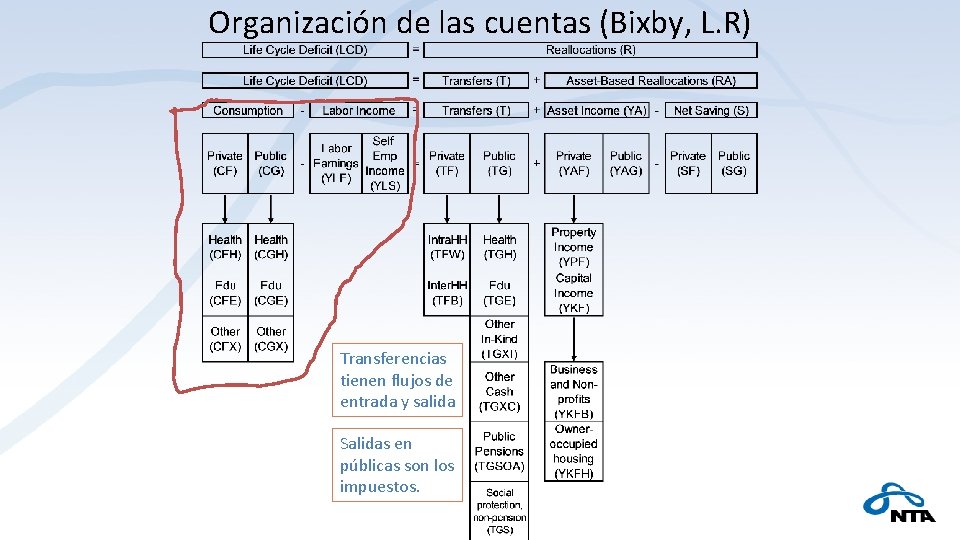
Organización de las cuentas (Bixby, L. R) Transferencias tienen flujos de entrada y salida Salidas en públicas son los impuestos.
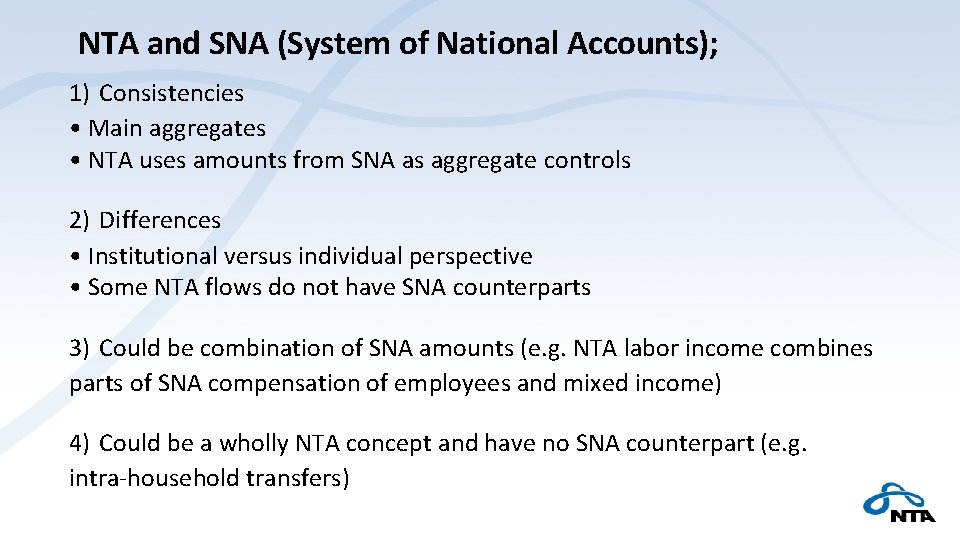
NTA and SNA (System of National Accounts); 1) Consistencies • Main aggregates • NTA uses amounts from SNA as aggregate controls 2) Differences • Institutional versus individual perspective • Some NTA flows do not have SNA counterparts 3) Could be combination of SNA amounts (e. g. NTA labor income combines parts of SNA compensation of employees and mixed income) 4) Could be a wholly NTA concept and have no SNA counterpart (e. g. intra‐household transfers)
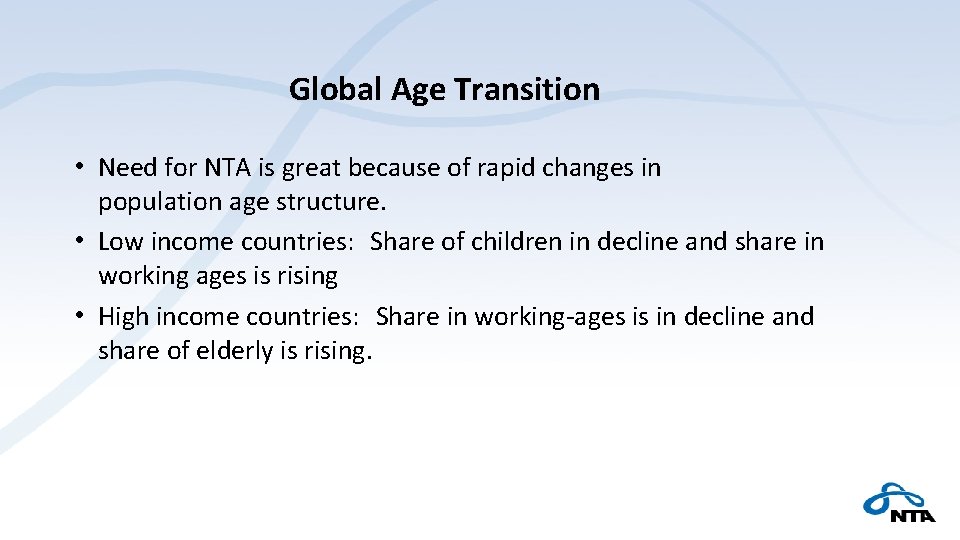
Global Age Transition • Need for NTA is great because of rapid changes in population age structure. • Low income countries: Share of children in decline and share in working ages is rising • High income countries: Share in working‐ages is in decline and share of elderly is rising.
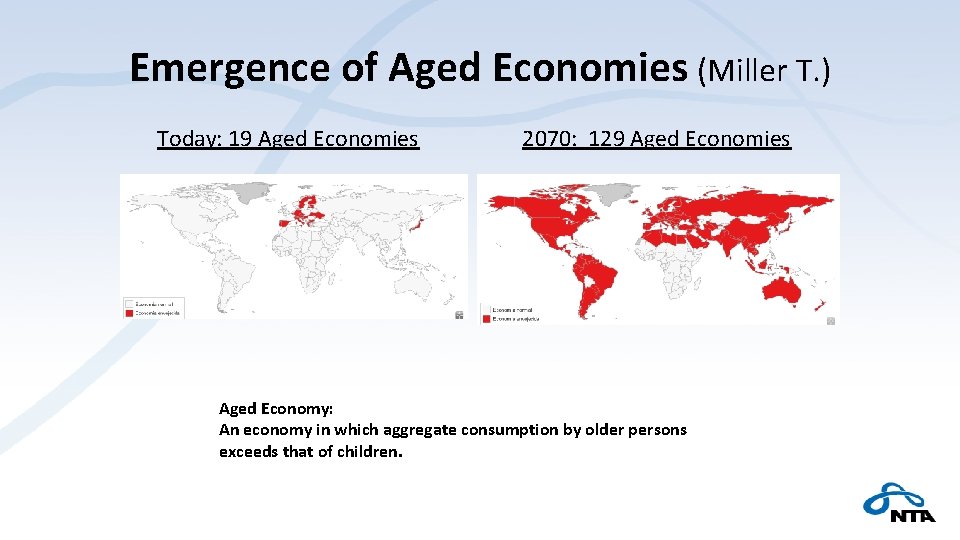
Emergence of Aged Economies (Miller T. ) Today: 19 Aged Economies 2070: 129 Aged Economies Aged Economy: An economy in which aggregate consumption by older persons exceeds that of children.
The Situation We Face Today: Unprecedented change Limited and incoherent economic data
Value of National Transfer Accounts (www. ntaccounts. org, Lee and Mason) • Fundamental question: how do different age groups, including children and the elderly, acquire and use economic resources? • How are access and use to resources influenced by changes in population age structure: – demographic dividends and economic growth? – generational equity? – gender equity? – financial markets and asset prices? – sustainability of public and private support systems? • What policies should be considered to best prepare for coming demographic change?
Gap in National Statistical Systems • System of National Accounts and other aggregate economic data provide little information about how different generations or age groups produce, consume, share, and accumulate economic resources. • National Transfer Accounts fills this gap.
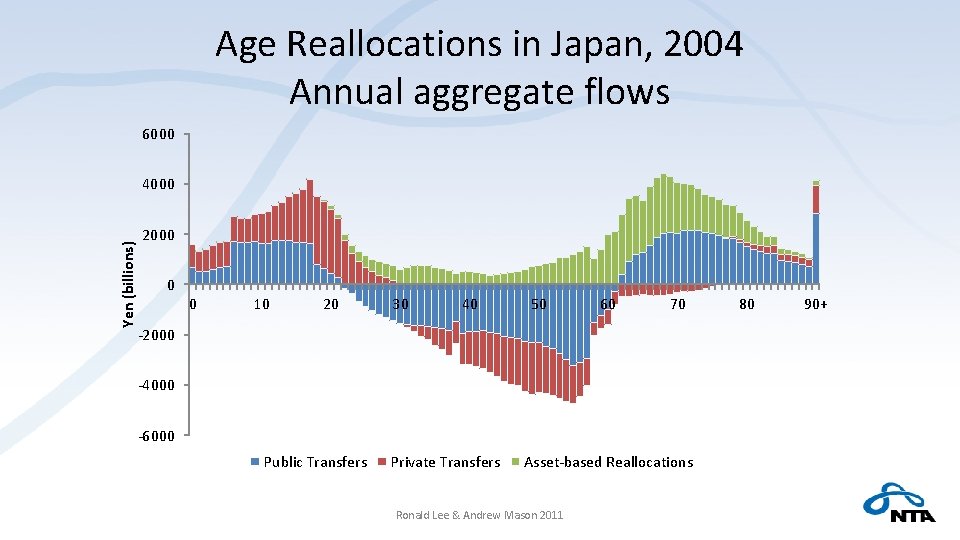
Age Reallocations in Japan, 2004 Annual aggregate flows 6000 Yen (billions) 4000 2000 0 0 10 20 30 40 50 60 70 ‐ 2000 ‐ 4000 ‐ 6000 Public Transfers Private Transfers Asset‐based Reallocations Ronald Lee & Andrew Mason 2011 80 90+
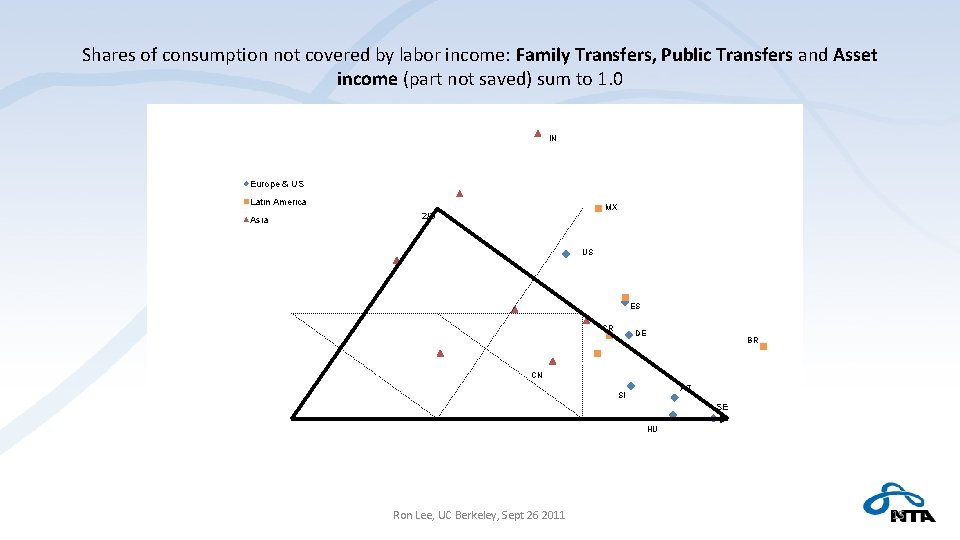
Shares of consumption not covered by labor income: Family Transfers, Public Transfers and Asset income (part not saved) sum to 1. 0 IN Europe & US Latin America T 2/3 AP Asia MX 1 US ES 1 J 2 C L T KR W CR DE BR CN AT SI SE Family 2 Ron Lee, UC Berkeley, Sept 26 2011 1 HU P 15
Two Demographic Dividends • First Dividend: During the demographic transition, population change leads to a rise in the number of effective workers relative to the number of effective consumers, the dividend phase. • Second Dividend: During and after the dividend phase, population change leads to a rise in worker productivity – through saving and investment – through education IUSSP IPC 2017 Andrew Mason
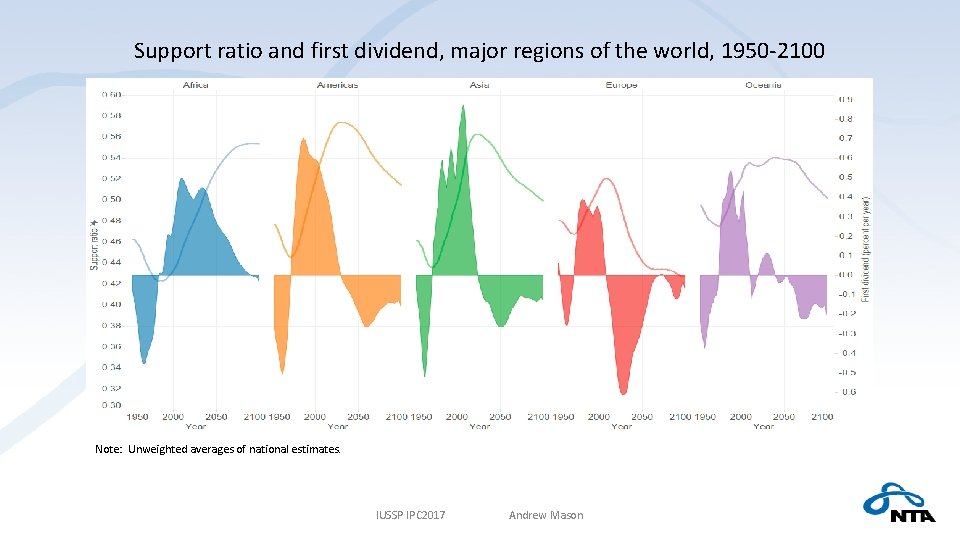
Support ratio and first dividend, major regions of the world, 1950‐ 2100 Note: Unweighted averages of national estimates. IUSSP IPC 2017 Andrew Mason
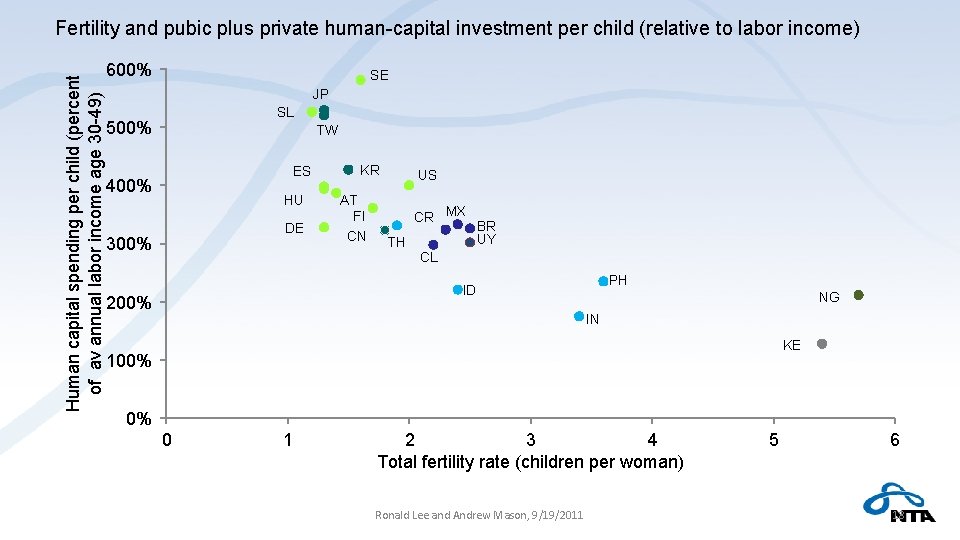
Human capital spending per child (percent of av annual labor income age 30 -49) Fertility and pubic plus private human-capital investment per child (relative to labor income) 600% SE JP SL 500% TW ES 400% HU DE 300% KR AT FI CN US CR MX TH BR UY CL PH ID 200% NG IN KE 100% 0% 0 1 2 3 4 Total fertility rate (children per woman) Ronald Lee and Andrew Mason, 9/19/2011 5 6 18
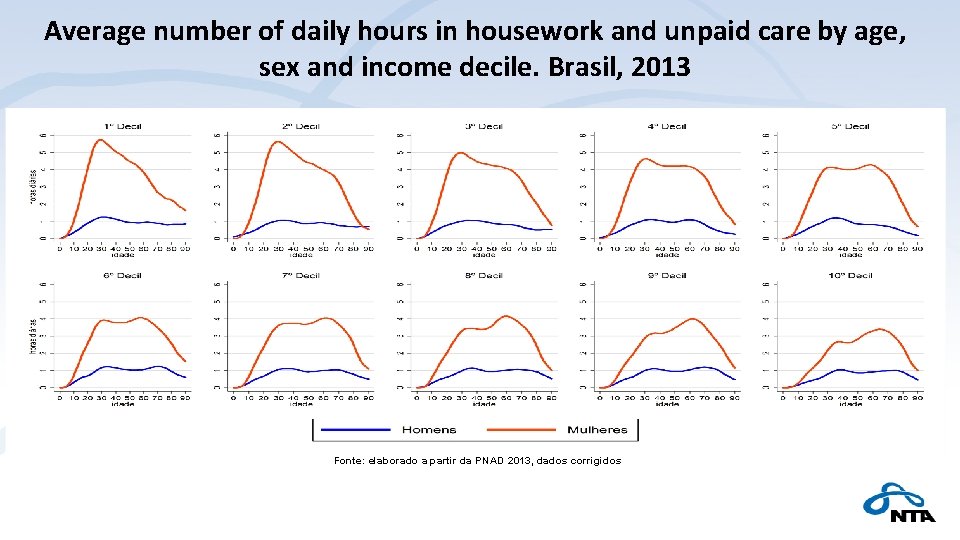
Average number of daily hours in housework and unpaid care by age, sex and income decile. Brasil, 2013 Fonte: elaborado a partir da PNAD 2013, dados corrigidos
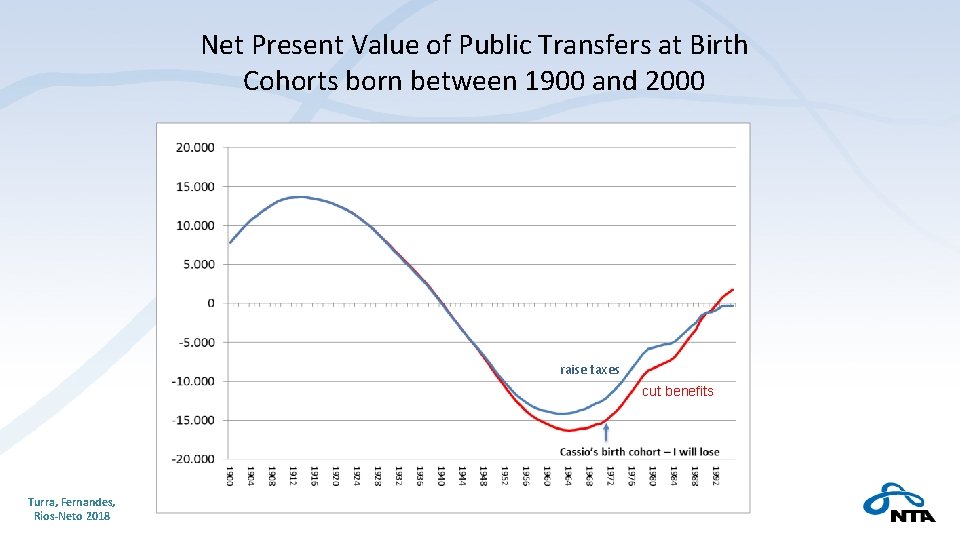
Net Present Value of Public Transfers at Birth Cohorts born between 1900 and 2000 raise taxes cut benefits Turra, Fernandes, Rios-Neto 2018
Opportunities and Challenges of Population Aging in Latin America and the Caribbean
1 st Act: The Opportunities (1970 -2030) > labor force first dividend: increasing ratio of producers per consumers + gender bonus + education bonus > fiscal support ratios Most of them are temporary! Almost over in LAC!
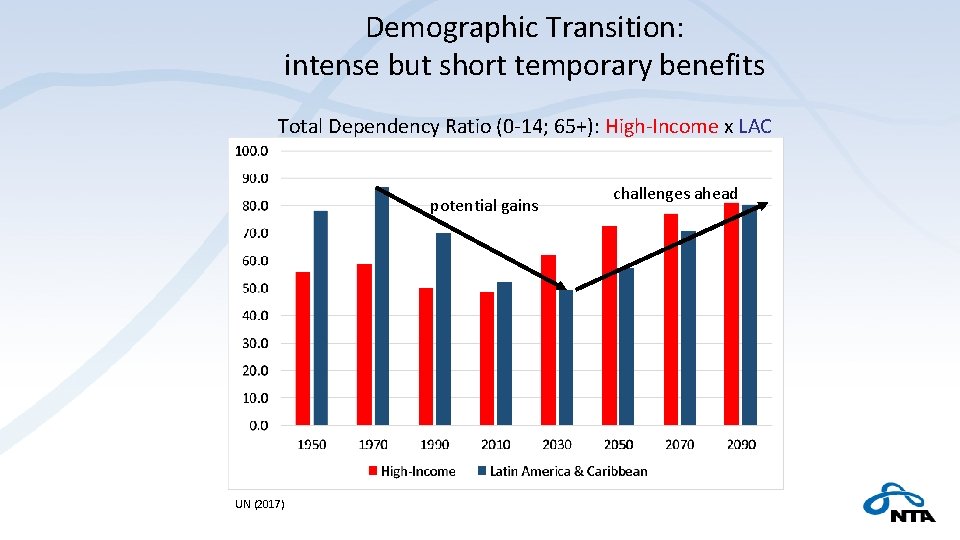
Demographic Transition: intense but short temporary benefits Total Dependency Ratio (0‐ 14; 65+): High‐Income x LAC potential gains UN (2017) challenges ahead
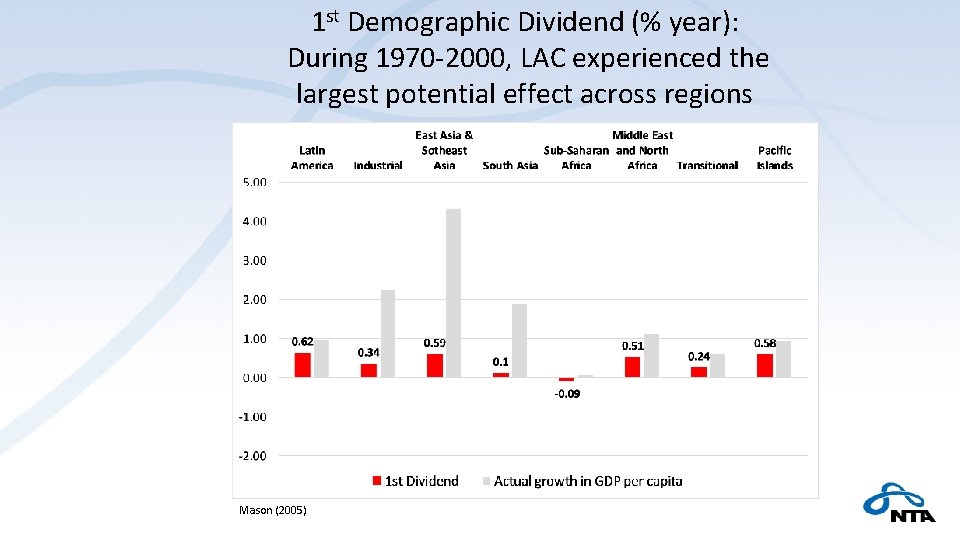
1 st Demographic Dividend (% year): During 1970‐ 2000, LAC experienced the largest potential effect across regions Mason (2005)
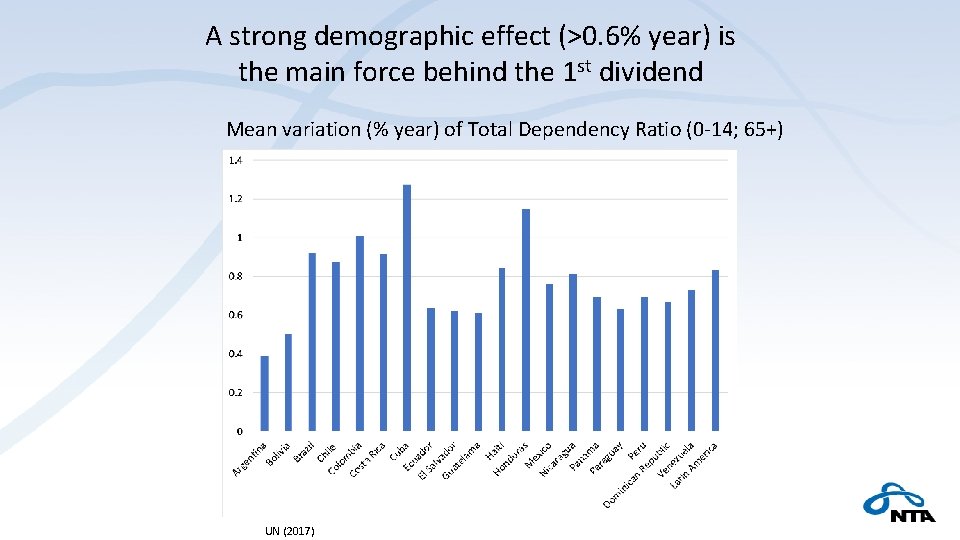
A strong demographic effect (>0. 6% year) is the main force behind the 1 st dividend Mean variation (% year) of Total Dependency Ratio (0‐ 14; 65+) UN (2017)
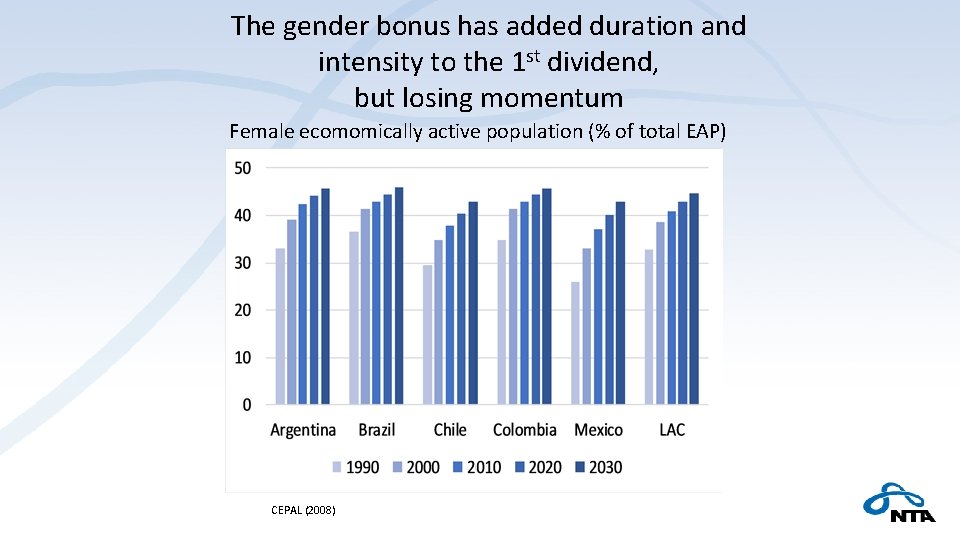
The gender bonus has added duration and intensity to the 1 st dividend, but losing momentum Female ecomomically active population (% of total EAP) CEPAL (2008)
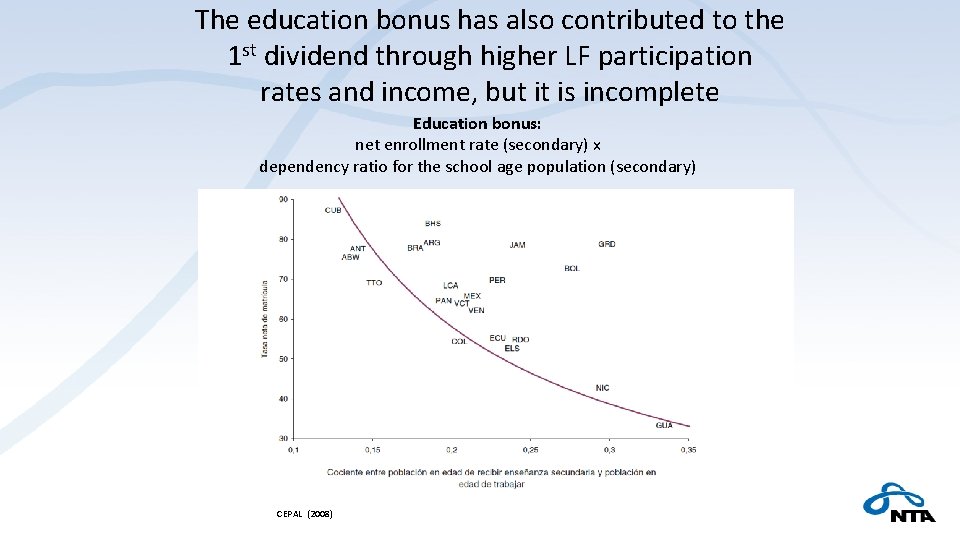
The education bonus has also contributed to the 1 st dividend through higher LF participation rates and income, but it is incomplete Education bonus: net enrollment rate (secondary) x dependency ratio for the school age population (secondary) CEPAL (2008)
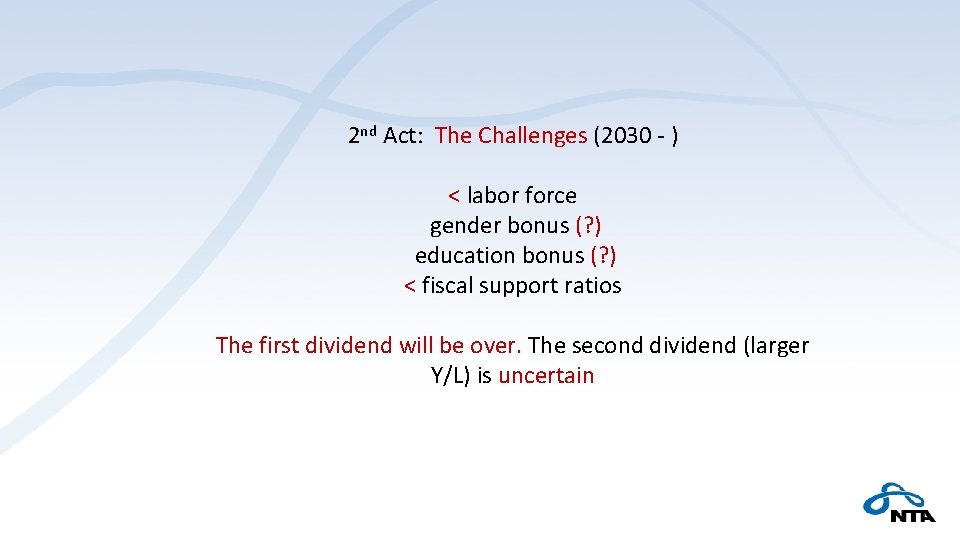
2 nd Act: The Challenges (2030 ‐ ) < labor force gender bonus (? ) education bonus (? ) < fiscal support ratios The first dividend will be over. The second dividend (larger Y/L) is uncertain
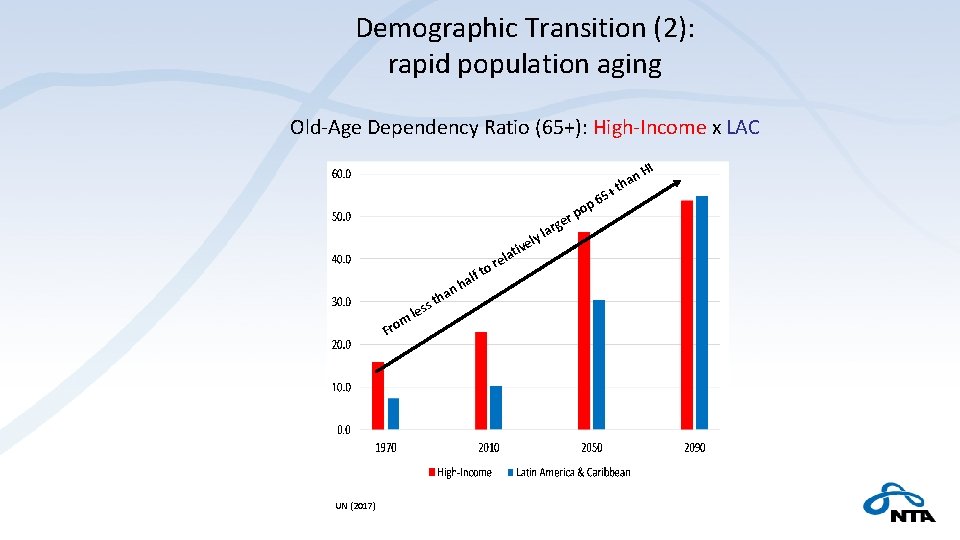
Demographic Transition (2): rapid population aging Old‐Age Dependency Ratio (65+): High‐Income x LAC op p er iv arg l y el m Fro UN (2017) l t ess ha alf nh to at rel + 65 th H an I
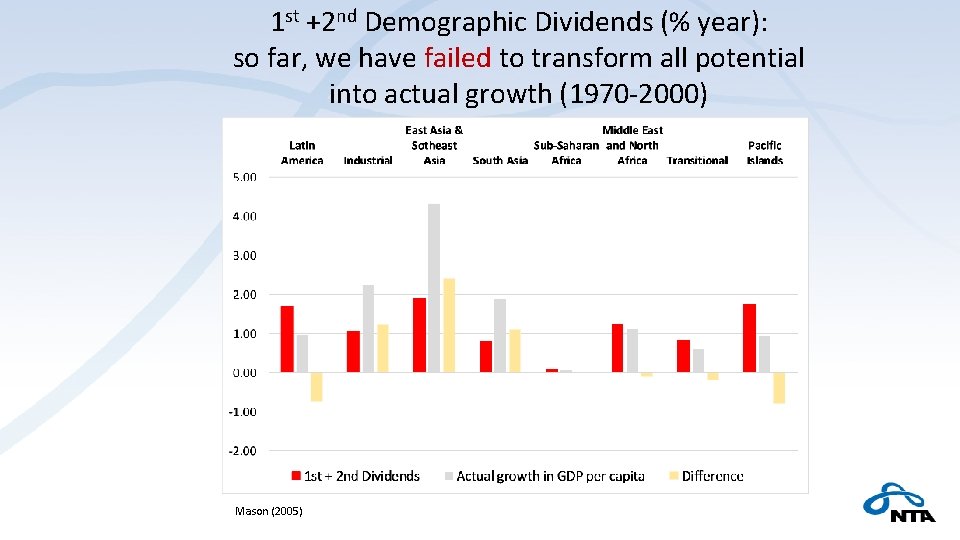
1 st +2 nd Demographic Dividends (% year): so far, we have failed to transform all potential into actual growth (1970‐ 2000) Mason (2005)
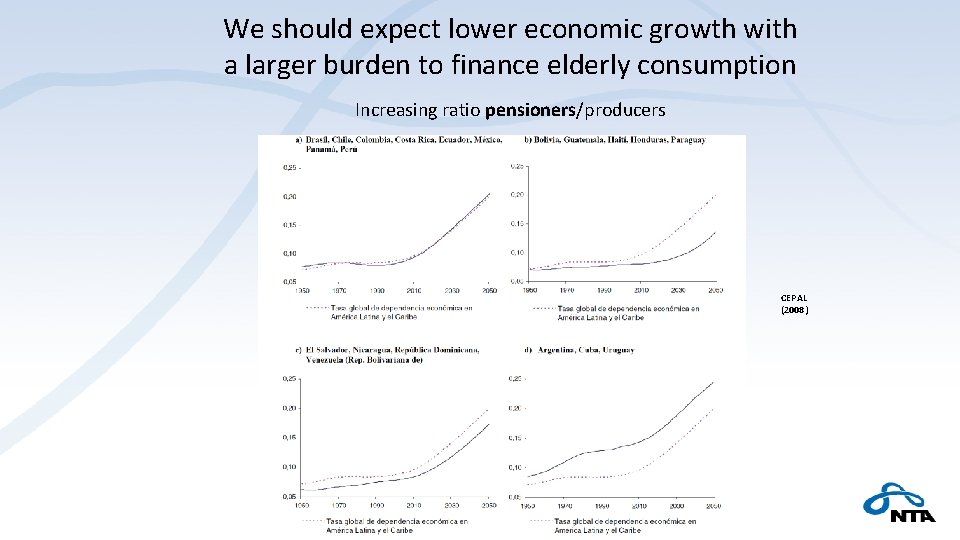
We should expect lower economic growth with a larger burden to finance elderly consumption Increasing ratio pensioners/producers CEPAL (2008)
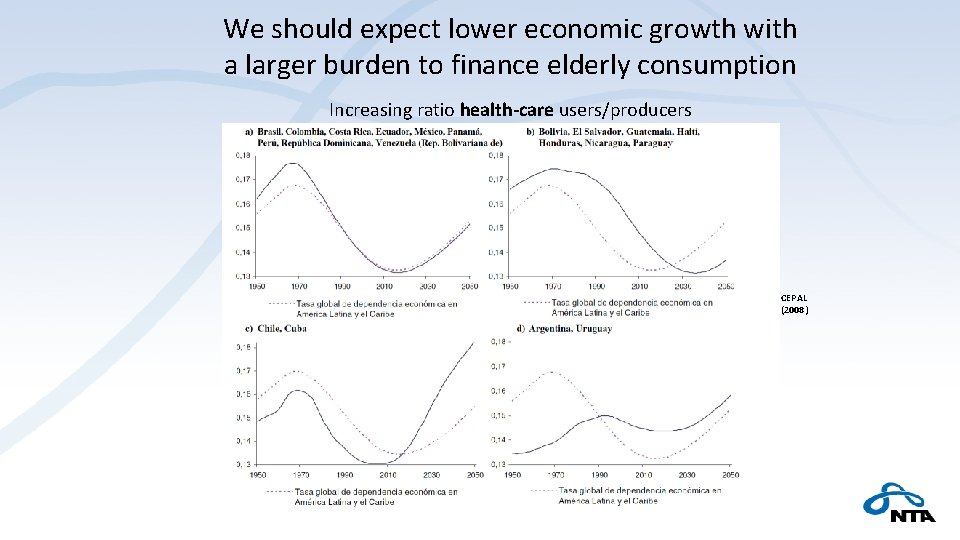
We should expect lower economic growth with a larger burden to finance elderly consumption Increasing ratio health-care users/producers CEPAL (2008)
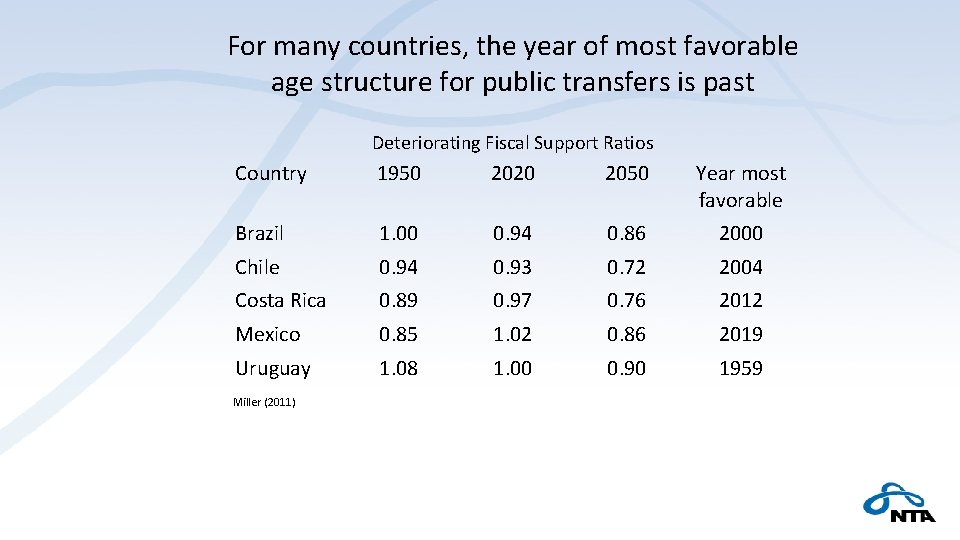
For many countries, the year of most favorable age structure for public transfers is past Deteriorating Fiscal Support Ratios Country 1950 2020 2050 Year most favorable Brazil 1. 00 0. 94 0. 86 2000 Chile 0. 94 0. 93 0. 72 2004 Costa Rica 0. 89 0. 97 0. 76 2012 Mexico 0. 85 1. 02 0. 86 2019 Uruguay 1. 08 1. 00 0. 90 1959 Miller (2011)
Achieve faster productivity growth: ‐ better quality of education ‐ technology absorption ‐ more efficient allocation of resources (economic sectors) Mitigate labor force reduction: ‐ better quality of education ‐ larger investment in health at younger/adult ages ‐ promote international migration to the region ‐ redefine age at retirement ‐ promote gender equity ‐ reduce inequalities or population aging will be a big challenge in LAC very soon!
El doble desafío (Miller, T) • Cuentas Nacionales de Transferencias pueden ayudar a enfrentar el doble desafío de nuestra región: el envejecimiento de la población y la desigualdad. . . • . . . mediante la medición de las relaciones económicas dentro de una economía nacional: entre jóvenes y adultos mayores, entre ricos y pobres, entre hombres y mujeres.
- Slides: 35