Methods of data collection 1 Methods of data



- Slides: 85
Methods of data collection 1
Methods of data collection An ideal data collection procedure should be clear, unbiased, reliable and valid. There are four methods of data collection 1. Observation(measurement) 2. Interview(questionnaire) 3. Use of documentary sources 4. Others(FGDs, life history, case studies etc) 2
Methods…… Observation- it is technique that involves systematically selecting, watching and recording behaviors of people or other phenomena and aspects of the population. e. g. simple visual observation use of high level machines(X-ray, ultrasound) clinical examination etc 3
Methods…… Advantage- it gives relatively more accurate data on behavior and activities Disadvantage- investigator’s(observers)bias -it requires more resource and skilled human power 4
Methods…… Interview(questionnaire)- there are different types of interview they are face to face, self administered questionnaire, telephone interview and postal/mail method Questionnaires- are written documents which instruct the reader or listener to answer the question written for the purpose of a particular research. Interviewee(responder), interviewer(asker) Two types of questionnaire -structured -unstructured 5
Methods…… Face to face interview Advantage-both the interviewer and respondent are together - clarification about the question is possible Disadvantage- it requires an interviewer skill -time and financial problem 6
Methods…… Self administered questionnaires Advantage-it may be sent to the respondent by using post office -are cheapest because there is no need of trained person to collect data - It can be coordinated being in central position 7
Methods…… Disadvantage-there may be low respondent rate -requires intense follow up to set a high response rate -no assurance the questionnaire were answered by the intended respondent -incomplete questionnaire either due to omission or invalid response - uneducated people can not fill it 8
Methods…… Telephone interview Advantage-less expensive in terms of time and money -an interviewer can help the respondent in case of difficulties 9
Methods…… Disadvantage- under representation of the groups without telephone - Problems with unlisted telephone numbers - Respondent may be substituted by another - Repeated call may be necessary Mail /postal method-low response rate - under representation of the illiterate individuals 10
Methods…… Use of documentary records Such as clinical and personal records, death certificates, published mortality statistics, census publications etc are known as documentary sources e. g. publications of CSA, MOH, newspapers and journals international publications like world bank, UNICEF and records of hospitals or any health institutions 11
Methods…… Others like FGDs, case history and life history are not commonly used but they used as a supplement FGDs is used when we conduct a qualitative research 12
Common problems in collecting data • Language barrier • Lack of adequate time • Inadequately trained and experienced statistician • Expense • Biases • Suspicion • Cultural norms 13
Drafting the questionnaires Ø Is the questionnaire is the best method to collect my data? Ø List the major areas you wish to cover i. e. identify the variables you want to measure Ø The wording and sequence of information should be designed to motivate respondent Ø Do pretest to check weather the questionnaire is understandable or not by both the interviewer as well as the respondent 14
How we can select study variable? • Discuss the problem with friends or colleagues • Literature review • Consult authorities(experts) • Discuss the problem with focus groups in the population e. g. key informants like edir and religious leaders 15
Types of questions There are two types of questions 1. Open ended(free-response) 2. Close ended(restricted choice) open ended e. g. in your opinion what is the biggest barrier in getting your hospitals ANC unit patient 16
Types…… Advantages-it stimulates free thoughts of respondent Helpful to obtain information on sensitive issues Disadvantages- there may problem of recalling answers It is not suitable for mailed question Answers are difficult to code for statistical analysis The problem of poor hand writing 17
Types…… Close ended- provides fixed answers e. g. including your present visit how many times did you visit this hospital in the past two yrs? A. Once B. Twice C. 3 x D. 6 x E. >6 Advantage-suitable for many forms of statistical analysis Not difficult to code Disadvantage-limits a variety of details 18
Types…… Partially open ended question Advantage- provides alternatives if certain option are over looked it identifies missing categories for future use Disadvantage- respondent may ignore other options e. g. if the house hold lost any of its members due to death in the last 12 months what was the cause of death. 1. Malaria 2. famine/hunger 3. car 19
Types…… The selection of a method is based on practical considerations such as: ü The need for resources ü The acceptability of the procedures to the subjects ü The probability that the method will provide a good coverage 20
Types…… How to choose an accurate and practicable method Ø from review of previous methodological studies or experiences in other studies Ø Through testing proposed methods on a small scale approach i. e. pre-test or pilot study to determine clarity of questions, the length of the time that an interview will take, how acceptable and convenient the proposed method. 21
Descriptive Statistics Ø Techniques used to organize and summarize a set of data in a concise way. – Organization of data – Summarization of data – Presentation of data Ø Numbers that have not been summarized and organized are called raw data 22
Descriptive……. . Descriptive statistics include: üTables üGraphs üNumerical summary measures - Measures of central tendency - Measures of variability 23
Descriptive……. . v Before summarization and organization, we need to know the types of variables and measurement scales of our data. v Before displaying or analyzing data, classify the variables into their different types 24
METHODS OF DATA ORGANIZATION AND PRESENTATION 25
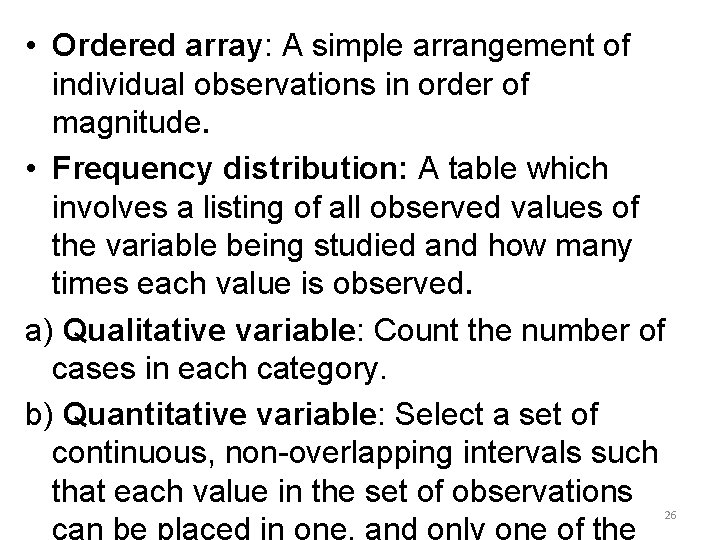
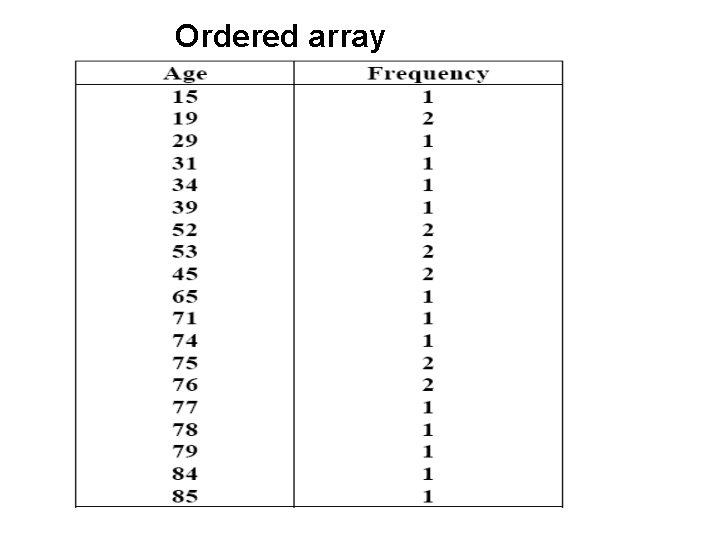
• Ordered array: A simple arrangement of individual observations in order of magnitude. • Frequency distribution: A table which involves a listing of all observed values of the variable being studied and how many times each value is observed. a) Qualitative variable: Count the number of cases in each category. b) Quantitative variable: Select a set of continuous, non-overlapping intervals such that each value in the set of observations 26
Ordered array
Methods…. . Frequency distribution: A table which has a list of each of the possible values that the data can assume along with the number of times each value occurs. The actual summarization and organization of data starts from frequency distribution. 28
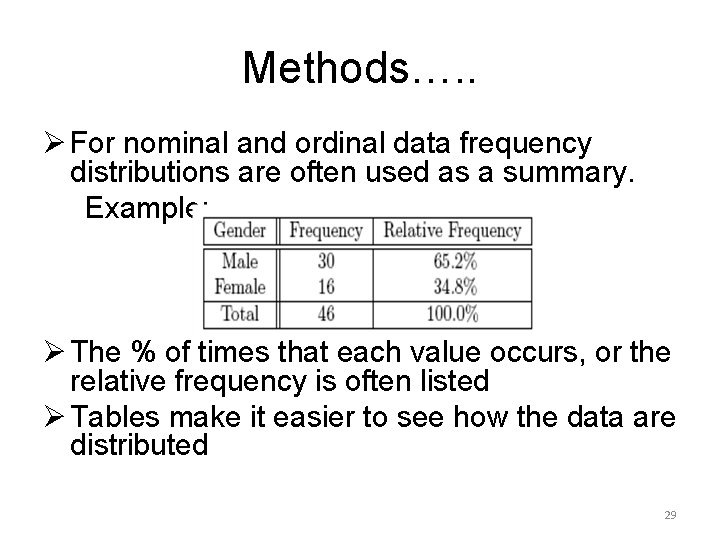
Methods…. . Ø For nominal and ordinal data frequency distributions are often used as a summary. Example: Ø The % of times that each value occurs, or the relative frequency is often listed Ø Tables make it easier to see how the data are distributed 29
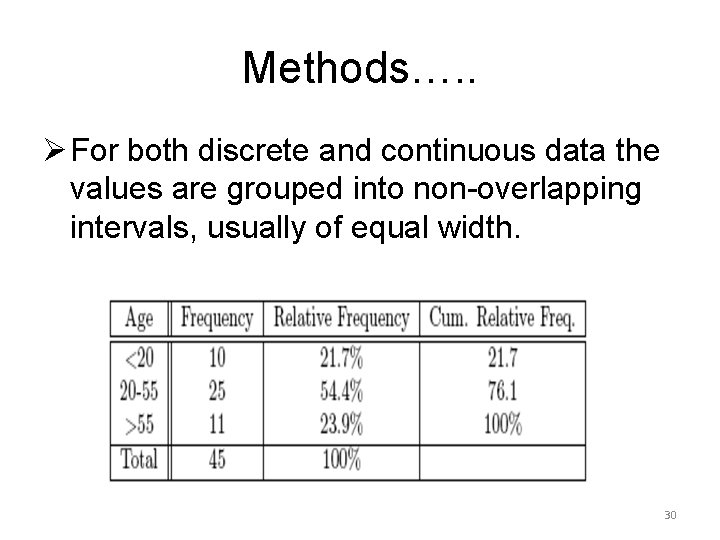
Methods…. . Ø For both discrete and continuous data the values are grouped into non-overlapping intervals, usually of equal width. 30
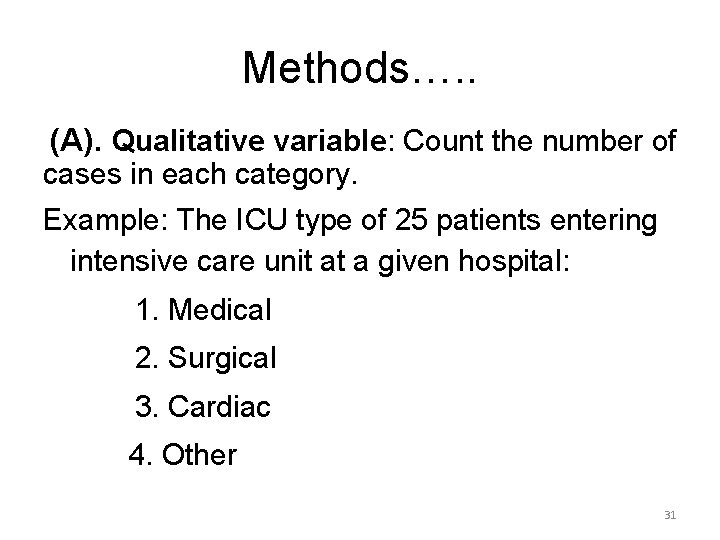
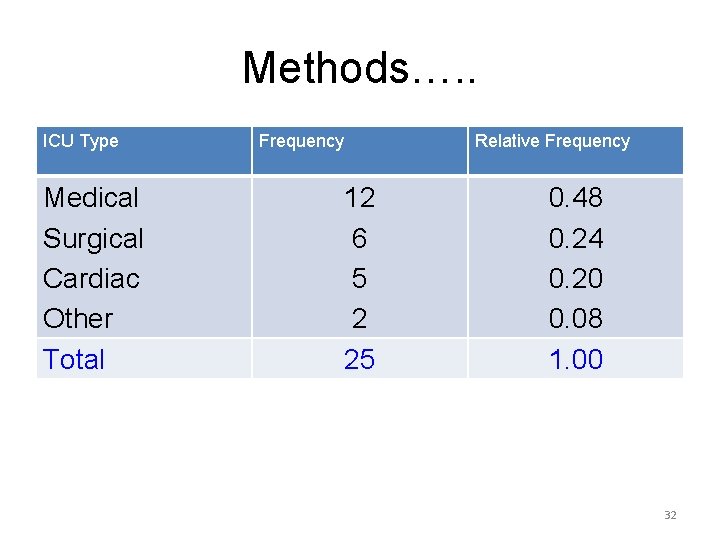
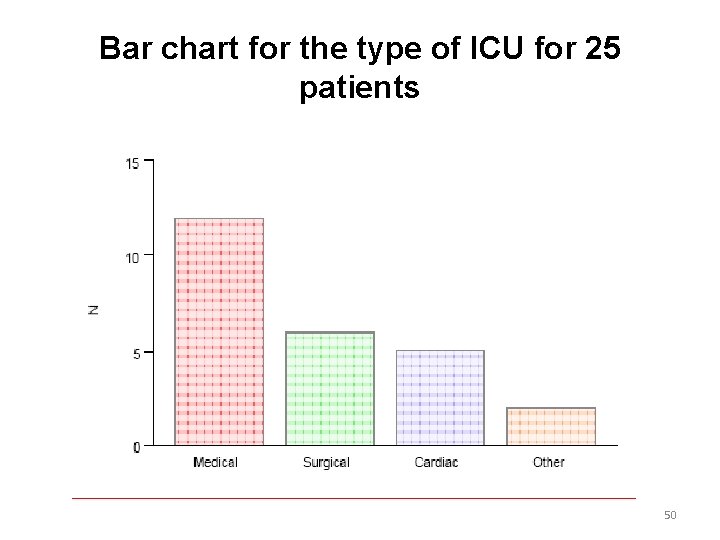
Methods…. . (A). Qualitative variable: Count the number of cases in each category. Example: The ICU type of 25 patients entering intensive care unit at a given hospital: 1. Medical 2. Surgical 3. Cardiac 4. Other 31
Methods…. . ICU Type Medical Surgical Cardiac Other Total Frequency Relative Frequency 12 6 5 2 25 0. 48 0. 24 0. 20 0. 08 1. 00 32
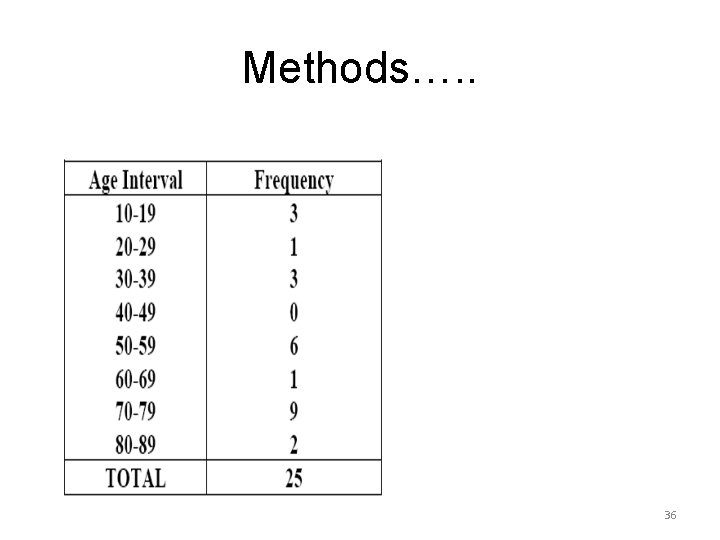
Methods…. . (B) Quantitative variable: ü Select a set of continuous, nonoverlapping intervals such that each value can be placed in one, and only one, of the intervals. ü The first consideration is how many intervals to include 33
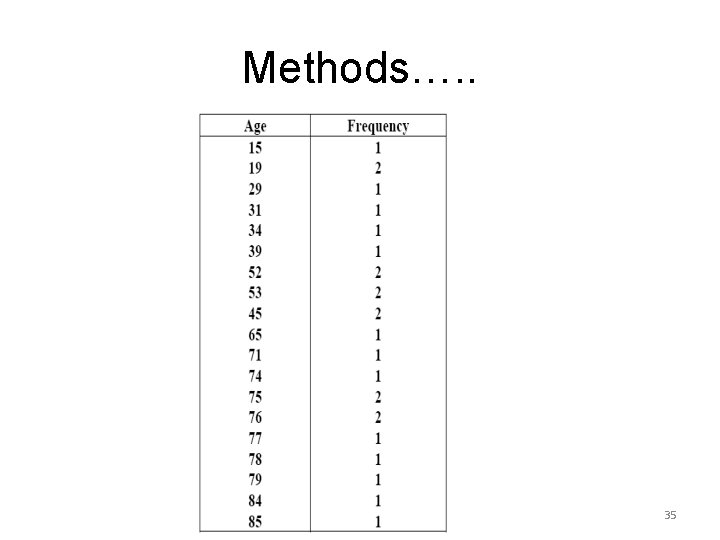
Methods…. . Ø To group a set of observations we select a continuous, non-overlapping intervals such that each value in the set of observations can be placed in one and only one, of the intervals. 34
Methods…. . 35
Methods…. . 36
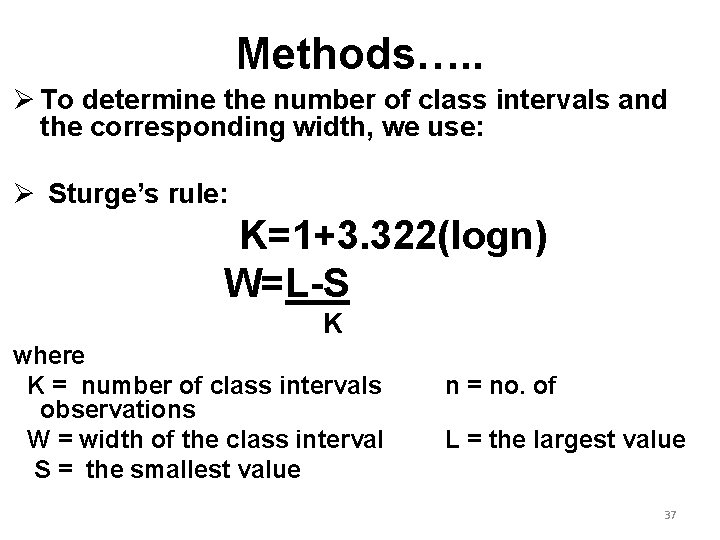
Methods…. . Ø To determine the number of class intervals and the corresponding width, we use: Ø Sturge’s rule: K=1+3. 322(logn) W=L-S K where K = number of class intervals observations W = width of the class interval S = the smallest value n = no. of L = the largest value 37
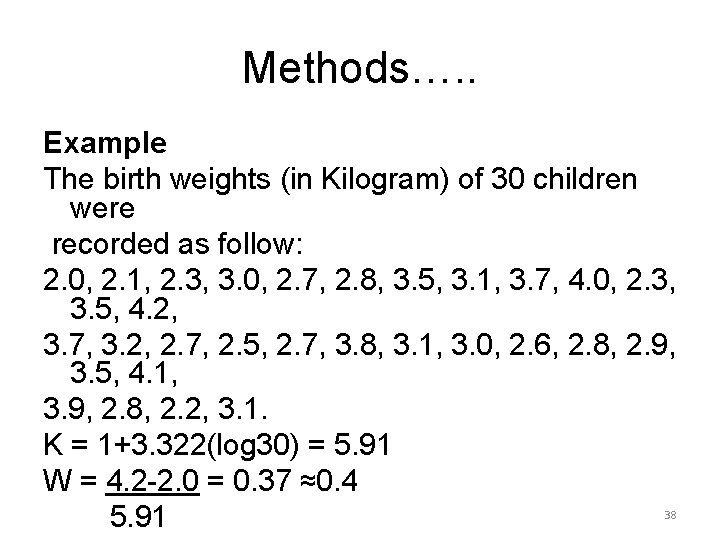
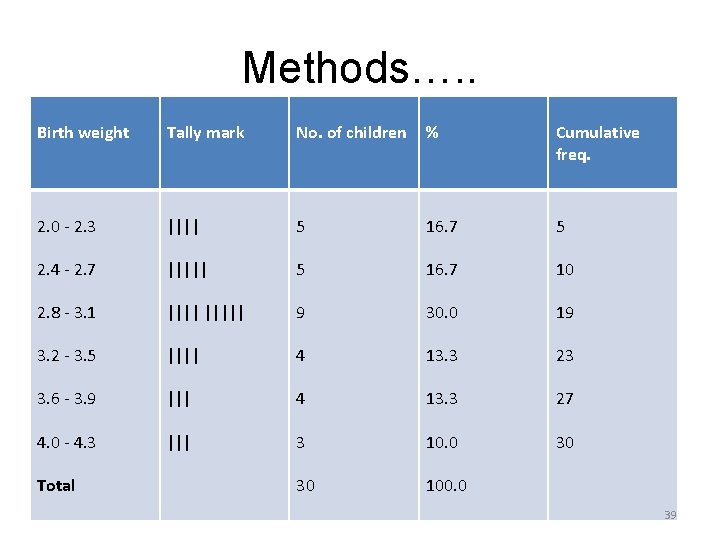
Methods…. . Example The birth weights (in Kilogram) of 30 children were recorded as follow: 2. 0, 2. 1, 2. 3, 3. 0, 2. 7, 2. 8, 3. 5, 3. 1, 3. 7, 4. 0, 2. 3, 3. 5, 4. 2, 3. 7, 3. 2, 2. 7, 2. 5, 2. 7, 3. 8, 3. 1, 3. 0, 2. 6, 2. 8, 2. 9, 3. 5, 4. 1, 3. 9, 2. 8, 2. 2, 3. 1. K = 1+3. 322(log 30) = 5. 91 W = 4. 2 -2. 0 = 0. 37 ≈0. 4 5. 91 38
Methods…. . Birth weight Tally mark No. of children % Cumulative freq. 2. 0 - 2. 3 |||| 5 16. 7 5 2. 4 - 2. 7 ||||| 5 16. 7 10 2. 8 - 3. 1 ||||| 9 30. 0 19 3. 2 - 3. 5 |||| 4 13. 3 23 3. 6 - 3. 9 ||| 4 13. 3 27 4. 0 - 4. 3 ||| 3 10. 0 30 30 100. 0 Total 39
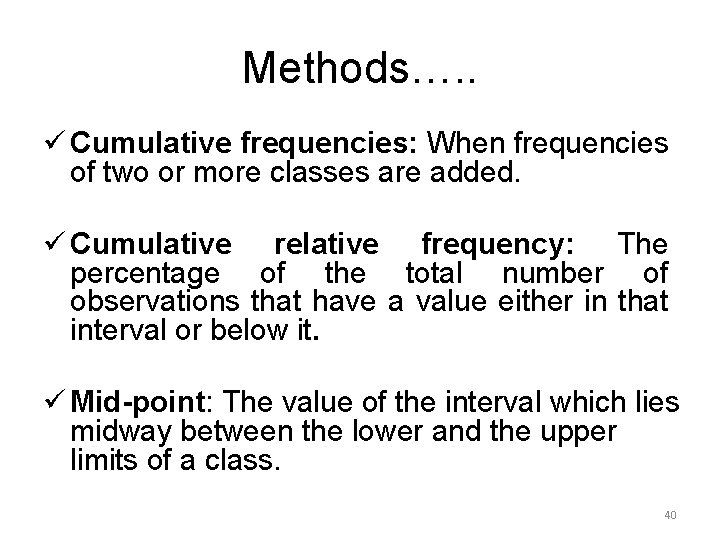
Methods…. . ü Cumulative frequencies: When frequencies of two or more classes are added. ü Cumulative relative frequency: The percentage of the total number of observations that have a value either in that interval or below it. ü Mid-point: The value of the interval which lies midway between the lower and the upper limits of a class. 40
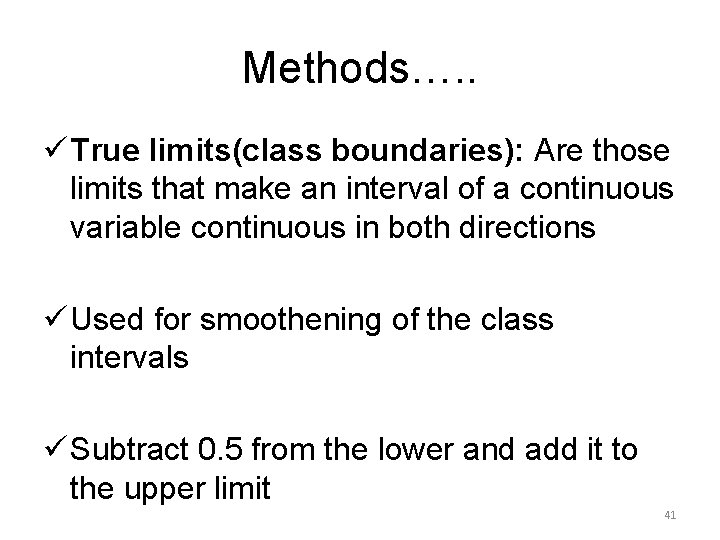
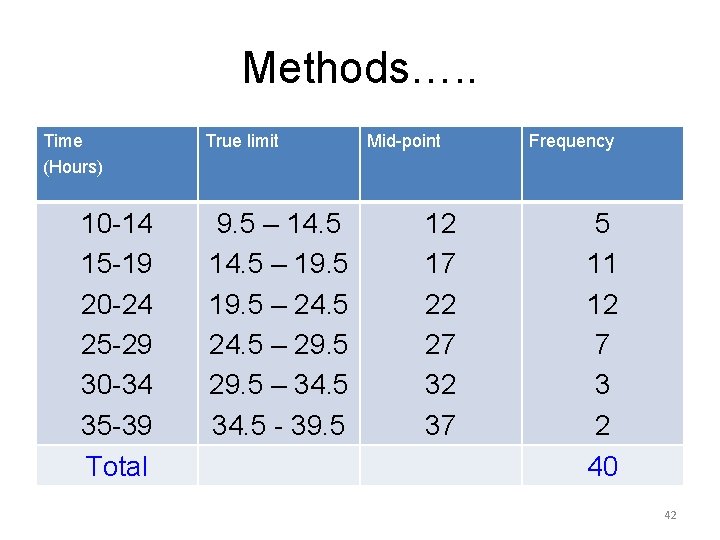
Methods…. . ü True limits(class boundaries): Are those limits that make an interval of a continuous variable continuous in both directions ü Used for smoothening of the class intervals ü Subtract 0. 5 from the lower and add it to the upper limit 41
Methods…. . Time (Hours) 10 -14 15 -19 20 -24 25 -29 30 -34 35 -39 Total True limit 9. 5 – 14. 5 – 19. 5 – 24. 5 – 29. 5 – 34. 5 - 39. 5 Mid-point 12 17 22 27 32 37 Frequency 5 11 12 7 3 2 40 42
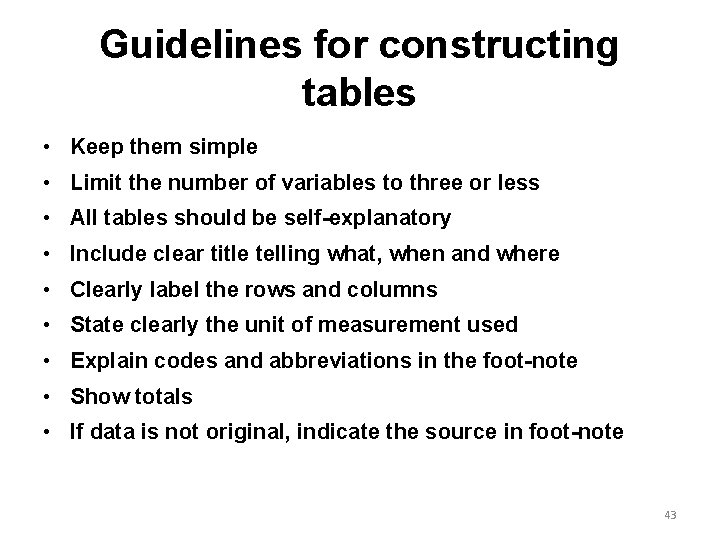
Guidelines for constructing tables • Keep them simple • Limit the number of variables to three or less • All tables should be self-explanatory • Include clear title telling what, when and where • Clearly label the rows and columns • State clearly the unit of measurement used • Explain codes and abbreviations in the foot-note • Show totals • If data is not original, indicate the source in foot-note 43
Types of tables 1. Simple or one way table: involves only a single variable 2. Two-way table: involves two characteristics and is formed when either caption or the stub is divided into two parts 3. Higher order table: three or more characteristics in a single table 44
Diagrammatic Representation 45
Advantages of diagrams Ø Ø Ø Much attractive than numerical facts Required information can be obtained in Less time without mental strain. Facilitates comparison Pattern of change in data can be detected easily Stays in memory for long time 46
Limitations of diagrams v. Not an alternative to tabulation v No accuracy ensured , gives only approximate idea v Small/minute details can not be inferred 47
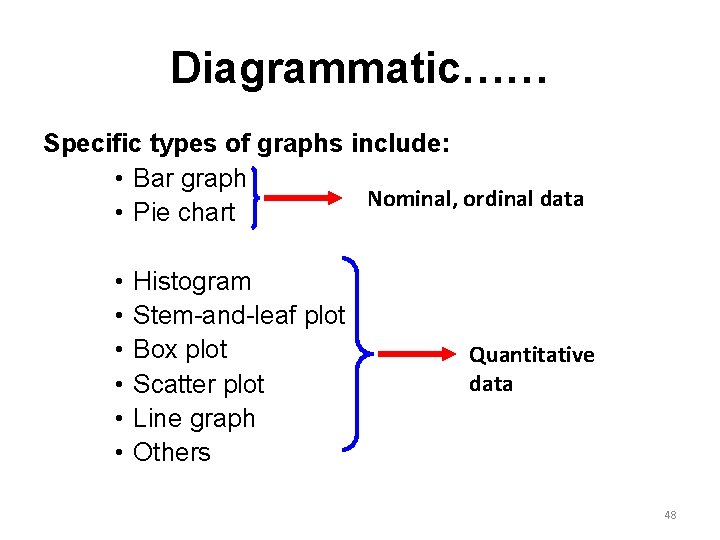
Diagrammatic…… Specific types of graphs include: • Bar graph Nominal, ordinal data • Pie chart • • • Histogram Stem-and-leaf plot Box plot Scatter plot Line graph Others Quantitative data 48
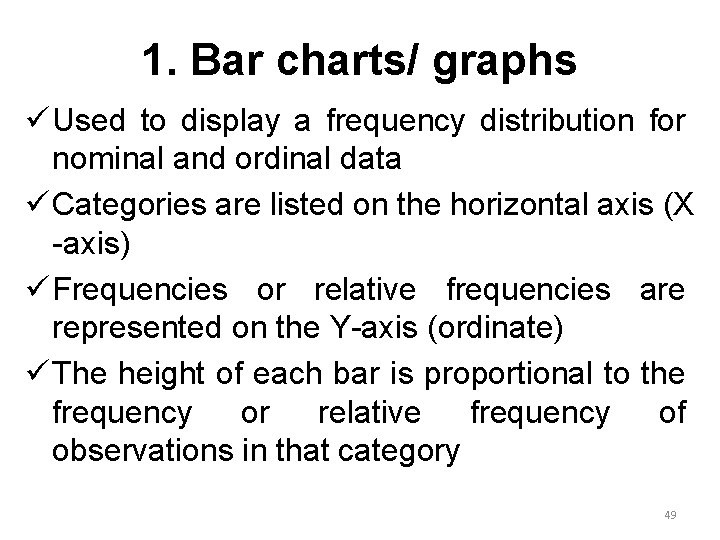
1. Bar charts/ graphs ü Used to display a frequency distribution for nominal and ordinal data ü Categories are listed on the horizontal axis (X -axis) ü Frequencies or relative frequencies are represented on the Y-axis (ordinate) ü The height of each bar is proportional to the frequency or relative frequency of observations in that category 49
Bar chart for the type of ICU for 25 patients 50
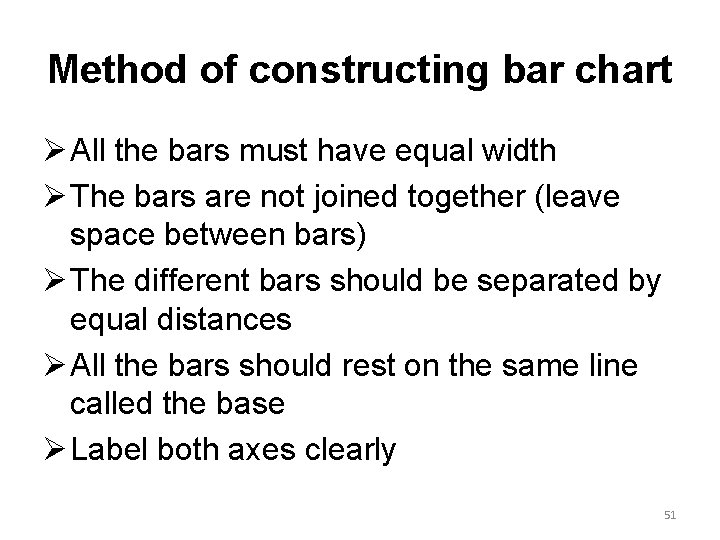
Method of constructing bar chart Ø All the bars must have equal width Ø The bars are not joined together (leave space between bars) Ø The different bars should be separated by equal distances Ø All the bars should rest on the same line called the base Ø Label both axes clearly 51
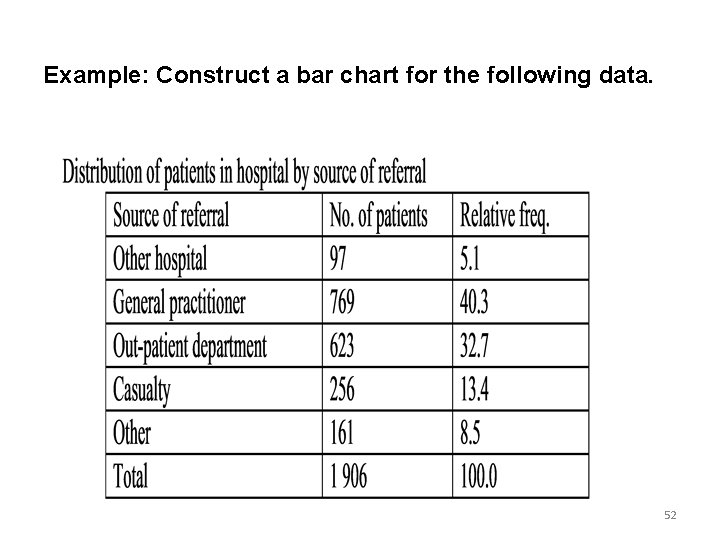
Example: Construct a bar chart for the following data. 52
Bar…. . 53
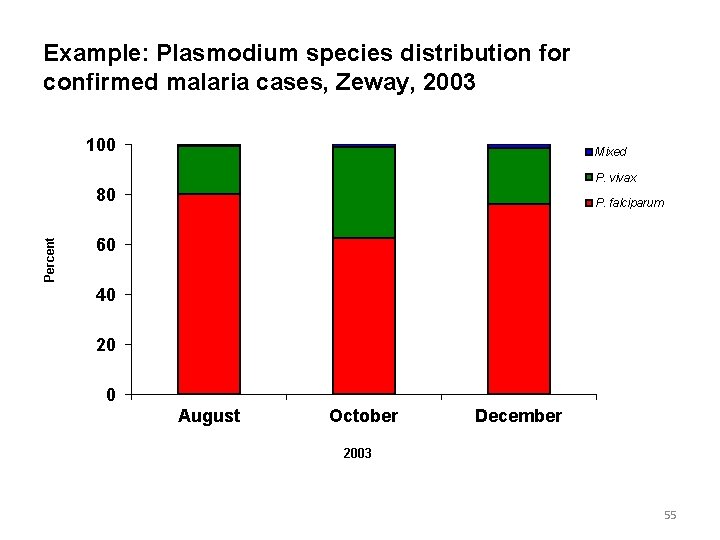
2. Sub-divided bar chart v. If there are different quantities forming the sub-divisions of the totals, simple bars may be sub-divided in the ratio of the various sub-divisions to exhibit the relationship of the parts to the whole. v. The order in which the components are shown in a “bar” is followed in all bars used in the diagram. v. This can be actual or percentage component 54
Example: Plasmodium species distribution for confirmed malaria cases, Zeway, 2003 100 Mixed P. vivax Percent 80 P. falciparum 60 40 20 0 August October December 2003 55
3. Multiple bar graph ü Bar charts can be used to represent the relationships among more than two variables. ü The following figure shows the relationship between children’s reports of breathlessness and cigarette smoking by themselves and their parents. 56
Multiple…. We can see from the graph quickly that the prevalence of the symptoms increases both with the child’s smoking and with that of their parents. 57
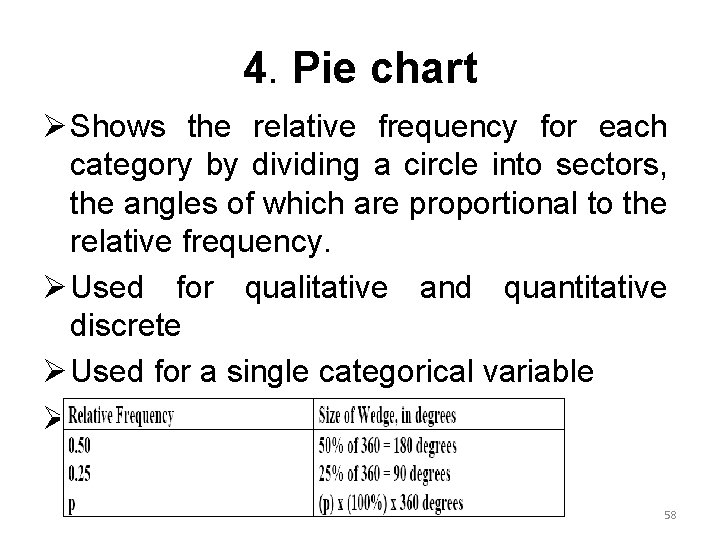
4. Pie chart Ø Shows the relative frequency for each category by dividing a circle into sectors, the angles of which are proportional to the relative frequency. Ø Used for qualitative and quantitative discrete Ø Used for a single categorical variable Ø Use percentage distributions 58
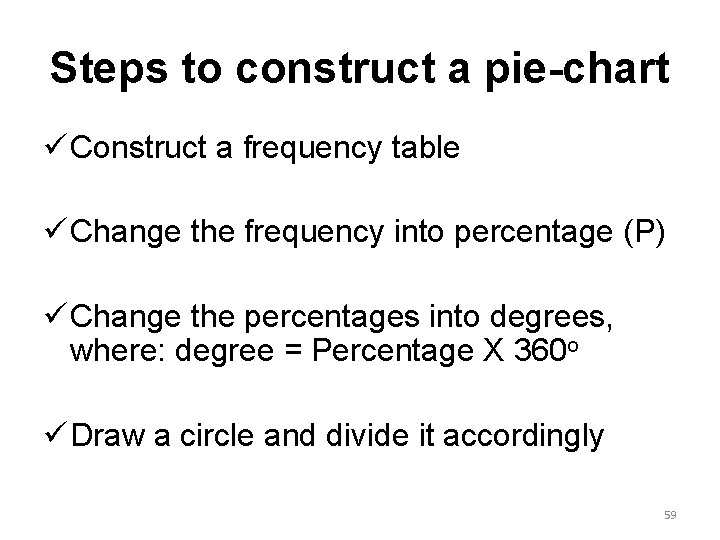
Steps to construct a pie-chart ü Construct a frequency table ü Change the frequency into percentage (P) ü Change the percentages into degrees, where: degree = Percentage X 360 o ü Draw a circle and divide it accordingly 59
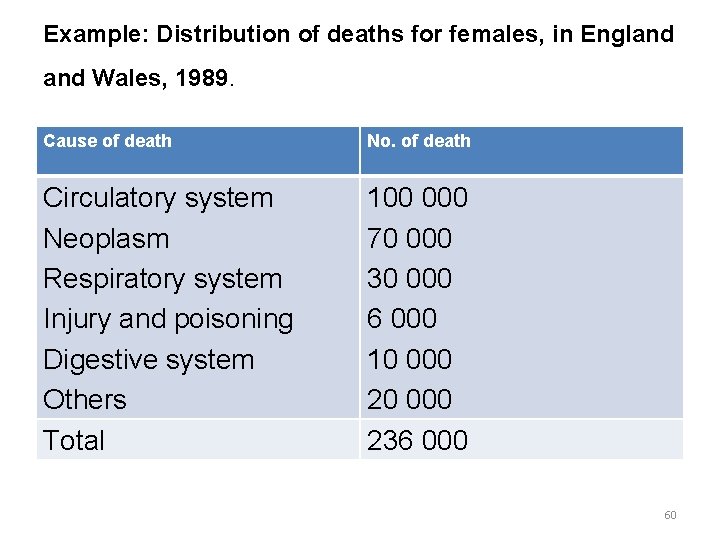
Example: Distribution of deaths for females, in England Wales, 1989. Cause of death No. of death Circulatory system Neoplasm Respiratory system Injury and poisoning Digestive system Others Total 100 000 70 000 30 000 6 000 10 000 236 000 60
Pie…. 61
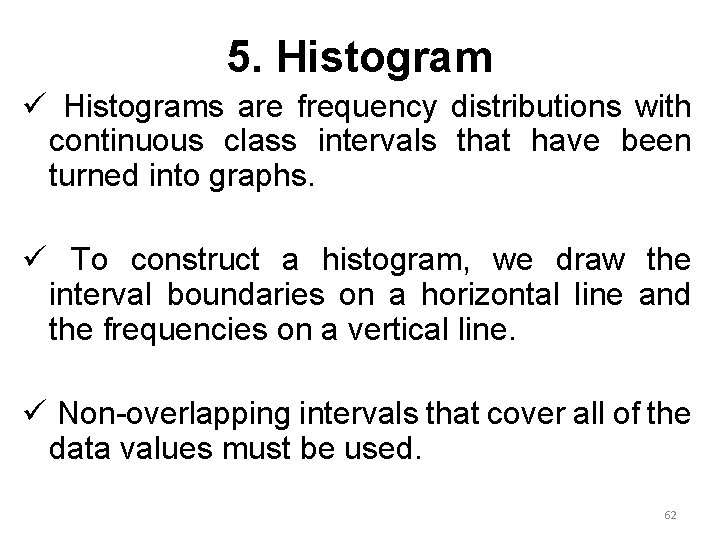
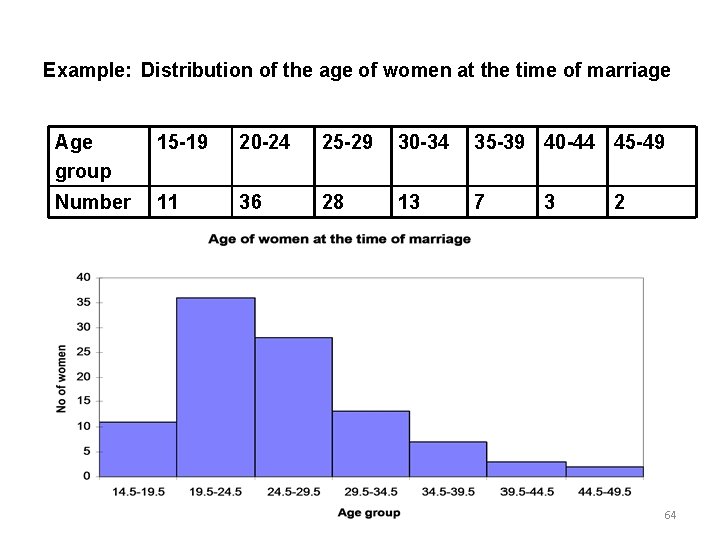
5. Histogram ü Histograms are frequency distributions with continuous class intervals that have been turned into graphs. ü To construct a histogram, we draw the interval boundaries on a horizontal line and the frequencies on a vertical line. ü Non-overlapping intervals that cover all of the data values must be used. 62
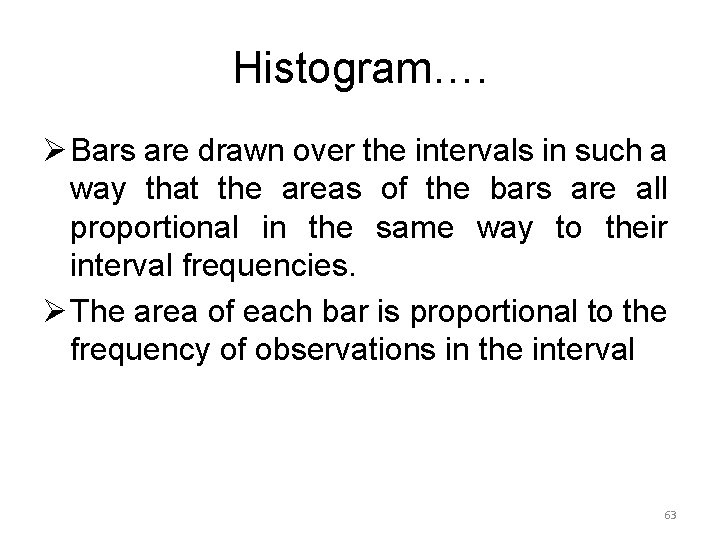
Histogram…. Ø Bars are drawn over the intervals in such a way that the areas of the bars are all proportional in the same way to their interval frequencies. Ø The area of each bar is proportional to the frequency of observations in the interval 63
Example: Distribution of the age of women at the time of marriage Age group 15 -19 20 -24 25 -29 30 -34 35 -39 40 -44 45 -49 Number 11 36 28 13 7 3 2 64
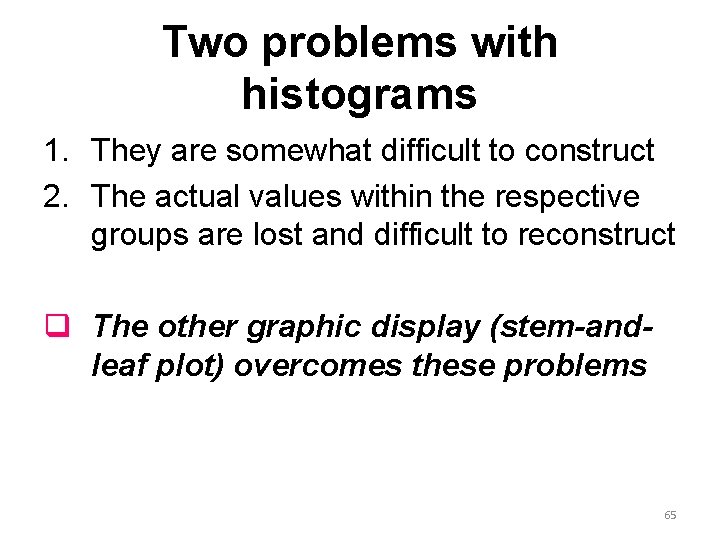
Two problems with histograms 1. They are somewhat difficult to construct 2. The actual values within the respective groups are lost and difficult to reconstruct q The other graphic display (stem-andleaf plot) overcomes these problems 65
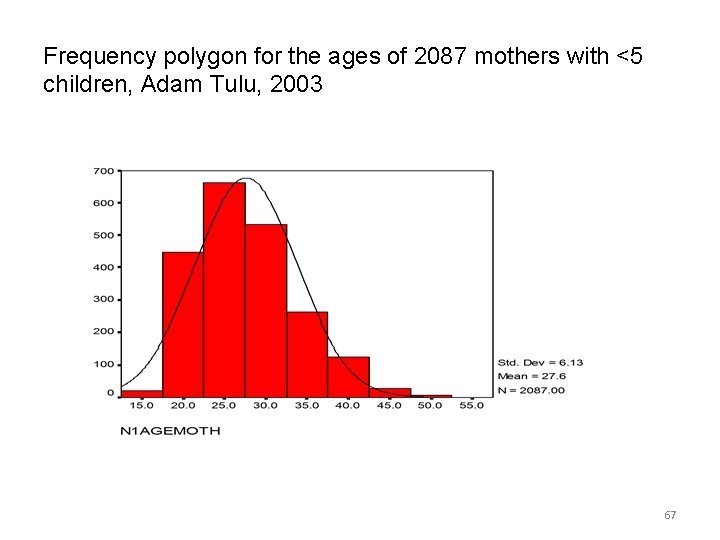
6. Frequency polygon/curve ü A frequency distribution can be portrayed graphically in yet another way by means of a frequency polygon. ü To draw a frequency polygon we connect the mid-point of the tops of the cells of the histogram by a straight line. ü The total area under the frequency polygon is equal to the area under the histogram ü Useful when comparing two or more frequency distributions by drawing them on the same diagram 66
Frequency polygon for the ages of 2087 mothers with <5 children, Adam Tulu, 2003 67
t can be also drawn without erecting rectangles by joining the top midpoints of the intervals representing the frequency of the classes as follows: 68
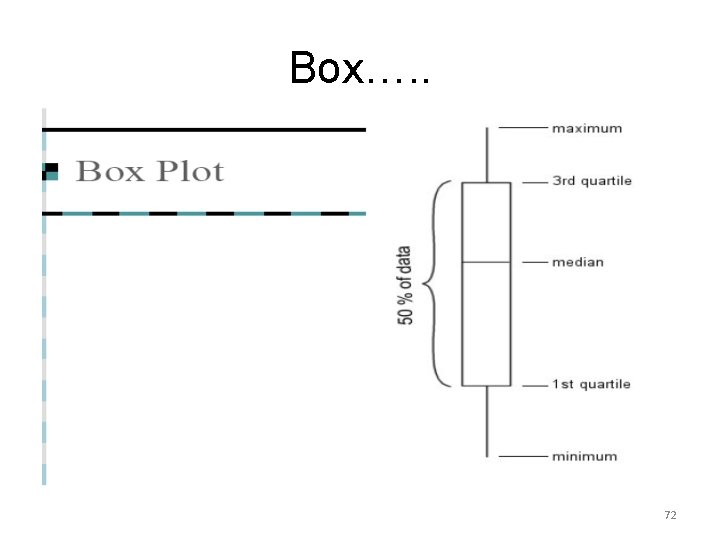
7. Box and Whisker Plot Ø It is another way to display information when the objective is to illustrate certain locations (skewness) in the distribution. Ø Can be used to display a set of discrete or continuous observations using a single vertical axis – only certain summaries of the data are shown 69
Box…. . ü A box is drawn with the top of the box at the third quartile (75%) and the bottom at the first quartile (25%). ü The location of the mid-point (50%) of the distribution is indicated with a horizontal line in the box. ü Finally, straight lines, or whiskers, are drawn from the centre of the top of the box to the largest observation and from the centre of the bottom of the box to the smallest observation. 70
How can the lower quartile, median and upper quartile be used to judge the symmetry of a distribution? 1. If the distribution is symmetric, then the upper and lower quartiles should be approximately equally spaced from the median. 2. If the upper quartile is farther from the median the lower quartile, then the distribution is positively skewed. 3. If the lower quartile is farther from the median the upper quartile, then the distribution is negatively skewed. 71
Box…. . 72
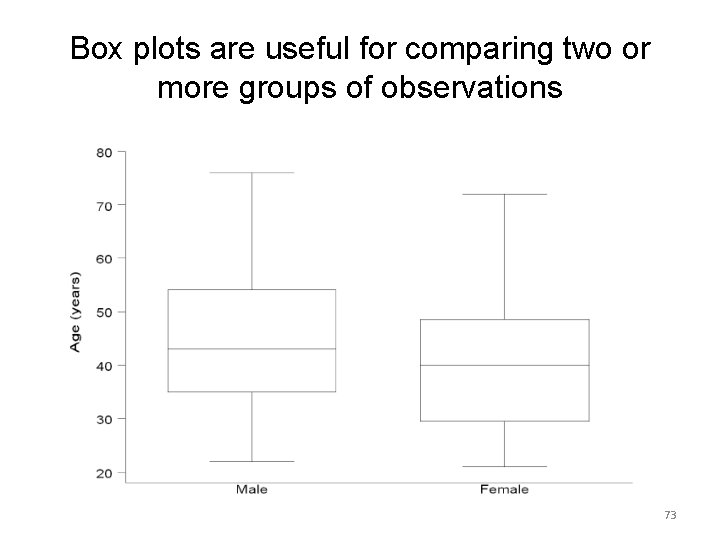
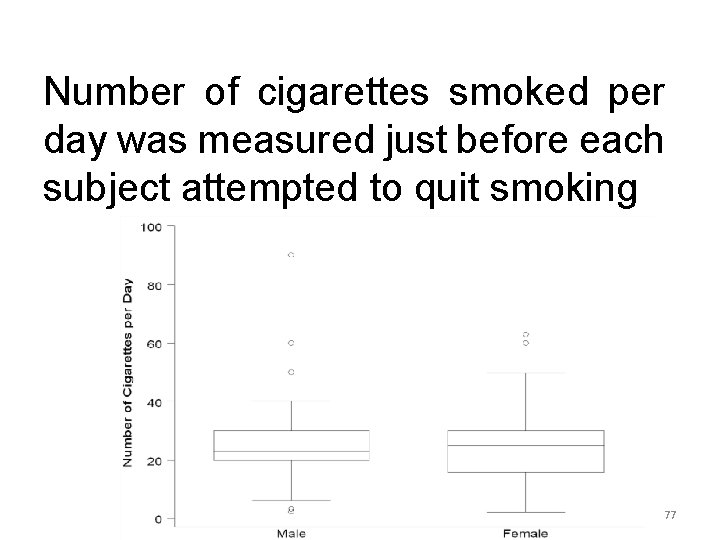
Box plots are useful for comparing two or more groups of observations 73
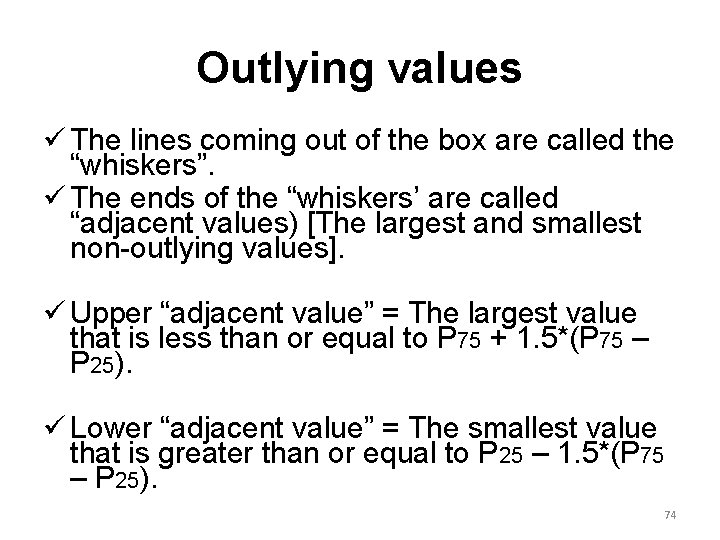
Outlying values ü The lines coming out of the box are called the “whiskers”. ü The ends of the “whiskers’ are called “adjacent values) [The largest and smallest non-outlying values]. ü Upper “adjacent value” = The largest value that is less than or equal to P 75 + 1. 5*(P 75 – P 25). ü Lower “adjacent value” = The smallest value that is greater than or equal to P 25 – 1. 5*(P 75 – P 25). 74
Box…. . The box plot is completed üDraw a vertical bar from the upper quartile to the largest non-outlining value in the sample üDraw a vertical bar from the lower quartile to the smallest non-outlying value in the sample 75
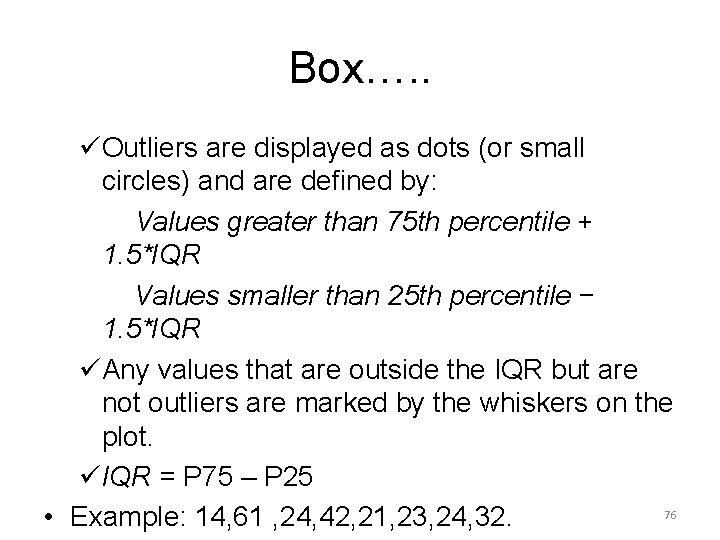
Box…. . üOutliers are displayed as dots (or small circles) and are defined by: Values greater than 75 th percentile + 1. 5*IQR Values smaller than 25 th percentile − 1. 5*IQR üAny values that are outside the IQR but are not outliers are marked by the whiskers on the plot. üIQR = P 75 – P 25 76 • Example: 14, 61 , 24, 42, 21, 23, 24, 32.
Number of cigarettes smoked per day was measured just before each subject attempted to quit smoking 77
8. Ogive curve ü Some times it may be necessary to know the number of items whose values are more or less than a certain amount. ü We may, for example, be interested to know the no. of patients whose weight is <50 Kg or >60 Kg. ü To get this information it is necessary to change the form of the frequency distribution from a ‘simple’ to a ‘cumulative’ distribution. ü Ogive curve turns a cumulative frequency distribution in to graphs. ü Are much more common than frequency polygons 78
Example: Heart rate of patients admitted to hospital Y, 1998 79
80
9. Scatter plot Ø Most studies in medicine involve measuring more than one characteristic, and graphs displaying the relationship between two characteristics are common in literature. Ø When both the variables are qualitative then we can use a multiple bar graph. Ø When one of the characteristics is qualitative and the other is quantitative, the data can be displayed in box and whisker plots 81
Scatter…. Ø For two quantitative variables we use bivariate plots (also called scatter plots or scatter diagrams). Ø In the study on percentage saturation of bile, information was collected on the age of each patient to see whether a relationship existed between the two measures Ø A scatter diagram is constructed by drawing X-and Y-axes Ø Each point represented by a point or dot( ) represents a pair of values measured for a single study subject =POSTIVE RELATION 82
Scatter…. 83
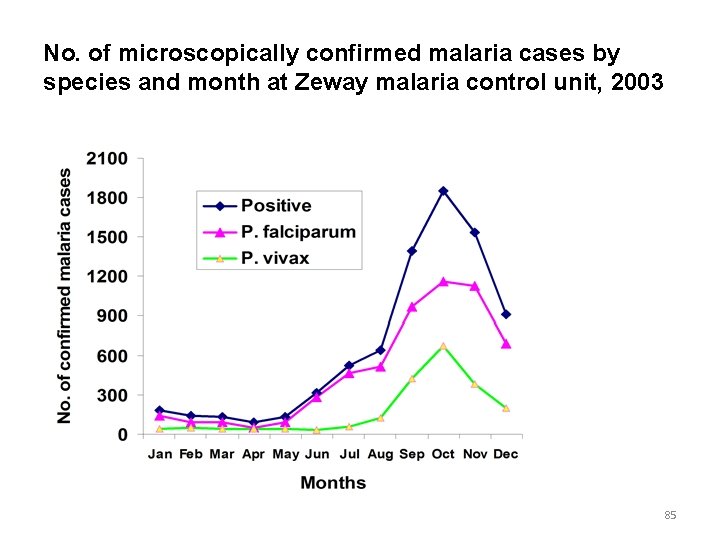
9. Line graph ü Useful for assessing the trend of particular situation overtime. ü Helps for monitoring the trend of epidemics. ü The time, in weeks, months or years, is marked along the horizontal axis ü Values of the quantity being studied is marked on the vertical axis. ü Values for each category are connected by continuous line. ü Sometimes two or more graphs are drawn on the same graph taking the same scale so that the plotted 84 graphs are comparable.
No. of microscopically confirmed malaria cases by species and month at Zeway malaria control unit, 2003 85