
Nationwide Data Collection Dublin City Council Cordon Counts

Nationwide Data Collection Dublin City Council Cordon Counts Presentation 2018
Introduction / Survey Details. Dublin City Council Cordon Counts 2018 • 33 Survey Locations. • Two survey days with surveys undertaken between 07: 00 – 19: 00 on each day. • Survey Dates: Tuesday 6 th November and Wednesday 7 th November 2018. Tuesday 13 th November and Wednesday 14 th November 2018. • Bi-directional Vehicle Link Counts and Pedestrian Counts undertaken at each site. • Vehicle Occupancy Counts (Cars and Taxis Only). Ø Inbound (07: 00 to 10: 00). Ø Outbound (16: 00 to 19: 00).

Contents • Survey Maps • 2017 v 2018 Comparisons • 2018 Results Summary – AM Peak Inbound • Percentage of Pedestrians and Cyclists - AM Peak Inbound • Case Study – Site 27 AM Peak Inbound • 2018 Results Summary – 12 Hours Inbound • 1997 – 2018 Comparisons • Vehicle Occupancy Counts
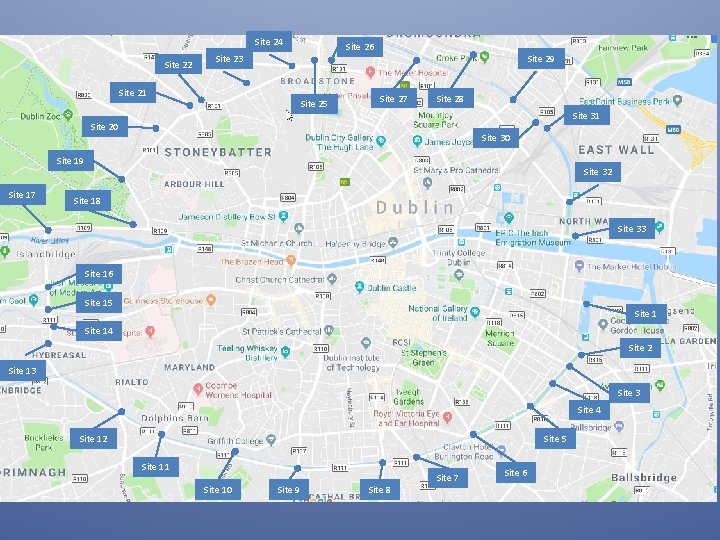
Site 24 Site 22 Site 26 Site 23 Site 21 Site 25 Site 29 Site 27 Site 28 Site 31 Site 20 Site 30 Site 19 Site 17 Site 32 Site 18 Site 33 Site 16 Site 15 Site 14 Site 2 Site 13 Site 4 Site 12 Site 5 Site 11 Site 10 Site 9 Site 8 Site 7 Site 6

2017 v 2018 Comparison AM Peak – Inbound – 07: 00 to 10: 00 -1. 4% 2017 = 70, 896 2018 = 69, 913 12 hour – Inbound – 07: 00 to 19: 00 -2. 3% 2017 = 202, 658 2018 = 198, 027

2017 v 2018 Comparison Pedestrians AM Peak – Inbound – 07: 00 to 10: 00 -4. 3% 2017 = 24, 936 2018 = 23, 858 12 hour – Inbound – 07: 00 to 19: 00 -6. 6% 2017 = 66, 241 2018 = 61, 899
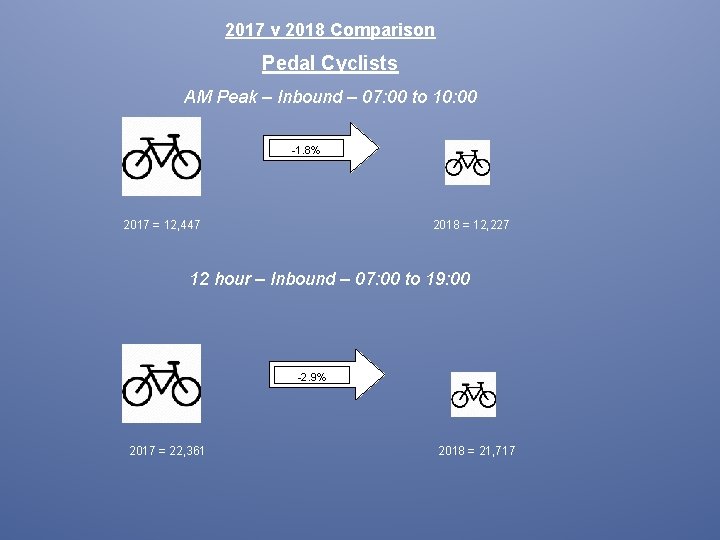
2017 v 2018 Comparison Pedal Cyclists AM Peak – Inbound – 07: 00 to 10: 00 -1. 8% 2017 = 12, 447 2018 = 12, 227 12 hour – Inbound – 07: 00 to 19: 00 -2. 9% 2017 = 22, 361 2018 = 21, 717
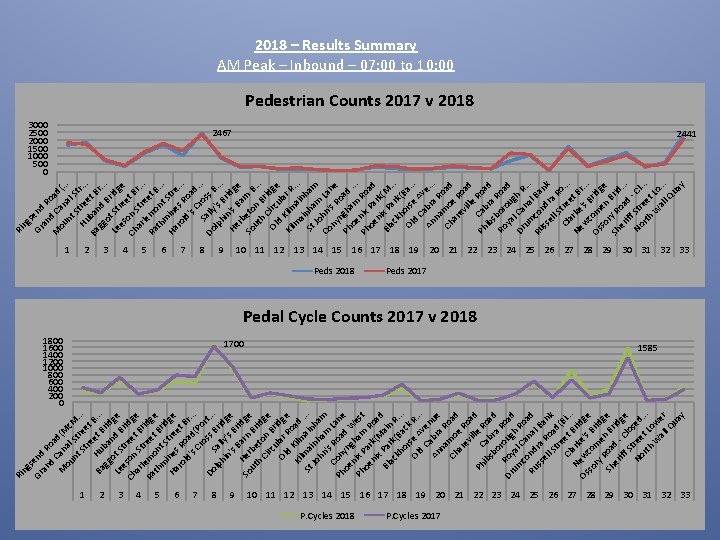
ng s Gr end an R d oa M Can d(M ou al c nt Str M. St ee. . re t B Ba Hu et B. . . gg ba rid n Le ot S d B ge es tre rid Ch on e g ar St t B e le re rid Ra m e g th on t B e m t S rid Ha ines tree ge ro Ro t B ld 's ad( r. . . Cr Po os rt Do. . s lp Sal Bri. hi ly dg n' 's e s B Br i H So er arn dge ut be Br h to id Ci n ge rc B u r Ol lar idge d Ro Ki Kilm ad l St ma ain . . . Jo in h hn ham am ' C s R L Ph on oa ane oe yn d W n g Ph ix P ham est oe ar R ni k(M oa x d Bl Par ain ac k( R kh Ba. . . or ck Ol se A R. . . d C ve An abr nue na a R Ch mo oad ar e R ev o ille ad Ph C ib ab Roa sb ra d or R Dr Roy oug oad um al h c Ca Ro Ru ond nal ad ss ra Ba el Ro n l S k tre ad( B C et i. . Ne lark Brid. Os w e's ge so co Br ry me id g Sh Roa n Br e d er i iff - C dge St lo No ree sed rth t L. . . W ow al er l Q ua y Ri ng s Gr end an R M d C oad ou an (. . nt al . S S Hu tre tr. . . e Ba ban t B gg d r. . . B o Le t St ridg es re e e Ch on S t B ar tr r. . . e l Ra emo et B th nt. . . m Ha ine Stre ro s R. . . ld 's oad C. S ro. . Do ally ss B lp 's . . . hi Br He n's idg rb Ba e So eto rn B ut n . . . h Br C i Ol irc dge d ula Ki Kilm r R lm. ai ainh. . n St ha am Jo m Co hn' Lan ny s R e o n Ph gh ad oe am . . . Ph nix Ro oe Pa ad n rk Bl ix P (M ac ar. . . kh k( B Ol orse a. . . d Ca Av e An br. . na a R. o Ch mo ad ar e R ev oa ille d C Ph ab Roa ib ra d s Ro bor Roa o ya u d g Dr l Ca h R um na. . . Ru co l Ba ss nd nk el ra l S R Cl tree o. . . a Ne rke t Br w 's B. . . c Os om rid so en ge r Sh y R Brid er oa. . . iff d No Str - Cl rth ee. . . W t Lo al. . . l Q ua y Ri 2018 – Results Summary AM Peak – Inbound – 07: 00 to 10: 00 Pedestrian Counts 2017 v 2018 3000 2500 2000 1500 1000 500 0 2467 1 2 1 3 2 4 3 5 4 6 5 7 6 8 7 9 1800 1600 1400 1200 1000 800 600 400 200 0 8 9 2441 10 11 12 13 14 15 16 17 18 19 20 21 22 23 24 25 26 27 28 29 30 31 32 33 Peds 2018 P. Cycles 2018 Peds 2017 Pedal Cycle Counts 2017 v 2018 1700 1585 10 11 12 13 14 15 16 17 18 19 20 21 22 23 24 25 26 27 28 29 30 31 32 33 P. Cycles 2017
an on B al M Str ridg ou e e nt et B ) St rid re et ge B H Ba uba rid gg nd ge ot B Le Str rid e Ra Ch so eet ge th n m arle St Brid in re m es on et ge R oa t St Brid r d( Po eet ge Ha rte Brid ro be ge l ld 's lo B Cr r os id. . s B. Do r S lp ally idge So hi 's ut n B 's h Ci Ba ridg rc e He rn ul B ar R rbet ridg oa on e d at Bri St dg Ol Pat e d K rick Ki ilma '. . . lm in a h St Jo inha am hn m La 's Ph Co Roa ne n d oe ni yng We Ph x Pa ham st r oe ni k(M Roa x P ai d ar n R k( Ba oad Bl ac ) kh ck R oa or se d Ol Av ) d e Ca nu e An bra na Ro a m Ch oe d R ar ev oad ille Ph Ca Roa d ib br Dr s um bo a R o r co o nd Ro ug ad ya h R ra R l oa Can oad d( a B Ru in l Ba n' nk ss s el l S Brid tre ge e ) Cl t Br ar id k Os N g e' s B e so ew c ry R om ridg oa e e d n B Sh - Clo ridg er e iff sed 2 St 0 r No eet 16 rth Lo W we r al l Q ua y ah c. M d( M nd C Gr a oa se nd R ng Ri ou M c. M re ah o. . . e t nt St Brid re ge e Hu t Br i Ba b d gg and ge ot B Le Str ridg e Ch eso eet n ar St Brid le ge Ra mo ree t th nt m St Brid in g es ree t e R Ha oad Brid g ( ro ld Por e 's te Cr b os e. . . s B Do ri S lp ally dge hi ' s n' s B Brid ge ar So n He ut Br h id Ci rbe g t rc ul on e ar Br R oa idge d Ol d at S Ki lm t. . . Ki ai lm nh a St i Jo nha am m hn L 's Ro ane Ph Co ad n oe ni yng We x ha st Ph Pa rk m R oe (M oa ni x P d a ar in R k( o a B Bl ac ack d) kh R o or se ad Ol Av ) d e Ca nu e br An a na Ro ad m Ch oe Ro ar ev a ille d R oa C Ph d ib abr sb a R or o ou ad Dr um Roy gh R al co nd Ca oad na ra l Ru Roa Ban ss d( k el l S Binn tre 's. . . e Cl t Br ar i d ke ge N Os 's so ew co Bri ry dg m R oa e e d n B - C r i d Sh er lose ge iff St d 20 r 16 No eet rth Lo W we r al l Q ua y M d( St al oa R Ca n d nd se an Gr Ri ng Car/LGV Counts 2017 v 2018 5000 4500 4000 3500 3000 2500 2000 1500 1000 500 0 3247 1 2 1 3 2 4 3 5 4 6 5 6 4281 7 8 7 9 8 10 9 11 10 12 11 13 12 14 13 15 14 16 15 Dub Bus 2018 17 Car/Lgv 2018 16 18 17 19 18 19 Dub Bus 2017 20 20 21 21 22 22 23 23 24 24 25 25 26 26 27 160 140 120 100 80 60 40 20 0 27 28 28 29 29 30 132 30 31 31 32 32 33 Car/LGV 2017 Dublin Bus Counts 2017 v 2018 152 33
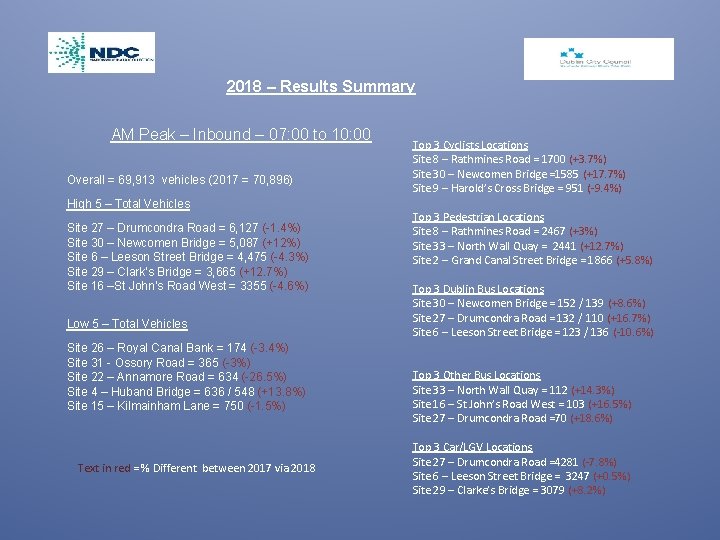
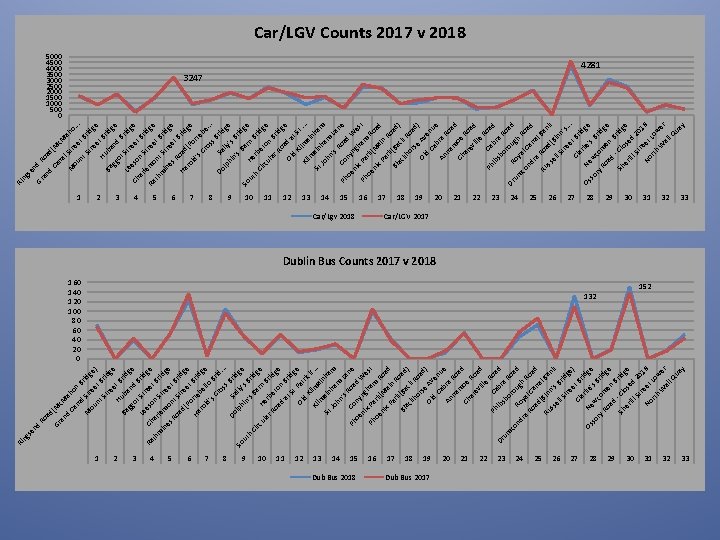
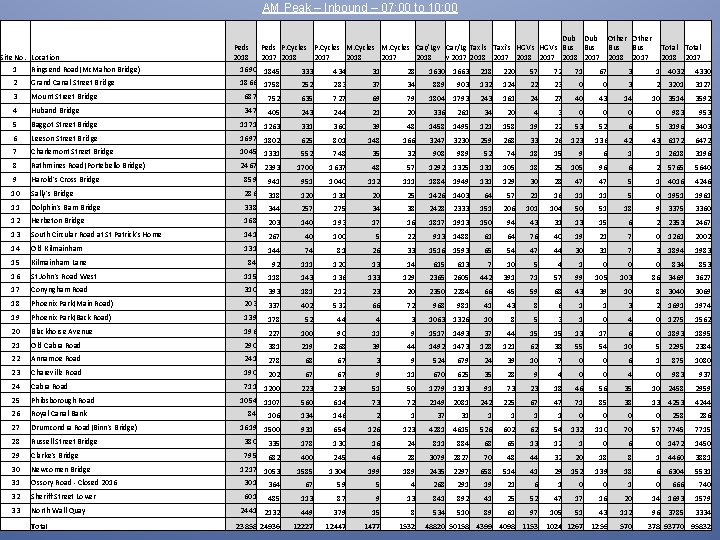
2018 – Results Summary AM Peak – Inbound – 07: 00 to 10: 00 Overall = 69, 913 vehicles (2017 = 70, 896) High 5 – Total Vehicles Site 27 – Drumcondra Road = 6, 127 (-1. 4%) Site 30 – Newcomen Bridge = 5, 087 (+12%) Site 6 – Leeson Street Bridge = 4, 475 (-4. 3%) Site 29 – Clark’s Bridge = 3, 665 (+12. 7%) Site 16 –St John’s Road West = 3355 (-4. 6%) Low 5 – Total Vehicles Site 26 – Royal Canal Bank = 174 (-3. 4%) Site 31 - Ossory Road = 365 (-3%) Site 22 – Annamore Road = 634 (-26. 5%) Site 4 – Huband Bridge = 636 / 548 (+13. 8%) Site 15 – Kilmainham Lane = 750 (-1. 5%) Text in red = % Different between 2017 via 2018 Top 3 Cyclists Locations Site 8 – Rathmines Road = 1700 (+3. 7%) Site 30 – Newcomen Bridge =1585 (+17. 7%) Site 9 – Harold’s Cross Bridge = 951 (-9. 4%) Top 3 Pedestrian Locations Site 8 – Rathmines Road = 2467 (+3%) Site 33 – North Wall Quay = 2441 (+12. 7%) Site 2 – Grand Canal Street Bridge = 1866 (+5. 8%) Top 3 Dublin Bus Locations Site 30 – Newcomen Bridge = 152 / 139 (+8. 6%) Site 27 – Drumcondra Road = 132 / 110 (+16. 7%) Site 6 – Leeson Street Bridge = 123 / 136 (-10. 6%) Top 3 Other Bus Locations Site 33 – North Wall Quay = 112 (+14. 3%) Site 16 – St John’s Road West = 103 (+16. 5%) Site 27 – Drumcondra Road =70 (+18. 6%) Top 3 Car/LGV Locations Site 27 – Drumcondra Road =4281 (-7. 8%) Site 6 – Leeson Street Bridge = 3247 (+0. 5%) Site 29 – Clarke’s Bridge = 3079 (+8. 2%)
AM Peak – Inbound – 07: 00 to 10: 00 Site No. Location 1 Ringsend Road(Mc. Mahon Bridge) Dub Other Peds P. Cycles M. Cycles Car/Lgv Car/Lg Taxi's HGV's Bus Bus 2018 2017 2018 v 2017 2018 2017 1690 1845 333 434 31 28 1630 1663 218 220 57 72 71 67 3 1866 1758 252 283 37 34 889 903 132 124 22 23 0 0 3 2 Grand Canal Street Bridge 3 Mount Street Bridge 687 752 635 727 69 79 4 Huband Bridge 347 405 243 244 21 20 5 Baggot Street Bridge 331 360 39 6 Leeson Street Bridge 1171 1263 1697 1802 625 801 148 7 Charlemont Street Bridge 8 Rathmines Road(Portebello Bridge) 9 Harold's Cross Bridge 859 10 Sally's Bridge 11 1045 1331 2467 2393 1804 1793 243 161 24 27 40 43 14 261 34 20 4 3 0 0 0 48 1458 1495 121 158 19 22 53 52 166 3247 3230 259 268 33 26 123 136 336 1 4032 4330 2 3201 3127 10 3514 3592 0 983 953 6 5 3196 3403 42 43 6172 6472 552 748 35 32 989 52 74 18 15 9 6 1 1 2618 3196 1700 1637 48 57 1292 1325 131 105 18 25 105 96 6 2 5765 5640 941 951 1040 112 111 1884 1949 131 129 30 28 47 47 5 1 4016 4246 286 318 120 131 20 25 1426 1403 64 57 21 16 11 11 5 0 1951 1961 Dolphin's Barn Bridge 338 344 257 275 34 38 2428 2333 151 206 101 104 50 51 18 9 3375 3360 12 Herbeton Bridge 168 203 140 193 17 16 1817 1913 150 94 43 31 13 15 6 2 2353 2467 13 South Circular Road at St Patrick's Home 141 267 40 100 5 22 913 1488 61 64 76 40 19 21 7 0 1261 2002 14 Old Kilmainham 131 144 74 81 26 33 1516 1593 1983 15 Kilmainham Lane 84 92 111 120 13 14 16 St John's Road West 115 118 143 136 133 17 Conyngham Road 310 393 181 212 23 18 Phoenix Park(Main Road) 203 337 402 532 66 72 19 Phoenix Park(Back Road) 139 178 52 44 4 3 20 Blackhorse Avenue 196 227 100 90 11 9 21 Old Cabra Road 290 381 219 268 39 44 22 Annamoe Road 241 278 68 67 3 9 23 Chareville Road 190 67 9 11 Cabra Road 223 239 51 50 25 Phibsborough Road 202 711 1200 1054 1107 67 24 2149 2081 26 Royal Canal Bank 27 Drumcondra Road(Binn's Bridge) 28 Russell Street Bridge 29 Clarke's Bridge 30 Newcomen Bridge 31 Ossory Road - Closed 2016 32 Sheriff Street Lower 33 North Wall Quay Total 65 54 47 44 30 31 7 3 1894 613 7 10 5 4 1 0 0 0 129 2365 2605 442 391 71 57 99 105 20 2350 2284 66 45 59 68 43 39 981 41 43 8 6 1 1063 1326 10 8 5 3 1 1517 1493 37 44 15 15 1492 1473 560 614 73 72 106 134 146 2 1 1619 1500 380 335 931 654 126 123 178 130 16 24 682 400 245 46 1217 1053 301 364 1585 1304 67 59 84 795 601 908 Total 2018 2017 615 968 834 853 103 86 3469 3627 10 8 3040 3069 1 3 2 1691 1974 0 1275 1562 13 17 6 0 1893 1895 5 2295 2384 1 875 1080 0 128 121 62 38 55 54 10 524 679 24 39 10 7 0 0 6 670 625 35 28 9 4 0 0 4 983 937 1279 1313 91 73 23 18 46 56 35 10 2458 2959 13 4253 4244 242 225 67 47 71 85 38 31 1 1 0 0 0 4281 4615 37 0 258 286 526 602 62 54 132 110 70 57 7745 7715 884 68 65 13 12 1 0 6 0 1472 1450 28 3079 2827 70 48 44 32 20 18 8 1 4460 3881 199 189 2435 2297 658 514 41 29 152 139 18 6 6304 5531 5 4 268 291 19 21 6 1 0 0 1 811 0 666 740 485 2441 2132 113 87 9 13 841 892 41 25 52 47 17 16 20 14 1693 1579 449 379 15 8 534 510 89 61 97 105 51 43 112 96 3785 3334 23858 24936 12227 12447 1477 1532 48820 50158 4399 4098 1153 1024 1267 1259 570 378 93770 95832
n an d R o d M Ca ad ou n nt al S . . St tr. re ee H Ba ub et B. . . gg an rid Le ot S d B. . . es tre rid o Ch n S et B ge ar tre rid l Ra em et B. . . th on rid m t . Ha ine Stre. . ro s R et ld oa. . . 's Cr d S Do a oss . . . l B lp ly' ri hi s . . . n B He 's B ridg So rb arn e ut eto Br h n i. . Ci B. r r Ol cula idge d r Ki Kilm Roa lm St a ain. . . Jo in h hn ham am Co 's R La o n Ph nyn ad e oe gh W e Ph nix am . . . oe Pa Ro n rk a Bl ix P d ac ar kh k . . . or Ol se A . . d C ve. An abr nue na a R Ch mo oad ar e R ev o ille ad Ph ib Cab Roa sb r o a d Ro rou Roa Dr yal gh d um Ca Ro a Ru con nal d ss dr Ba el a nk l S Ro tr a Cl eet d. . . Ne ark Br w e's id. co B. . m rid en g Sh O Br e s er so idg iff S ry e No tre Roa rth et L d W ow al. . . l Q ua y Gr se ng Ri ng s Gr end an R o M d Ca ad ou n nt al S . . St tr. re ee H Ba ub et B. . . gg an rid Le ot S d B. . . es tre rid o Ch n S et B ge ar tre rid l Ra em et B. . . th on rid m t . Ha ine Stre. . ro s R et ld oa. . . 's Cr d S Do a oss . . . l B lp ly' ri hi s . . . n B He 's B ridg So rb arn e ut eto Br h n i. . Ci B. r r Ol cula idge d r Ki Kilm Roa lm St a ain. . . Jo in h hn ham am Co 's R La o n Ph nyn ad e oe gh W e Ph nix am . . . oe Pa Ro n rk a Bl ix P d ac ar kh k . . . or Ol se A . . d C ve. An abr nue na a R Ch mo oad ar e R ev o ille ad Ph ib Cab Roa sb r o a d Ro rou Roa Dr yal gh d um Ca Ro a Ru con nal d ss dr Ba el a nk l S Ro tr a Cl eet d. . . Ne ark Br w e's id. co B. . m rid en g Sh O Br e s er so idg iff S ry e No tre Roa rth et L d W ow al. . . l Q ua y Ri Percentage of Pedestrians and Cyclists Per Site – AM Peak Percentage of Pedestrians 12. 0% 10. 0% 8. 0% 6. 0% 4. 0% 2. 0% 0. 0% 10. 3% 1 1 2 2 3 3 4 4 5 5 6 6 7 7 8 16. 0% 14. 0% 12. 0% 10. 0% 8. 0% 6. 0% 4. 0% 2. 0% 0. 0% 8 9 9 10. 2% 10 11 12 13 14 15 16 17 18 19 20 21 22 23 24 25 26 27 28 29 30 31 32 33 % Peds Percentage of Cyclists 13. 9% 13. 0% 10 11 12 13 14 15 16 17 18 19 20 21 22 23 24 25 26 27 28 29 30 31 32 33 % P. Cycles
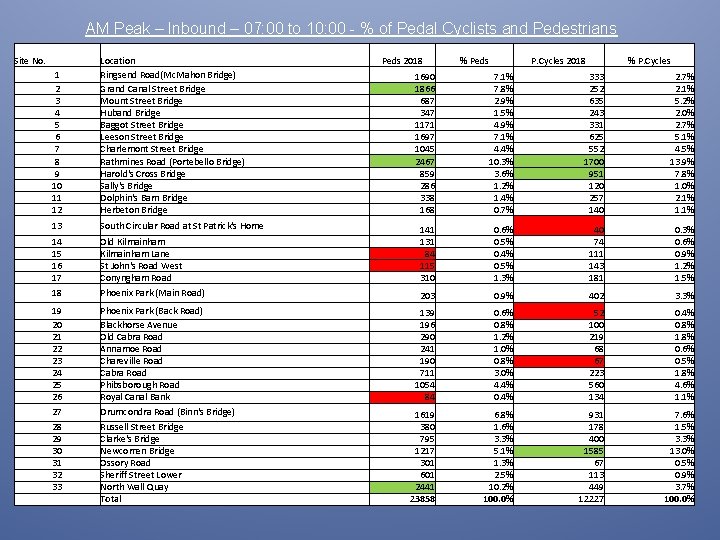
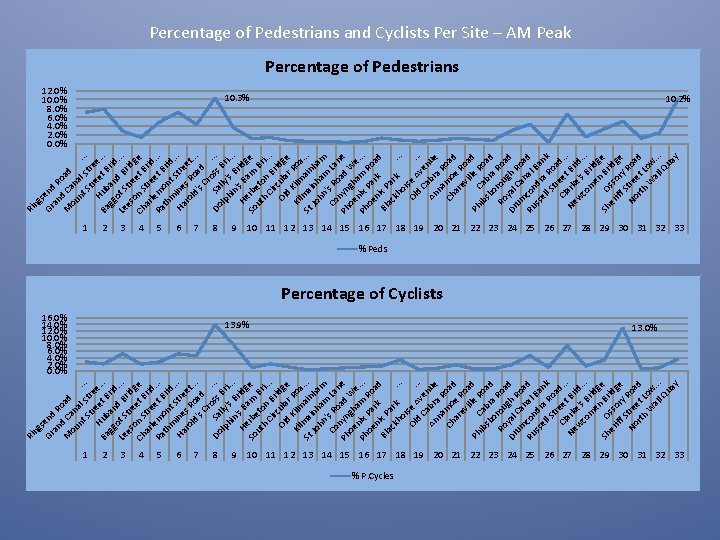
AM Peak – Inbound – 07: 00 to 10: 00 - % of Pedal Cyclists and Pedestrians Site No. 1 2 3 4 5 6 7 8 9 10 11 12 Location Ringsend Road(Mc. Mahon Bridge) Grand Canal Street Bridge Mount Street Bridge Huband Bridge Baggot Street Bridge Leeson Street Bridge Charlemont Street Bridge Rathmines Road (Portebello Bridge) Harold's Cross Bridge Sally's Bridge Dolphin's Barn Bridge Herbeton Bridge 13 South Circular Road at St Patrick's Home 14 15 16 17 Peds 2018 % Peds P. Cycles 2018 % P. Cycles 1690 1866 687 347 1171 1697 1045 2467 859 286 338 168 7. 1% 7. 8% 2. 9% 1. 5% 4. 9% 7. 1% 4. 4% 10. 3% 3. 6% 1. 2% 1. 4% 0. 7% 333 252 635 243 331 625 552 1700 951 120 257 140 2. 7% 2. 1% 5. 2% 2. 0% 2. 7% 5. 1% 4. 5% 13. 9% 7. 8% 1. 0% 2. 1% 1. 1% Old Kilmainham Lane St John's Road West Conyngham Road 141 131 84 115 310 0. 6% 0. 5% 0. 4% 0. 5% 1. 3% 40 74 111 143 181 0. 3% 0. 6% 0. 9% 1. 2% 1. 5% 18 Phoenix Park (Main Road) 203 0. 9% 402 3. 3% 19 20 21 22 23 24 25 26 Phoenix Park (Back Road) Blackhorse Avenue Old Cabra Road Annamoe Road Chareville Road Cabra Road Phibsborough Road Royal Canal Bank 139 196 290 241 190 711 1054 84 0. 6% 0. 8% 1. 2% 1. 0% 0. 8% 3. 0% 4. 4% 0. 4% 52 100 219 68 67 223 560 134 0. 4% 0. 8% 1. 8% 0. 6% 0. 5% 1. 8% 4. 6% 1. 1% 27 Drumcondra Road (Binn's Bridge) 28 29 30 31 32 33 Russell Street Bridge Clarke's Bridge Newcomen Bridge Ossory Road Sheriff Street Lower North Wall Quay Total 1619 380 795 1217 301 601 2441 23858 6. 8% 1. 6% 3. 3% 5. 1% 1. 3% 2. 5% 10. 2% 100. 0% 931 178 400 1585 67 113 449 12227 7. 6% 1. 5% 3. 3% 13. 0% 0. 5% 0. 9% 3. 7% 100. 0%
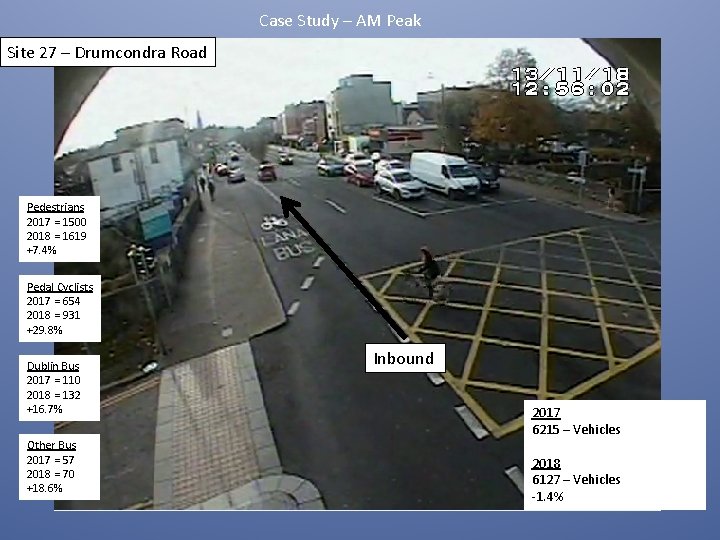
Case Study – AM Peak Site 27 – Drumcondra Road Pedestrians 2017 = 1500 2018 = 1619 +7. 4% Pedal Cyclists 2017 = 654 2018 = 931 +29. 8% Dublin Bus 2017 = 110 2018 = 132 +16. 7% Other Bus 2017 = 57 2018 = 70 +18. 6% Inbound 2017 6215 – Vehicles 2018 6127 – Vehicles -1. 4%
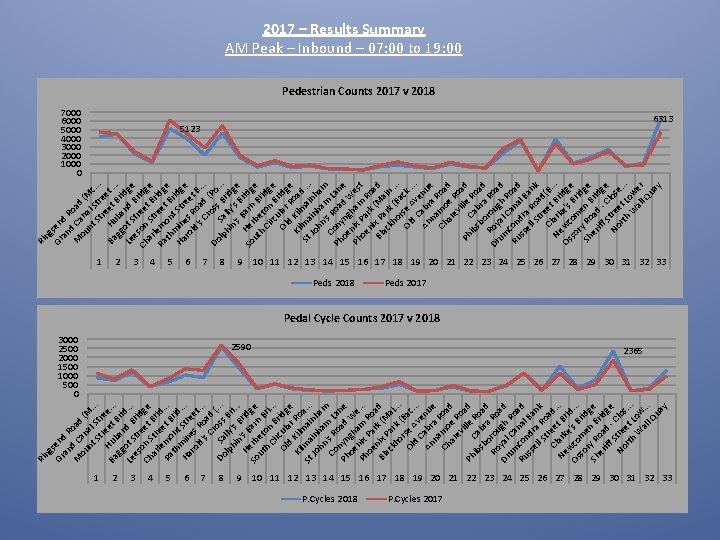
s Gr end an R M d C oad ou an (M nt al St St. . . re re Ba Hub et e. . . gg an Bri Le ot S d B d. . . es tr rid e Ch on S et ge ar tr Bri le e d Ra mo et B. . . th nt rid Ha min Str. . . ro es eet ld Ro. . . 's a Cr d Do Sa oss (. . . lp lly Br hi 's i. . n B. He 's B rid So rb arn ge ut eto B h n ri. Ci B. . r Ol cula ridg d r e Ki Kilm Ro St lma ai a. . . Jo in nh hn ha am m Co 's R La oa n n Ph yn d e oe gh W a e Ph nix m . . . oe Pa Ro a r Bl nix k (M d ac Pa a kh rk i. . or (B. Ol se A ac. . d C ve. An abr nue na a R Ch mo oa ar e R d ev o ille ad Ph ib Ca Ro sb br ad o a Ro rou Ro Dr yal gh ad um Ca Ro Ru con nal ad ss dr Ba el a nk l S R t o Cl reet ad. . a Ne rk B. w e ri Os co 's B d. . . so me rid r Sh y R n B ge er oa rid iff d ge S - No tre Clo rth et s. . . W Low al. . . l Q ua y ng Ri ng Gr sen an d R M d Ca oad ou n (M nt al S c St tr. . . re ee Ba Hu et t. . gg ba Bri. Le ot S nd dge e t B Ch son ree ridg ar St t B e r r l Ra em eet idg o th n Br e m t Ha in Str idge ro es ee ld Ro t B 's ad. . Cr (. os Po Do lp Sa s Br. . . hi lly id n' 's ge s B B H So e arn ridg ut rbe B e h to rid Ci n g rc B e u Ol lar ridg d Ro e Ki Kil a St lma mai d. . . Jo in nh hn ha am m Co 's R La Ph ny oa n oe ng d W e Ph nix ham es oe Pa R t ni rk oa Bl x Pa (Ma d ac r kh k ( in. or Ba. . Ol se ck d Av. . . C e An abr nu na a R e Ch mo oa ar e R d ev o ille ad Ph ib Ca Ro sb br ad or a R Dr oy oug Roa um al h d c C R Ru on ana oad ss dra l B el R an l S o k tr ad Cl eet (B. . Ne ark Br. Os wc e's idge so om Br r e id Sh y Ro n B ge er ad rid iff - g S C e No tre los rth et L e. . . W ow al er l Q ua y Ri 2017 – Results Summary AM Peak – Inbound – 07: 00 to 19: 00 Pedestrian Counts 2017 v 2018 7000 6000 5000 4000 3000 2000 1000 0 5123 1 1 2 2 3 3 4 4 5 5 6 6 6313 7 7 8 3000 2500 2000 1500 1000 500 0 8 9 10 11 12 13 14 15 16 17 18 19 20 21 22 23 24 25 26 27 28 29 30 31 32 33 Peds 2018 9 P. Cycles 2018 Peds 2017 Pedal Cycle Counts 2017 v 2018 2590 2365 10 11 12 13 14 15 16 17 18 19 20 21 22 23 24 25 26 27 28 29 30 31 32 33 P. Cycles 2017
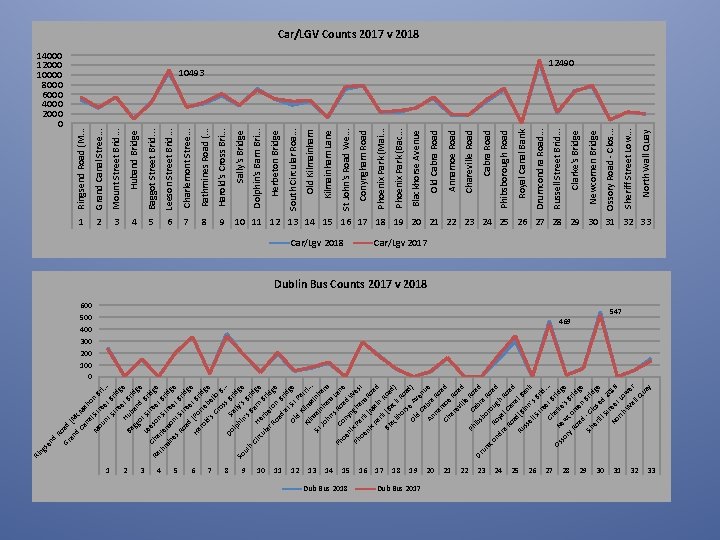
en d Ro Gr ad an (M d Ca c. Ma na ho M l St n B ou re r nt et i. . . St Br i re dg e H et Ba ub Bri gg an dg e d o Le t St Bri d r e Ra Cha so eet ge n r th m lem Str Brid e in o es nt et ge B R oa Stre rid ge d e Ha (Po t Br ro rte idg ld 's bell e Cr o os B. . Do S lp all ridg y hi So n' 's B e ut s B r h a id Ci rc He rn ge ul B r ar bet rid R oa on B ge d a rid Ol t St ge d Pa K Ki ilm tri. . lm. ai n a St Jo inh ham hn am 's Ph R La C oe on oad ne yn n W Ph ix P gh e oe ark am st ni x P (Ma Roa ar in d k Bl (B Roa ac ac d kh k R ) or se oad ) Ol A v d Ca enu b An ra e na Ro m Ch oe ad ar ev Roa ille d Ph C R ib ab oad Dr sb r um or a R ou oa co R nd oy gh d a ra R l Ca Roa oa d n Ru d(B al B ss inn an k el l S 's B tre rid Cl et B. . . a Os Ne rke ridg so 's e w ry R com Brid oa e n ge d Sh - Cl Brid er os ge iff e St d 2 0 No ree 16 rth t Lo W we r al l Q ua y ng s Ri Mount Street Brid. . . Huband Bridge Baggot Street Brid. . . Leeson Street Brid. . . Charlemont Stree. . . Rathmines Road (. . . 1 2 3 4 5 6 7 8 9 10 11 12 13 14 15 Dub Bus 2018 Car/Lgv 2018 16 17 18 19 Dub Bus 2017 20 21 22 23 24 25 600 500 400 300 200 100 0 26 27 28 29 469 30 31 32 North Wall Quay Sheriff Street Low. . . Ossory Road - Clos. . . Newcomen Bridge Clarke's Bridge 10493 Russell Street Brid. . . Drumcondra Road. . . Royal Canal Bank Phibsborough Road Cabra Road Chareville Road Annamoe Road Old Cabra Road Blackhorse Avenue Phoenix Park (Bac. . . Phoenix Park (Mai. . . Conyngham Road St John's Road We. . . Kilmainham Lane Old Kilmainham South Circular Roa. . . Herbeton Bridge Dolphin's Barn Bri. . . Sally's Bridge Harold's Cross Bri. . . Grand Canal Stree. . . 14000 12000 10000 8000 6000 4000 2000 0 Ringsend Road (M. . . Car/LGV Counts 2017 v 2018 12490 9 10 11 12 13 14 15 16 17 18 19 20 21 22 23 24 25 26 27 28 29 30 31 32 33 Car/Lgv 2017 Dublin Bus Counts 2017 v 2018 547 33
2018 – Results Summary 12 hours – Inbound – 07: 00 to 19: 00 Overall = 198, 027 vehicles (2017 = 202, 658) High 5 – Total Vehicles Site 27 – Drumcondra Road = 17, 901 (- 0. 02%) Site 6 – Leeson Street Bridge = 13, 630 (-6. 6%) Site 30 – Newcomen Bridge = 12, 907 (+3. 3%) Site 25 – Philbsborough Road = 9, 989 (-1. 6%) Site 16 – St John’s Road West = 9, 872 (-2. 8%) Low 5 – Total Vehicles Site 26 – Royal Canal Bank = 290 (+7. 9%) Site 31 - Ossory Road = 974 (-1. 2%) Site 15 – Kilmainham Lane = 1, 431 (-6. 8%) Site 4 – Huband Bridge = 1, 570 (+7. 1%) Site 22 – Annamoe Road = 1, 916 (-16%) Text in red = % Different between 2017 via 2018 Top 3 Cyclists Locations Site 8 – Rathmines Road = 2, 590 (-4. 1%) Site 30 – Newcomen Bridge =2, 365 (+22%) Site 27 – Drumcondra Road = 1, 521 (+25. 7%) Top 3 Pedestrian Locations Site 33 – North Wall Quay = 6, 313 (+25. 8%) Site 5 - Baggot Street Bridge = 5, 123 (-19. 3%) Site 8 – Rathmines Road = 4, 608 (-18. 7%) Top 3 Dublin Bus Locations Site 30 – Newcomen Bridge = 547 (+4. 6%) Site 27 – Drumcondra Road = 469 (+5. 5%) Site 8 – Rathmines Road = 362 (+5. 2%) Top 3 Other Bus Locations Site 33 – North Wall Quay = 329 (+7. 6%) Site 16 – St John’s Road West = 325 (+10. 5%) Site 27 – Drumcondra Road = 264 (+14. 4%) Top 3 Car/LGV Locations Site 27 – Drumcondra Road = 12, 490 (- 4. 5%) Site 6 – Leeson Street Bridge = 10, 493 (-4. 6%) Site 17 Conyngham Road = 7, 759 (-1. 5%)
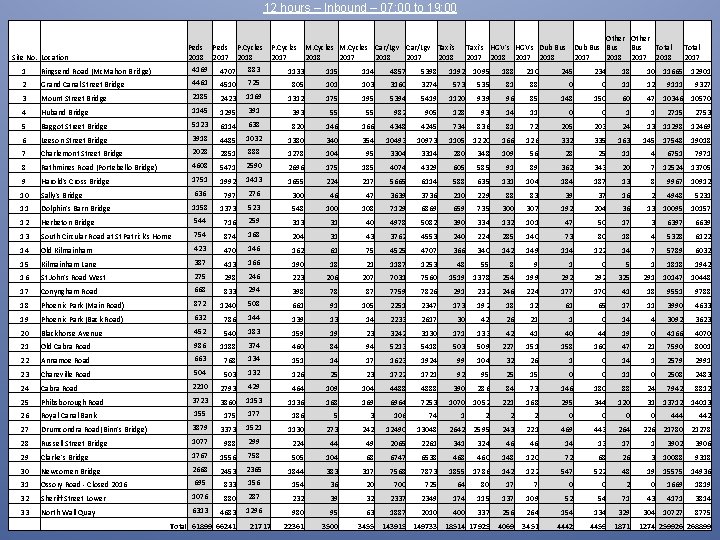
12 hours – Inbound – 07: 00 to 19: 00 Other Peds P. Cycles M. Cycles Car/Lgv Taxi's HGV's Dub Bus Bus Total 2018 2017 2018 2017 2018 2017 4169 883 4707 1133 115 114 4857 5398 1192 1095 188 210 245 234 18 10 11665 12901 4461 4510 725 805 101 103 3160 3274 573 535 81 88 0 0 11 12 9111 9327 2185 1169 2423 1312 175 195 5394 5419 1120 939 96 85 148 150 60 47 10346 10570 Site No. Location 1 Ringsend Road (Mc. Mahon Bridge) 2 Grand Canal Street Bridge 3 Mount Street Bridge 4 Huband Bridge 1145 1295 391 393 55 55 5 Baggot Street Bridge 5123 6114 638 820 146 166 4348 4245 734 836 6 Leeson Street Bridge 3918 4485 1032 1380 340 354 10493 10973 1105 1220 7 Charlemont Street Bridge 2028 2851 888 1278 104 95 3304 3314 280 348 109 56 8 Rathmines Road (Portebello Bridge) 4608 5471 2590 2696 175 185 4074 4329 605 585 91 89 9 Harold's Cross Bridge 1751 1992 1413 1655 224 217 5665 6114 588 635 131 104 184 10 Sally's Bridge 636 797 276 300 46 47 3639 3736 210 229 88 83 11 Dolphin's Barn Bridge 1158 1373 523 548 100 108 7129 6869 659 735 300 307 12 Herbeton Bridge 544 716 259 313 31 40 4978 5082 390 334 132 101 13 South Circular Road at St Patrick's Home 754 874 168 204 31 43 3762 4553 240 224 285 140 14 Old Kilmainham 423 470 146 162 61 75 4525 4707 366 340 142 15 Kilmainham Lane 387 413 166 190 18 21 1187 1253 48 55 8 16 St John's Road West 275 298 246 223 206 207 7031 7560 1519 1378 17 Conyngham Road 668 833 294 398 78 87 7759 7826 291 232 18 Phoenix Park (Main Road) 872 1240 508 661 91 105 2251 2347 173 19 Phoenix Park (Back Road) 632 786 144 139 13 14 2233 2617 30 20 Blackhorse Avenue 452 540 183 159 19 23 3242 3130 21 Old Cabra Road 986 1188 374 460 84 94 5213 22 Annamoe Road 663 768 134 151 14 17 1623 23 Chareville Road 504 503 132 126 25 23 1722 1721 24 Cabra Road 2210 2793 429 464 109 104 4488 4888 25 Phibsborough Road 3723 3860 1153 1136 168 169 6964 7253 26 Royal Canal Bank 155 177 186 5 3 106 74 27 Drumcondra Road(Binn's Bridge) 3879 3373 1521 1130 273 242 12490 28 Russell Street Bridge 1077 988 299 224 44 49 2065 29 Clarke's Bridge 1767 1556 758 505 104 68 30 Newcomen Bridge 2668 2453 2365 1844 383 31 Ossory Road - Closed 2016 695 833 156 154 36 32 Sheriff Street Lower 1076 880 287 232 33 North Wall Quay 6313 4683 1296 980 22361 3500 Total 61899 66241 21717 982 905 128 93 14 11 0 0 1 1 2715 81 72 205 203 24 13 11298 12469 166 126 332 335 163 145 17548 19018 28 25 11 4 362 343 20 7 187 13 8 39 37 16 2 192 204 36 13 47 50 17 3 6397 6639 73 80 18 4 5328 6122 149 114 122 14 7 5789 6032 9 1 0 5 1 1818 1942 254 199 292 325 291 246 224 177 170 41 18 9551 9788 192 18 12 61 65 17 11 3990 4633 42 26 21 1 0 14 4 3092 3623 171 133 42 41 40 44 19 0 4166 4070 5418 503 509 227 151 158 160 47 21 7590 8001 1924 99 104 32 26 1 0 14 1 2579 2991 92 95 25 15 0 0 11 0 2508 2483 390 286 84 73 146 180 88 24 7942 8812 1070 1052 221 168 295 344 120 31 1 2 2 2 0 0 13048 2642 2595 243 221 469 443 264 2261 341 324 46 46 14 13 17 1 3902 3906 6747 6538 460 148 120 72 68 26 3 10088 9318 317 7568 7873 1855 1786 142 122 547 522 48 19 20 700 725 64 80 17 7 0 0 2 0 39 32 2337 2349 174 115 137 109 52 54 71 95 63 1887 2010 400 337 256 264 154 134 329 3455 143915 149733 18514 17925 4069 3451 4442 4459 1871 6751 2753 7971 12524 13705 9967 10912 4948 5231 10095 10157 10147 10448 13712 14013 444 442 21780 21278 15575 14936 1669 1819 43 4171 3814 304 10727 8775 1274 259926 268899
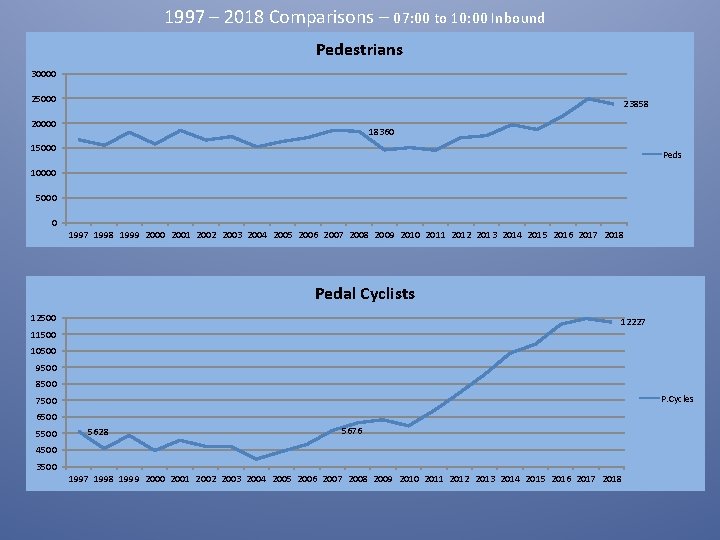
1997 – 2018 Comparisons – 07: 00 to 10: 00 Inbound Pedestrians 30000 25000 23858 20000 18360 15000 Peds 10000 5000 0 1997 1998 1999 2000 2001 2002 2003 2004 2005 2006 2007 2008 2009 2010 2011 2012 2013 2014 2015 2016 2017 2018 Pedal Cyclists 12500 12227 11500 10500 9500 8500 P. Cycles 7500 6500 5628 5676 4500 3500 1997 1998 1999 2000 2001 2002 2003 2004 2005 2006 2007 2008 2009 2010 2011 2012 2013 2014 2015 2016 2017 2018
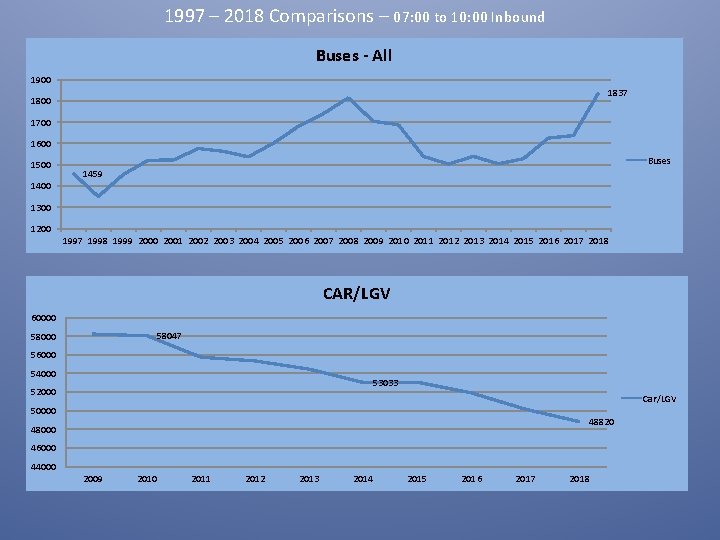
1997 – 2018 Comparisons – 07: 00 to 10: 00 Inbound Buses - All 1900 1837 1800 1700 1600 1500 Buses 1459 1400 1300 1200 1997 1998 1999 2000 2001 2002 2003 2004 2005 2006 2007 2008 2009 2010 2011 2012 2013 2014 2015 2016 2017 2018 CAR/LGV 60000 58047 58000 56000 54000 53033 52000 Car/LGV 50000 48820 48000 46000 44000 2009 2010 2011 2012 2013 2014 2015 2016 2017 2018
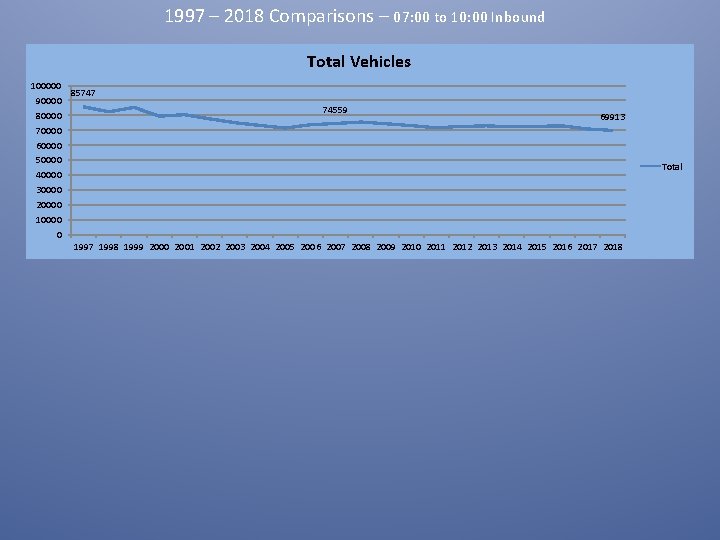
1997 – 2018 Comparisons – 07: 00 to 10: 00 Inbound Total Vehicles 100000 85747 90000 74559 80000 69913 70000 60000 50000 40000 30000 20000 10000 0 1997 1998 1999 2000 2001 2002 2003 2004 2005 2006 2007 2008 2009 2010 2011 2012 2013 2014 2015 2016 2017 2018 Total
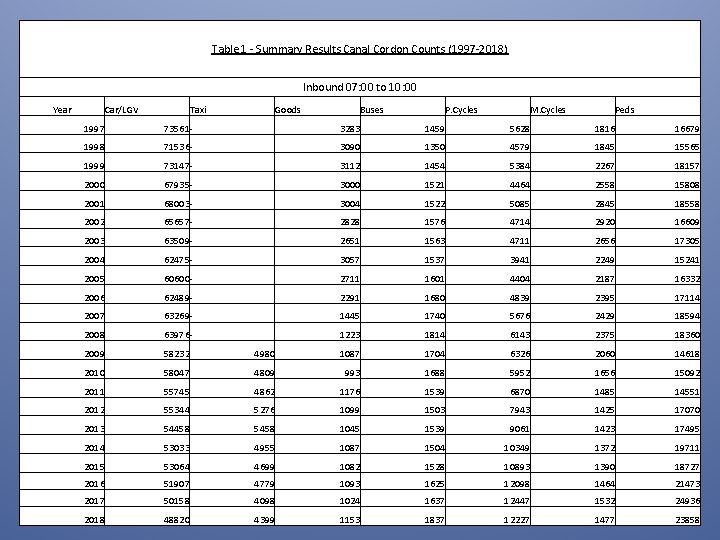
Table 1 - Summary Results Canal Cordon Counts (1997 -2018) Inbound 07: 00 to 10: 00 Year Car/LGV Taxi Goods Buses P. Cycles M. Cycles Peds 1997 73561 - 3283 1459 5628 1816 16679 1998 71536 - 3090 1350 4579 1845 15565 1999 73147 - 3112 1454 5384 2267 18157 2000 67935 - 3000 1521 4464 2558 15808 2001 68003 - 3004 1522 5085 2845 18558 2002 65657 - 2828 1576 4714 2920 16609 2003 63509 - 2651 1563 4711 2656 17305 2004 62475 - 3057 1537 3941 2249 15241 2005 60600 - 2711 1601 4404 2187 16332 2006 62489 - 2291 1680 4839 2395 17114 2007 63269 - 1445 1740 5676 2429 18594 2008 63976 - 1223 1814 6143 2375 18360 2009 58232 4980 1087 1704 6326 2060 14618 2010 58047 4809 993 1688 5952 1656 15092 2011 55745 4862 1176 1539 6870 1485 14551 2012 55344 5276 1099 1503 7943 1425 17070 2013 54458 5458 1045 1539 9061 1423 17495 2014 53033 4955 1087 1504 10349 1372 19711 2015 53064 4699 1082 1528 10893 1390 18727 2016 51907 4779 1093 1625 12098 1464 21473 2017 50158 4098 1024 1637 12447 1532 24936 2018 48820 4399 1153 1837 12227 1477 23858
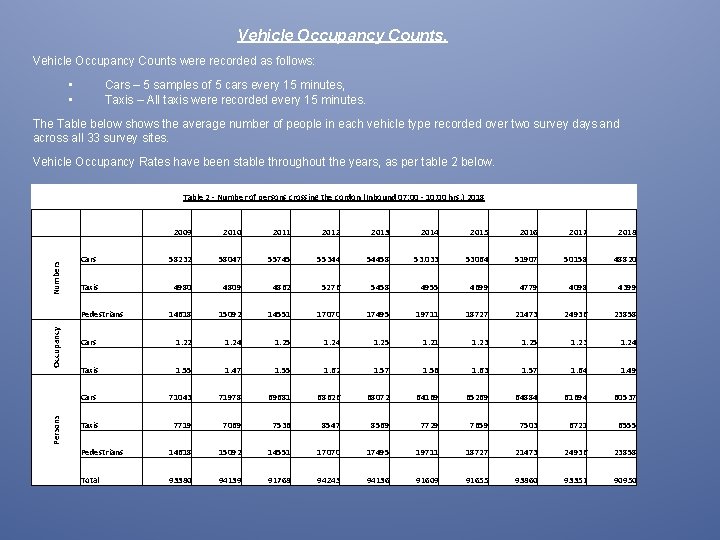
Vehicle Occupancy Counts were recorded as follows: • • Cars – 5 samples of 5 cars every 15 minutes, Taxis – All taxis were recorded every 15 minutes. The Table below shows the average number of people in each vehicle type recorded over two survey days and across all 33 survey sites. Vehicle Occupancy Rates have been stable throughout the years, as per table 2 below. Table 2 - Number of persons crossing the cordon (Inbound 07: 00 - 10: 00 hrs. ) 2018 Numbers 2009 2010 2011 2012 2013 2014 2015 2016 2017 2018 Cars 58232 58047 55745 55344 54458 53. 033 53064 51907 50158 48820 Taxis 4980 4809 4862 5276 5458 4955 4699 4779 4098 4399 14618 15092 14551 17070 17495 19711 18727 21473 24936 23858 Cars 1. 22 1. 24 1. 25 1. 21 1. 23 1. 25 1. 23 1. 24 Taxis 1. 55 1. 47 1. 55 1. 62 1. 57 1. 56 1. 63 1. 57 1. 64 1. 49 Cars 71043 71978 69681 68626 68072 64169 65269 64884 61694 60537 Taxis 7719 7069 7536 8547 8569 7729 7659 7503 6721 6555 Pedestrians 14618 15092 14551 17070 17495 19711 18727 21473 24936 23858 Total 93380 94139 91768 94243 94136 91609 91655 93860 93351 90950 Persons Occupancy Pedestrians
- Slides: 23