DIFFERENT MODES OF DATA COLLECTION DIFFERENT RESULTS Clara


- Slides: 13
DIFFERENT MODES OF DATA COLLECTION, DIFFERENT RESULTS? Clara Vital, Casimiro Balsa & Cláudia Urbano FCSH, Universidade Nova de Lisboa Authors disclose any conflict of interest.
National Surveys on Drugs are important data sources for empirical research in public health. Background However, the diversity of methods applied, make it difficult to compare results across surveys, time, or countries The aim of this study is to explore whether the prevalence rates of alcohol and drugs consumption indicators among general adult population differ when using CATI, CAWI or CAPI.
Our study was conducted in conjunction with the RARHA Reducing Alcohol Related Harm survey Methods I we proceeded to a selection of 24 questions (corresponding to 51 variables) from which we defined a common questionnaire to compare different survey techniques. We have limited the application of the questionnaire to the region of Lisbon and Oporto These were the size samples by mode: 589 telephone interviews were carried out in the CATI system; 622 online interviews, in the CAWI system (Panel users from INTERCAMPUS); and, 338 personal interviews, in the CAPI system.
The variables considered allow to compare the results obtained by each of the interview techniques at the following levels: Øprevalence rates of alcohol consumption; Methods II Øa test of alcohol abuse (RAPS); Øprevalence rates of illicit drugs, Ø sociodemographic. • For our initial proposes, we analyzed the data from the three surveys without weighting.
Sociodemographic data Respondents presented slightly different sociodemographic characteristics depending on the method of inquiry Gender ratio is similar in CAPI and CATI, with a more balanced distribution than in CAWI Results I CAWI sample has a younger sample compared to CATI and CAPI CATI and CAWI samples have a higher percentage of singles, compared with the CAPI sample Sample respondents in CATI and CAWI had higher percentages of higher education than those at CAPI It is among the respondents in CAWI that we find a greater number of workers
Alcohol consumption data Among CAPI respondents, we found the highest percentage of absenteeism in alcohol consumption, compared to those interviewed in CATI and mainly in CAWI Results II Respondents in the CAWI sample are more weekend drinkers, reporting a consumption of 1 to 2 days per week. Also in CATI there is a significant percentage of users with a consumption frequency of 1 to 2 days per week in the last 12 months, compared to those interviewed in CAPI. The sample respondents in CAPI and CATI presented daily intakes of alcoholic beverages higher than those sampled in CAWI sample presents the higher percentage of affirmative answers to the 4 items that compose the RAPS test. In the CAPI and CATI samples the percentages appear balanced.
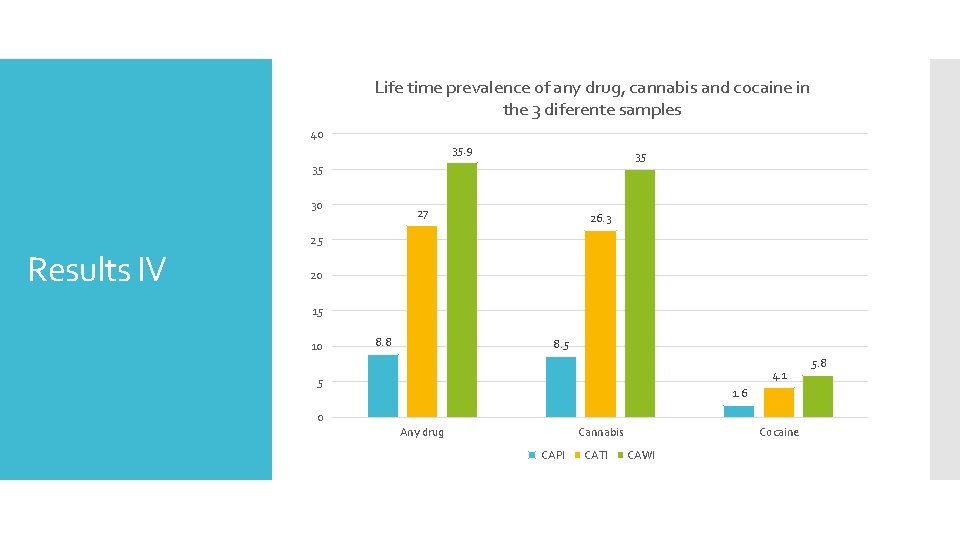
Drugs consumption data Results III It is among CAPI respondents that the prevalence of illicit psychoactive substance use is lower. Not only are they less likely to consume, as they are the ones that consumed a minor number of substances, and those who indicated that they were consumers, they consumed them less often. It is in CAWI, where the distance to the interviewer is greater, that we found the highest prevalence of consumption, the highest number of substances consumed and in a greater number of times.
Life time prevalence of any drug, cannabis and cocaine in the 3 diferente samples 40 35. 9 35 35 30 Results IV 27 26. 3 25 20 15 10 8. 8 8. 5 4. 1 5 1. 6 0 Any drug Cannabis CAPI CATI Cocaine CAWI 5. 8
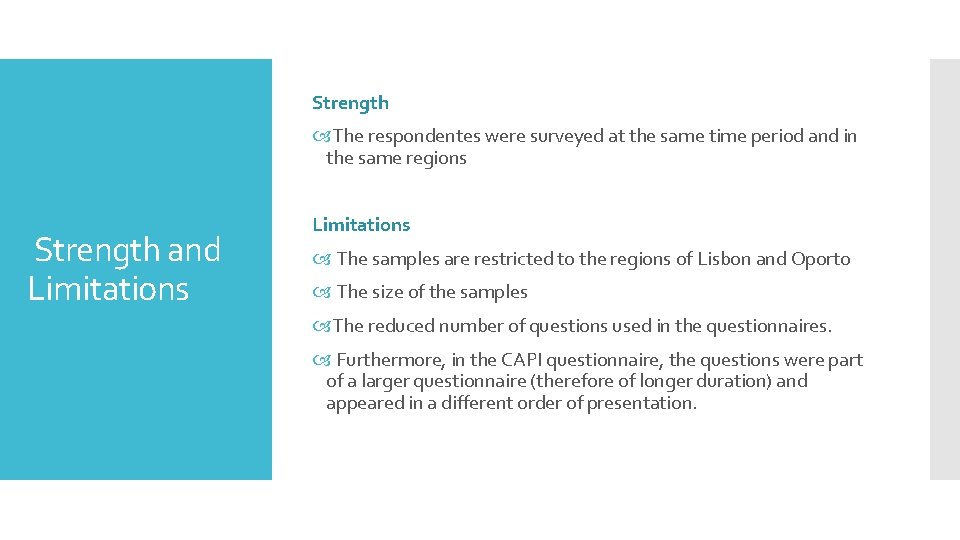
Strength The respondentes were surveyed at the same time period and in the same regions Strength and Limitations The samples are restricted to the regions of Lisbon and Oporto The size of the samples The reduced number of questions used in the questionnaires. Furthermore, in the CAPI questionnaire, the questions were part of a larger questionnaire (therefore of longer duration) and appeared in a different order of presentation.
We know that modes of data collection differ in a number of ways, including the method of contacting respondents, the means by which the questionnaire is delivered to respondents, and the way questions are administered. These may have an effect on the orientation of the responses and on the quality of the data collected. Conclusions I In any mode of administering the questionnaires, there are many potential influences on the responses. These differences, at different levels, may make it difficult to isolate the effects of each of the modes of data collection on the quality of the data obtained. Therefore, more than just using different modes of data collection, what seems to have effects on the results is rather a combination of factors.
Conclutions II Not forgetting that there are limitations, brought about by the type of survey databases that researchers have available, the possibilities of choosing the different methods of questionnaire administration, the conclusion that can be drawn from the analysis of the particular advantages and disadvantages of each method, is that this option can not be made without taking into account the nature of the information that one will or will not lose if one chose for the other methods. The findings of this study indicate that prevalence rates obtained from general population surveys can vary with the mode of data collection.
Balsa et al (2003). Inquérito Nacional ao Consumo de Substâncias Psicoativas na População Portuguesa 2001. Coleção Estudos-Universidades. Lisboa: Instituto da Droga e da Toxicodependência. Christian L. M. (2007). How Mixed-Mode Surveys are Transforming Social Research: The Influence of Survey Mode on Measurement in web and Telephone Surveys. Washington State University. De Leeuw, E. (2005). To Mix or Not to Mix Data Collection Modes in Surveys, Journal of Official Statistics, 21(2), 233– 255. De Leeuw, E. (2008). Choosing the method of data collection. In International Handbook of Survey Methodology, EAM series. Edited by De Leeuw E, Hox JJ, Dillman D. New York: Taylor & Francis, Prychology Press, 113– 135. De Leeuw, E. , Hox J. J. (2011). Internet surveys as part of a mixed-mode design. In Social and Behavioral Research and the Internet. Edited by Das M, Ester P, Kaczmirek L. New York, London: Routledge Taylor & Francis Group, 9. Dillman, D. , Smyth J. D. , Christian L. M. (2009). Internet, mail, and mixed-mode surveys: the tailored design method. Hoboken, New Jersey: John Wiley & Sons, Inc. Duffy, Bobby, Smith, Kate, Terhanian, George e Bremer, John (2005). Comparing data from online and face-to-face surveys. International Journal of Market Research, Bibliography Vol. 47, N. º 6, pp. 615 -639. Floyd, J. e Fowler, J. R. (2002). Survey Research Methods, 3 rd Edition, London: Sage. Hoebel et al. (2014) Mode differences in a mixed-mode health interview survey among adults. Archives of Public Health, 72: 46, pp. 1 -12. INE (2012). Inquérito às Despesas das Famílias 2010 -2011. Lisboa: Instituto Nacional de Estatística, I. P Kraus, Florian e Steiner, Viktor (1998). Modelling Heaping Effects in Unemployment Duration Models — With an Application to Retrospective Event Data in the German Socio-Economic Panel, Journal of Economics and Statistics, 217(5), 550 -573. Krosnick, J. A. (1991). Response strategies for coping with the cognitive demands of attitude measures in surveys. Applied cognitive psychology, 5(3), 213– 236. Krosnick, J. A. e Alwin, D. F. (1987). An Evaluation of a Cognitive Theory of Response-Order Effects in Survey Measurement. Public Opinion Quarterly, 51(2), 201– 219. Macer, T. (2005). Weaving, not drowning: an update on take-up and best practices in mixed- and multi-mode research. 2005. [www. meaning. uk. com/resources/ articles_papers/files/spss_directions_2005. pps] Vannette, David L. e Krosnick, Jon A. (2013). Answering Questions: A Comparison of Survey Satisficing and Mindlessness. E. U. A. : Stanford University. Winter, Marielle de, Cohen, Peter e Langemijer, Marieke (1999). Project to co-ordinate a methodological study to compare the prevalence of self-reported drug use in general population surveys, EMCDDA project CT. 97. EP. 02. Lisboa: EMCDDA
Thank you for your attention! claravital@fcsh. unl. pt cm. balsa@fcsh. unl. pt Claudia. urbano@fcsh. unl. pt