Macroeconomic Development in Emerging Markets Svetlana Ledyaeva Aalto


. 946 estimates")

 growth. MSCI")


")
 The slowdown")
 The emerging")
 Emerging markets have")


")


 EMs, unlike developed")


 exchange rates – important in comparison of living standards Monthly")


 “Western Offshoots” consist of the United States, Canada,")
")


- Slides: 62
Macroeconomic Development in Emerging Markets Svetlana Ledyaeva, Aalto University School of Business January 2019
Lecture plan Economic growth in emerging markets Business cycles in emerging markets Income distribution in emerging markets
Does economic growth attract FDI? Meta-regression analysis - Iamsiraroj and Doucouliagos (2015). 946 estimates from 140 empirical studies: 47 percent of the estimates are positive and statistically significant, 27 percent of the estimates are positive and statistically insignificant, 7 percent of the estimates are negative and statistically significant, 19 percent of the estimates are negative and statistically insignificant. The authors show that there is a robust positive correlation between growth and FDI.
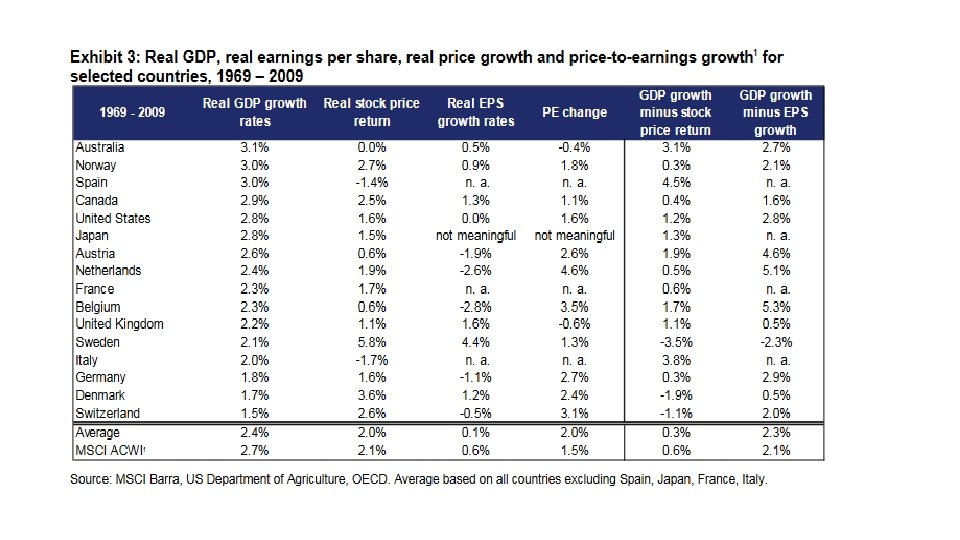
Is There a Link Between GDP Growth and Equity Returns? MSCI Barra Research Supply-side theoretical models Step 1: Over the long run, aggregate corporate earnings 1: tend to grow at the same pace as GDP.
Step 2: Aggregate corporate earnings growth translates into earnings per share (EPS) growth. MSCI Barra Research This assumption may be somewhat hasty/preliminary/rash (Bernstein and Arnott [2003]). There is indeed a distinction between growth in aggregate earnings of an economy and the growth in earnings per share to which current investors have a claim. These two growth rates do not necessarily match, match since there are factors that can dilute/weaken aggregate earnings. A portion of GDP growth comes from capital increases, such as new share issuances, rights issues, or IPOs (initial public offering), which increase issuances aggregate earnings but are not accessible to current investors. This dilution causes the growth in EPS available to current investors to be lower than growth in aggregate earnings.
Step 3: EPS growth translates into stock price increases 3: MSCI Barra Research This is only true however, if there are no changes in valuations (the price to earnings ratio) as illustrated by the equation below: Some research claims that there are no reasons for valuations to change over the long term, which supports the supply-side models. However, empirical tests show that valuations have generally expanded over the last 40 years (see ‘What Drives Long Term Equity Returns? ’ MSCI Barra [2010]). due to different regimes (declining inflation), better market and information efficiency, improved corporate governance.
Conclusions of analysis MSCI Barra Research We may intuitively think of stock returns as a result of the underlying real economy growth. However, long term real earnings growth fell behind long term GDP growth in many countries. Several factors may explain this discrepancy: • in today’s integrated world we need to look at global rather than local markets. • a significant part of economic growth comes from new enterprises and not the high growth of existing ones; this leads to a dilution of GDP growth before it reaches shareholders. • expected economic growth may be built into the prices and thus reduce future realized returns.
GDP growth and investment decisions http: //investing. covestor. com/2012/04/the-importance-of-gdp-to-an-investor • It can help you think about asset allocations when you compare GDP growth rates in one country relative to those in other countries. • The long-term trend of GDP is worth watching, especially when the trend becomes bad enough to raise speculation about quantitative easing (monetary stimulation), which has shown to have a strong effect on risk assets including stocks, gold and oil. QE leads to low interest rates. Low interest rates encouraged investors to buy stocks as opposed to traditional investments like savings accounts, certificates of deposits (CDs) and money market accounts since their rate of return are low due to low Federal/government/state rates. • There a lot of nitty-gritty details by sector. And those can help you figure out what’s going on in the broader business cycle, as well as with sector-specific investments.
Real GDP growth, IMF data
GDP growth in advanced emerging markets GDP growth, % 10. 0 8. 0 6. 0 4. 0 2. 0 0. 0 1961 -1970 1971 -1980 1981 -1990 1991 -2000 2001 -2010 2011 -2015 2016 -2017 -2. 0 -4. 0 -6. 0 Brazil Czech Republic Greece Hungary Mexico Malaysia Poland Thailand Turkey South Africa AEM
GDP growth in secondary emerging markets GDP growth, % 20 15 10 5 0 1961 -1970 1971 -1980 1981 -1990 1991 -2000 2001 -2010 2011 -2015 -5 United Arab Emirates Chile China Colombia Egypt, Arab Rep. Indonesia India Pakistan Peru Philippines Qatar Russian Federation SEM 2016 -2017
GDP growth in frontier markets GDP growth, % 45 40 35 30 25 20 15 10 5 0 1961 -1970 1971 -1980 1981 -1990 1991 -2000 2001 -2010 2011 -2015 2016 -2017 -5 Bangladesh Bulgaria Bahrain Cote d'Ivoire Cyprus Estonia Ghana Croatia Jordan Kenya Sri Lanka Lithuania Latvia Morocco Macedonia, FYR Malta Mauritius Nigeria Oman Romania Serbia Slovak Republic Slovenia Tunisia Vietnam FEM
GDP growth in advanced countries 8 7 6 5 4 3 2 1 0 1961 -1970 1971 -1980 1981 -1990 1991 -2000 2001 -2010 2011 -2015 -1 -2 Australia Austria Belgium Canada Switzerland Germany Euro area Spain European Union Finland France United Kingdom Ireland Italy Luxembourg Netherlands Norway New Zealand OECD members United States World 2016 -2017
Recent growth slowdown in emerging markets (Kose, Ohnsorge, Ye Vox. EU 2016)
What are the main characteristics of the slowdown? (Kose, Ohnsorge, Ye 2016) The slowdown has been unusually synchronous and protracted/longlasting. It has affected a sizeable number of emerging markets, especially large ones. By 2014, the number of emerging markets slowing for three consecutive years reached the levels seen during the Global Crisis of 2008 -09. Growth rates of investment and exports suffered especially sharp cutbacks, falling to less than half of their 2003 -08 average levels.
What are the key drivers of the slowdown? (Kose, Ohnsorge, Ye 2016) The emerging market growth slowdown was initially driven by external factors but domestic factors have increasingly weighed on growth since 2014. External factors: weak world trade, low commodity prices, and tightening financial conditions. Domestic factors: a steady slowdown in productivity growth, bouts of policy uncertainty, and an erosion of policy buffers that has made it difficult to support activity with fiscal and monetary stimulus.
Recent growth slowdown in emerging markets: Conclusion (Kose, Ohnsorge, Ye 2016) Emerging markets have come a long way over the past two decades – they have been able to improve their macroeconomic policy frameworks, reduce debt and inflation levels, diversify their production and exports, and establish stronger global trade and financial linkages. While the growth slowdown since 2010 could simply be a rough patch/bad luck, it could also signal the start of 2010 luck an era of slow growth given the persistent nature of the factors that have driven the slowdown so far. an era of slow growth In light of the significant global risks going forward, emerging markets urgently need to put in place an appropriate set of policies to address their cyclical and structural challenges and promote growth
Source: IHS Economics
According to the World Bank, by 2050 both China and India will have GDPs exceeding that of the United States.
Top 10 Country GDP Ranking History (1960 -2017)
Share in World GDP, 2017 Country United States China Japan Germany France United Kingdom India Brazil Italy Canada Korea Russia GDP in billion U. S. dollars % 19 362, 13 11 937, 56 4 884, 49 3 651, 87 2 574, 81 2 565, 05 2 439, 01 2 080, 92 1 921, 14 1 640, 39 1 529, 74 1 469, 34 24, 24 14, 95 6, 12 4, 57 3, 22 3, 21 3, 05 2, 61 2, 41 2, 05 1, 92 1, 84
Professor opinion: Anil Gupta, University of Maryland Long-term growth in EMs: base 10% growth has gone. Approx. 6% can be. Still 3 times higher than in developed countries. Fastest growth rates: India, Indonesia, Nigeria. Slowest growth rates: Russia, Brazil. China is becoming more developed and, hence, growth slows down. India and Indonesia – per capita income is lower than e. g. in China and Russia they (India and Indonesia) will grow upside. High growing sectors in EMs: Commodities because of high demand for commodities in China. Manufacturing driven by domestic consumption demand not by export.
Expert opinion: David Riedel, founder of Riedel research company In Emerging markets – should find something with hypergrowth, not moderate growth because risks are very high.
Where will be the highest growth of GDP next? Video of March 2018
If not GDP growth? The trendline of GDP growth is not going to tell you for sure where the markets may be headed. Other economic indicators that have a strong tie to market economic indicators direction, including initial jobless claims, inflation, government policies, Central Bank policies. Broader issues including natural disasters, wars, broad changes in the Broader issues government policies, other events that cannot be planned or avoided.
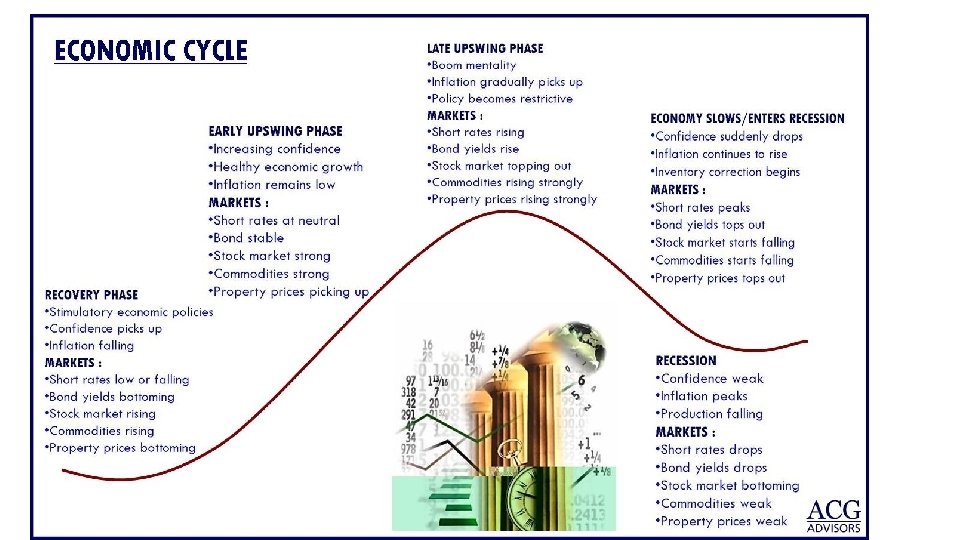
Business cycles and investment decisions The business cycle is a long-term pattern of changes in Gross Domestic Product (GDP) that follows four stages: expansion, prosperity, contraction, and recession. The phases of the business cycle are characterized by changing employment, industrial productivity, and interest rates. As a result the economic cycle provides the strategic framework for economic activity and investing. The business cycle affects employees, employers and investors.
Business cycles and investors The business cycle has implications for markets and investors. Recession weak stock prices (stock prices fall), or a bear market Investors anticipate losses in a bear market and selling continues Expanding economy that keeps inflation from rising too quickly a bull market (stock prices rise or are expected to rise), or period of sustained market growth. (stock prices rise or are expected to rise) A bull market is a financial market of a group of securities in which prices are rising or are expected to rise.
Some economists believe that stock price trends precede business cycle stages
Business cycles and investment strategies: Sectoral approach There are investment strategies for all parts of the cycle. Companies that do well when the economy is experiencing good times are called cyclical stocks: stocks Travel and leisure companies, airlines, consumer electronics firms and jewelry makers. Companies that make goods that are necessities, such as food and health care called non -cyclical stocks. These stocks tend to provide more stability during an economic downturn. -cyclical stocks During an economic expansion one should invest in cyclical stocks. During an economic contraction one should consider investing in non-cyclical stocks.
Business cycles in emerging markets García-Cicco et al. , American Economic Review 2010: The volatility of business cycles in industrialized countries fell significantly in the second half of the twentieth century. In sharp contrast, in EMs business cycles do not appear to moderate after the Second World War. Aguiar and Gopinath, Journal of Political Economy 2007: EMs on average have a business cycle twice as volatile as that of their developed counterparts. A striking feature that distinguishes the business cycles in the two is the strongly countercyclical nature of the trade balance for EMs as compared to developed markets. A second regularity is that consumption is 40 percent more volatile than income at business cycle frequencies for EMs, as compared to a ratio of little less than one for developed markets. In addition, income growth and net exports are twice as volatile in EMs.
Shocks to trend in emerging markets (Aguiar and Gopinath, JPE 2007) EMs, unlike developed markets, are characterized by frequent regime switches, a premise/condition motivated by the dramatic reversals in fiscal, monetary, and trade policies observed in these economies. Consequently, shocks to trend growth are the primary source of fluctuations in these markets as opposed to transitory fluctuations around the trend in developed countries. Developed markets are characterized by a relatively stable trend.
Characterizing the business cycles of emerging economies (Calderon and Fuentes, World Bank Policy reserach working paper, 2010) Greater volatility in EMs’ business cycles: the excessive dependence on a few (and volatile) sectors, a narrow tax base, weak institutions and poor economic policies. More recently, the focus has been gradually shifted towards the external (exogenous) environment faced by EMs —say, real shocks (e. g. shocks to commodity prices and to the country’s external demand), financial shocks (sudden stops of capital inflow due to changes in global liquidity conditions) and natural disasters (Calderon and Levy‐Yeyati, 2009). A quarterly database for 23 EMs and 12 developed countries over the period 1980. Q 1– 2006. Q 2: They find that recessions are deeper and more frequent among EMs (especially, among LAC countries) and that expansions are more sizable and longer (especially, among East Asian countries).
Business Cycles In Emerging Economies General conclusions (Neumeyer and Fabrizio, Journal of Monetary Economics 2005) EMs display high, relative to developed economies, output volatility, and the volatility of consumption relative to income is on average greater than one and higher than in the developed economies. Finally, net exports appear much more strongly countercyclical in emerging economies than in developed economies. i. e. net export tends to rise during recessions and offset some of the falls in the output.
0 -5 gdp_growth exp_growth -10 -15 imp_growth 2015 2014 2013 2012 2011 2010 2009 2008 2007 2006 2005 2004 2003 2002 2001 2000 1999 1998 1997 1996 1995 1994 1993 1992 exp_growth 1991 1990 1989 1988 1987 gdp_growth 1986 1985 1984 1983 1982 1981 1980 1979 1978 1977 1976 1975 1974 1973 1972 1971 1970 1969 1968 1967 1966 1965 1964 1963 1962 1961 -10 1961 1962 1963 1964 1965 1966 1967 1968 1969 1970 1971 1972 1973 1974 1975 1976 1977 1978 1979 1980 1981 1982 1983 1984 1985 1986 1987 1988 1989 1990 1991 1992 1993 1994 1995 1996 1997 1998 1999 2000 2001 2002 2003 2004 2005 2006 2007 2008 2009 2010 2011 2012 2013 2014 2015 0 1960 Business cycles in emerging markets: Some examples Chile, % 50 40 30 20 10 -20 imp_growth Colombia, % 30 25 20 15 10 5
0 -20 gdp_growth exp_growth -10 imp_growth 2015 2014 2013 2012 2011 2010 2009 2008 2007 2006 2005 2004 2003 2002 2001 2000 1999 1998 1997 1996 1995 1994 1993 1992 exp_growth 1991 1990 1989 1988 1987 gdp_growth 1986 1985 1984 1983 1982 1981 1980 1979 1978 1977 1976 1975 1974 1973 1972 1971 1970 1969 1968 1967 1966 1965 1964 1963 1962 1961 1960 -5 60 19 61 19 62 19 63 19 64 19 65 19 66 19 67 19 68 19 69 19 70 19 71 19 72 19 73 19 74 19 75 19 76 19 77 19 78 19 79 19 80 19 81 19 82 19 83 19 84 19 85 19 86 19 87 19 88 19 89 19 90 19 91 19 92 19 93 19 94 19 95 19 96 19 97 19 98 19 99 20 00 20 01 20 02 20 03 20 04 20 05 20 06 20 07 20 08 20 09 20 10 20 11 20 12 20 13 20 14 20 15 19 Brazil, % 35 30 25 20 15 10 5 0 -15 -20 imp_growth South Africa, % 40 30 20 10
0 -10 gdp_growth exp_growth -20 -30 imp_growth 2015 2014 2013 2012 2011 2010 2009 2008 2007 2006 2005 2004 2003 2002 2001 2000 1999 1998 1997 1996 1995 1994 exp_growth 1993 1992 1991 1990 1989 gdp_growth 1988 1987 1986 1985 1984 1983 1982 1981 1980 1979 1978 1977 1976 1975 1974 1973 1972 1971 1970 1969 1968 1967 1966 1965 1964 1963 1962 1961 60 19 61 19 62 19 63 19 64 19 65 19 66 19 67 19 68 19 69 19 70 19 71 19 72 19 73 19 74 19 75 19 76 19 77 19 78 19 79 19 80 19 81 19 82 19 83 19 84 19 85 19 86 19 87 19 88 19 89 19 90 19 91 19 92 19 93 19 94 19 95 19 96 19 97 19 98 19 99 20 00 20 01 20 02 20 03 20 04 20 05 20 06 20 07 20 08 20 09 20 10 20 11 20 12 20 13 20 14 20 15 -20 1960 19 Bangladesh, % 100 80 60 40 20 0 -40 imp_growth Greece, % 40 30 20 10
0 -5 gdp_growth 1988 exp_growth -10 -15 imp_growth 2015 2014 2013 2012 2011 2010 2009 2008 2007 2006 2005 2004 2003 2002 2001 2000 1999 1998 1997 1996 1995 1994 1993 exp_growth 1992 1991 1990 1989 gdp_growth 1987 1986 1985 1984 1983 1982 1981 1980 1979 1978 1977 1976 1975 1974 1973 1972 1971 1970 1969 1968 1967 1966 1965 1964 1963 1962 1960 1961 1962 1963 1964 1965 1966 1967 1968 1969 1970 1971 1972 1973 1974 1975 1976 1977 1978 1979 1980 1981 1982 1983 1984 1985 1986 1987 1988 1989 1990 1991 1992 1993 1994 1995 1996 1997 1998 1999 2000 2001 2002 2003 2004 2005 2006 2007 2008 2009 2010 2011 2012 2013 2014 2015 -10 1961 0 1960 Business cycles in developed countries for comparison Germany, % 50 40 30 20 10 -20 imp_growth USA, % 25 20 15 10 5
Business cycles in emerging economies: Illustration García-Cicco et al. AER, 2010.
10 9 8 7 6 5 4 3 2 1 0 2014 2012 2010 2008 2006 2004 2002 2000 1998 1996 1994 1992 1990 1988 1986 1984 1982 1980 1978 1976 1974 1972 1970 1968 1966 1964 1962 10 9 8 7 6 5 4 3 2 1 0 2014 2012 2010 2008 2006 2004 2002 2000 1998 1996 1994 1992 1990 1988 1986 China 1984 62 64 68 19 70 19 72 19 74 19 76 19 78 19 80 19 82 19 84 19 86 19 88 19 90 19 92 19 94 19 96 19 98 20 00 20 02 20 04 20 06 20 08 20 10 20 12 20 14 19 66 19 19 Bangladesh 1982 1980 1978 1976 1974 1972 1970 1968 1966 1964 1962 1960 60 19 19 1960 1962 1964 1966 1968 1970 1972 1974 1976 1978 1980 1982 1984 1986 1988 1990 1992 1994 1996 1998 2000 2002 2004 2006 2008 2010 2012 2014 7. 2 7 6. 8 6. 6 6. 4 6. 2 6 5. 8 5. 6 5. 4 5. 2 1960 More data… Log GDP per capita, deflated by US GDP deflator, USD Chile 12 10 8 6 4 2 0 Colombia
3 1 2 0 1 0 80 2012 2014 2008 2010 2012 2014 2008 2006 2000 1998 1996 1994 1992 1990 1988 1986 1984 1982 1980 1978 1976 1974 1972 2006 4 2004 5 2004 6 2002 10 2002 Iran, Islamic Rep. 2000 1998 1996 3 1994 4 1992 7 1990 5 1988 8 1986 9 6 1984 7 1970 Ghana 1982 India 1980 8 1978 0 1976 0 1974 2 1972 1 1970 2 1968 6 1968 3 1966 4 1966 8 1964 5 1964 10 1962 6 1960 7 1962 60 62 19 64 19 66 19 68 19 70 19 72 19 74 19 76 19 78 19 80 19 82 19 84 19 86 19 88 19 90 19 92 19 94 19 96 19 98 20 00 20 02 20 04 20 06 20 08 20 10 20 12 20 14 19 19 8 1960 82 19 84 19 86 19 88 19 90 19 92 19 94 19 96 19 98 20 00 20 02 20 04 20 06 20 08 20 10 20 12 20 14 19 19 78 19 76 19 74 19 72 19 70 19 68 19 66 19 64 19 62 19 2 60 19 More data… Log GDP per capita, deflated by US GDP deflator, USD Greece 12 4
66 08 0 6 10 9 8 7 6 5 3 5 2 4 1 3 0 2 1 2014 2012 2010 2008 2006 2004 2002 2000 1998 1996 1994 1992 1990 1988 1986 Kenya 1984 1982 1980 1978 1976 1974 1972 1970 1968 1966 1 1964 2 1962 3 1960 12 20 14 20 10 20 20 06 20 04 20 02 20 00 20 98 19 96 19 94 19 92 19 90 19 88 19 86 19 84 19 82 19 80 19 78 19 76 19 74 19 72 19 70 19 68 19 5 62 19 64 19 66 19 68 19 70 19 72 19 74 19 76 19 78 19 80 19 82 19 84 19 86 19 88 19 90 19 92 19 94 19 96 19 98 20 00 20 02 20 04 20 06 20 08 20 10 20 12 20 14 64 19 6 60 62 19 7 19 60 19 19 8 19 4 60 19 62 19 64 19 66 19 68 19 70 19 72 19 74 19 76 19 78 19 80 19 82 19 84 19 86 19 88 19 90 19 92 19 94 19 96 19 98 20 00 20 02 20 04 20 06 20 08 20 10 20 12 20 14 19 More data… Log GDP per capita, deflated by US GDP deflator, USD Morocco 8. 5 8 7. 5 4 7 6. 5 Mexico Malaysia 10 9 8 7 6 0
60 6 5 4 3 2 1 0 10 9 8 7 6 5 4 3 2 1 0 Philippines 8 10 7. 8 9 7. 6 8 7. 4 7 7. 2 6 7 5 6. 8 4 6. 6 3 6. 4 2 6. 2 1 6 0 2014 2012 2010 2008 2006 2004 2002 2000 1998 1996 1994 1992 1990 1988 8 1986 1984 1982 1980 1978 1976 1974 1972 1970 1968 1966 1964 1962 1960 66 19 68 19 70 19 72 19 74 19 76 19 78 19 80 19 82 19 84 19 86 19 88 19 90 19 92 19 94 19 96 19 98 20 00 20 02 20 04 20 06 20 08 20 10 20 12 20 14 19 62 19 19 7 19 60 19 62 19 64 19 66 19 68 19 70 19 72 19 74 19 76 19 78 19 80 19 82 19 84 19 86 19 88 19 90 19 92 19 94 19 96 19 98 20 00 20 02 20 04 20 06 20 08 20 10 20 12 20 14 19 60 19 More data… Log GDP per capita, deflated by US GDP deflator, USD Pakistan Peru Thailand
60 60 19 62 19 64 19 66 19 68 19 70 19 72 19 74 19 76 19 78 19 80 19 82 19 84 19 86 19 88 19 90 19 92 19 94 19 96 19 98 20 00 20 02 20 04 20 06 20 08 20 10 20 12 20 14 2 19 12 20 14 20 10 20 08 20 06 20 04 20 02 20 00 20 98 19 96 19 94 19 92 19 90 19 88 19 86 19 84 19 82 19 80 19 78 19 76 19 74 19 72 19 70 19 68 19 66 19 64 19 62 19 19 4 19 60 19 62 19 64 19 66 19 68 19 70 19 72 19 74 19 76 19 78 19 80 19 82 19 84 19 86 19 88 19 90 19 92 19 94 19 96 19 98 20 00 20 02 20 04 20 06 20 08 20 10 20 12 20 14 19 62 19 19 More data… Log GDP per capita, deflated by US GDP deflator, USD Australia Canada 12 11. 4 10 10. 9 8 10. 4 6 9. 9 9. 4 8. 9 8. 4 Japan United Kingdom 12 12 10 10 8 8 6 6 4 4 2 2 0 0
Professor opinion: Paul Marsh, London Business School EMs are only marginally more volatile than developed ones and are becoming increasingly less volatile Typical EM is probably 10 -15% more volatile than average developed market. EMs have developed and risk has reduced.
Expert opinion: John Greenwood, chief economist at Invesco Developed market – a long extended slow recovery from recession. Emerging market – can have much shorter and sharper cycles within a single cycle of the developed countries.
Professor opinion: Eswar Prasad, Professor at Cornell University Recessions in EMs generally deeper & more protracted/longstanding than those in advanced countries. Co-movements between emerging and advanced economies in business cycles went up in 1985 -2008 versus 1960 -1984. Financial markets do Tango together. Stronger linkages & spillovers among global financial markets, especially equity.
Professor opinion: Eswar Prasad, Professor at Cornell University What changed for EMs business cycles? -Stronger global trade&financial linkages -More diversified economic structure: Production, trade. -Stronger linkages among EMs. -Better policies. EMs are more exposed to global cycles than before.
Income distribution among emerging markets Why should we care about cross-country income differences? High income levels reflect high standards of living. Income per capita differences are strongly associated with differences in consumption and in health. Thus the richest countries are not only producing more than 30 times as much as the poorest countries, but are also consuming 30 times as much. Similarly, cross-country differences in health are quite remarkable; while life expectancy at birth is as high as 80 in the richest countries, it is only between 40 and 50 in many Sub-Saharan African nations. These gaps represent huge welfare differences.
Purchasing Power Parity (PPP) exchange rates – important in comparison of living standards Monthly income of 150 USD is USA – you will live in the closet. Monthly income of 150 USD in China - pretty good live. Comparison of PPP GDP/Income per capita is more justified. PPP dollar takes into account the fact that it is cheaper to live in some countries than others. The idea is that we don't care how many actual dollars somebody is paid in, say, China, but we care about what sort of stuff those dollars can buy.
PPP dolar ILO economist Patrick Belser explains: "If someone in China takes their salary of 1, 500 yuan per month and they go to the bank, they will actually get $200, " "But this is not what we use to compute this global average, because what is important here is what people are able to buy with these 1, 500 yuan, and this is where we compare to the purchasing power of the US dollars and find that it is actually equivalent to around $400. "
PPP adjusted GDP per capita, 1990 and 2015, distribution histogram, The World, USD 160 1. 20 151 140 0. 92 118 120 1. 00 0. 98 0. 99 0. 94 0. 99 1. 00 0. 85 0. 80 100 0. 65 80 0. 60 60 0. 40 35 40 0. 20 18 20 12 1 0 20000 40000 Num. of. Countries_1990 6 1 60000 Num. of. Countries_2015 80000 Cum_Percent_1990 4 0 Cum_Percent_2015 More 0. 00
Discussion There is great inequality in income per capita across countries as shown by the highly dispersed distributions. Most countries have their per capita incomes in the lowest part of income per capita distribution. Smaller concentration of countries in the ”poor” tail in 2015. More equal GDP per capita distribution in 2015. Note: in 1990 we include 166 countreis and in 2015 – 182.
What factors are responsible for current GDP per capita differences between the countries? Initial gap Conditional convergecne Growth rates
The lower GDP per capita… The higher the potential growth rate. “If all economies were intrinsically the same, except for their starting capital intensities (which is determined by GDP per capita), then convergence would apply in an absolute sense; that is, poor places would tend to grow faster per capita than rich ones. ” “However, if economies differ in various respects —including propensities to save and have children, willingness to work, access to technology, and government policies— then the convergence force applies only in a conditional sense. ” “The growth rate tends to be high if the starting per capita GDP is low in relation to its long–run or steady state position; that is, if an economy begins far below its own target position. ” (Barro, NBER WP, 1996)
Initial gap between countries (Acemoglu 2007) “Western Offshoots” consist of the United States, Canada, Australia and New Zealand.
Initial gap between countries (Zhang and Gao 2015 IMF Working Paper)
PPP adjusted GDP per capita, current international dollars, advanced emerging countries 40000 35000 30000 25000 20000 15000 10000 5000 0 1991 1992 1993 1994 Brazil 1995 1996 1997 Czech Republic 1998 1999 Greece 2000 2001 Hungary 2002 2003 Mexico 2004 2005 Malaysia 2006 2007 Poland 2008 2009 Thailand 2010 2011 Turkey 2012 2013 2014 South Africa 2015 2016 2017
PPP adjusted GDP per capita, current international dollars, secondary emerging countries 1 140000 120000 100000 80000 60000 40000 20000 0 1991 1992 1993 United Arab Emirates 1994 1995 Chile 1996 China 1997 1998 Colombia 1999 2000 2001 Egypt, Arab Rep. 2002 2003 2004 Indonesia 2005 India 2006 2007 Pakistan 2008 2009 Peru 2010 2011 Philippines 2012 2013 Qatar 2014 2015 2016 Russian Federation 2017
PPP adjusted GDP per capita, current international dollars, secondary emerging countries 2 30000 25000 20000 15000 10000 5000 0 1991 1992 1993 1994 Chile 1995 China 1996 1997 Colombia 1998 1999 2000 Egypt, Arab Rep. 2001 2002 2003 Indonesia 2004 India 2005 2006 Pakistan 2007 2008 Peru 2009 2010 Philippines 2011 2012 2013 2014 Russian Federation 2015 2016 2017
PPP adjusted GDP per capita, current international dollars, developed countries 70000 60000 50000 40000 30000 20000 10000 0 1991 1992 Australia 1993 1994 Austria 1995 1996 Belgium 1997 1998 Canada 1999 2000 Germany 2001 2002 2003 European Union 2004 2005 Finland 2006 2007 France 2008 2009 2010 United Kingdom 2011 2012 2013 OECD members 2014 2015 2016 United States 2017