Economic geography of Russia Svetlana Ledyaeva Aalto University


 Is territorially the world’s largest country. It occupies")
 Russia is divided into 8 Federal districts and 83/85")
")
 (8) Federal District Territory, Population,")
 Map of Russian regions")
 83/85 (+2 Crimea and Sevastopol) federal subjects (Russian regions)")
 (adopted from Markevich and Mihailova lecture,")
 in Russia’s regions, ⁰ C")
 in Russia’s regions, millimeters (13)")
 and precipitation (mm, right graph) in 1960")
 Do you think that Russia`s tough climate conditions and huge territory")
 (16)")
")
")
")
")
")
")
 53% in the Ural Federal District, it is")
 (24)")
")
 (26)")
 Source: MIT CENTER for Energy and")
")
")
")
 Kansk-Achinsk Kuzbass")
")
 Caucasus Red and pink areas are")
")
")
 (36) • History of Russian")
 (Markevich and Mihailova lecture, 2011) • Migration to")
 (Markevich and Mihailova lecture, 2011) •")
 Unfavorable demographic developments: • • •")
 (Markevich and Mihailova")
 Density, persons per sq. km.")
")
 (43) •")
")
 (Markevich and Mihailova lecture, 2011)")
 http: //urbanica. spb. ru/? p=1321&lang=en")
 City Moscow St. Petersburg Region Moscow St.")
 Cluster definition from Michael Porter: “Geographic concentrations of interconnected companies, specialized")
 Though the cluster strategy has been taken up only")
 In 2012: competition of pilot programs of")
")


,")


- Slides: 60
Economic geography of Russia Svetlana Ledyaeva Aalto University School of Business
What we have learned from previous lecture Structural changes in the Russian economy in the last 25 years: ü industries based on natural resources (fuels, metals) and market servicers (business, financial, real estate) have increased their shares in the Russian economy; ü agriculture, machinery and equipment have decreased their shares in the Russian economy dramatically. Ownership in natural resource sector is highly concentrated (oligarchs and State). Foreign investors mainly present in food industry. Russian economy suffers from Dutch disease.
Learning outcomes Regional geography of Russia Factors of geographical allocation of economic activities in Russia: -climate and natural resources; -history and policy. Population geography of Russia Allocation of industry across Russia Geography of Industrial clusters in Russia
Basic geographical facts about Russia (4) Is territorially the world’s largest country. It occupies most of Eastern Europe and North Asia, stretching from the Baltic Sea in the West to the Pacific Ocean in the East, and from the Arctic Ocean in the North to the Black Sea and the Caucasus in the South. It is bordered by Norway and Finland in the northwest; Estonia, Latvia, Belarus, Ukraine, Poland, and Lithuania in the West; Georgia and Azerbaijan in the southwest; and Kazakhstan, Mongolia, China, and North Korea along the southern border. Is 9 th country in the World by population (after China, India, USA, Indonesia, Brazil, Pakistan, Nigeria, Bangladesh).
Regional Geography of Russia (6) Russia is divided into 8 Federal districts and 83/85 Federal subjects. The Federal Districts are president's groupings of Federal subjects of Russia. Federal districts are not created by the Russian constitution or any law and are not the constituent units of Russia. Each district includes several Federal subjects (Russian regions) in such a way that every Russian region is included in one of the eight federal districts.
8 Federal districts (7)
8 Federal distrcis: comparative characteristics (1 st Jan. 2013) (8) Federal District Territory, Population, Density thousands (th. /1 sq. s sq. Km. people Km) Russia 17, 098 143, 347 N. of cities 8. 4 10, 973 N. of small towns % of GDP per GDP, capita, USD, 2013 12, 354 100% 11 816, 37 650 38, 679 59. 5 3, 073 3, 075 35, 1% 15 374, 17 1, 687 13, 718 8. 1 146 1, 414 10, 3% 12 747, 00 Southern FD 421 13, 910 33. 1 79 46 6, 5% North Caucasus FD 170 9, 540 56 56 36 2, 5% Volga FD 1, 037 29, 772 28. 7 198 259 15, 9% Ural FD 1, 819 12, 198 6. 7 115 74 14, 2% Siberia FD 5, 145 19, 278 3. 7 130 224 10, 2% Far Eastern FD 6, 169 6, 252 1 66 1, 484 5, 2% Central FD North West FD Areas of economic specialization Capital Moscow Machinery, banking, retail Machinery, forestry, fishing Moscow St. Petersburg 7 947, 60 Agriculture, recreation Rostov-na-Donu Agriculture, metalintensive machinery, 4 461, 25 Pyatigorsk chemical industry Oil and gas, 9 043, 35 machinery, agriculture. Nizhni Novgorod Oil and Gas, 19 656, 72 metullargy, defence Ekaterinburg Coal mining, metals, 9 011, 08 forestry Novosibirsk 14 131, 50 Fisging, defence Khabarovsk
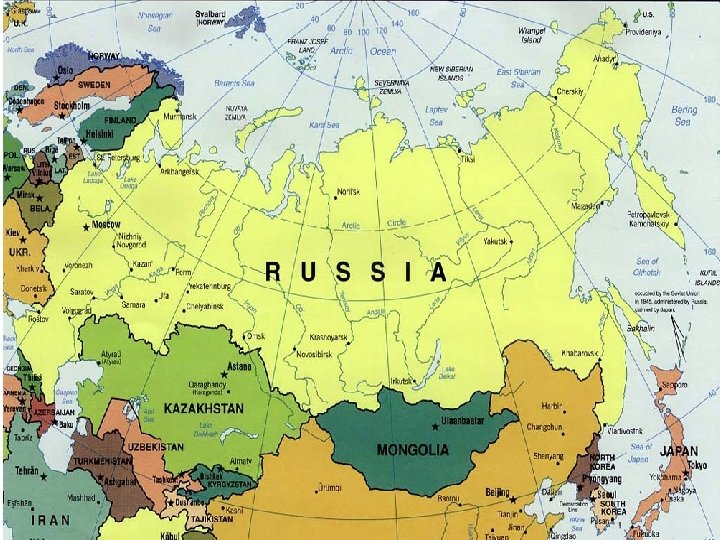
Modern Map of Russian regions (9) Map of Russian regions
Russian regions: basic information (10) 83/85 (+2 Crimea and Sevastopol) federal subjects (Russian regions) which possess varying levels of autonomy. 14 federal republics – more independence; 15 th – Republic of Crimea 2 federal cities – Moscow and Saint-Petersburg; 3 rd - Sevastopol Max population - 11, 503, 501 – Moscow city; Min population - 42, 090 - Nenets Autonomous Okrug. Average population – 3, 389, 968. Max area - 3, 103, 200 sq. km. – Sakha Yakutia Republic; Min area – 1, 100 sq. km. - Moscow city. Average area – 84, 244 sq. km. All regions are grouped in 8 federal districts to streamline regions based on central government policy (e. g. military and security).
Geographical allocation of economic activity in Russia (11) (adopted from Markevich and Mihailova lecture, 2011) = Three standard forces at work: 1. First nature of geography (endowment) • climate, terrain, natural resources • • History Policy • last 20 years 2. Second nature of geography (man-made infrastructure) These are the main factors explaining current location of productive resources 3. Third nature of geography (interaction among economic agents)
Climate of Russia. Map of average temperature (1998 -2011) in Russia’s regions, ⁰ C (12)
Map of average annual precipitation (1998 -2011) in Russia’s regions, millimeters (13)
Average monthly temperature (⁰ C, left graph) and precipitation (mm, right graph) in 1960 -90 (14)
Open questions (15) Do you think that Russia`s tough climate conditions and huge territory could be major factors of its failure in economic development (historical) in comparison with the West and now China? How these factors can affect governance, corruption practices, etc. ?
Natural resources in Russia (Markevich and Mihailova lecture, 2011) (16)
Permafrost in Russia (17)
Natural resources of Russia World gas reserves (18)
World oil reserves (19)
World gold reserves (20)
World coal reserves (21)
Distribution of natural resources across Russia. Natural resources by Federal district (22)
Natural resources by Federal district (23) 53% in the Ural Federal District, it is due to very Ural Federal District well developed oil and gas provinces, East of the Urals. The relatively low figure in the East shows that the area, in fact, is not very well explored.
Russia oil and gas operations (May 2013) (24)
Main oil producing areas and pipelines (25)
Proposed oil pipelines (BBC news) (26)
Gas fields and gas pipelines in Russia (27) Source: MIT CENTER for Energy and Environmental Policy Research (July 2011), IEA 2009, Gazprom
Northern Stream Pipeline (28)
Southern Stream Pipeline (29)
Power of Siberia stream pipeline (30)
Russia`s coal reserves (31) Kansk-Achinsk Kuzbass
USSR Metallurgy 1974 (32)
Intensity of Russian agriculture as of 2006 (33) Caucasus Red and pink areas are intensively used (though not necessarily producing maximum yields). Orange areas have large-scale farming, but little investment in machinery and fertilizers. Blue is occupied by reindeer production. Green is classed as "unused. " Note that this map does not take into consideration areas under heavy forestation that may be more effectively used for timber rather than agriculture. Graph source: IIASA
Wheat growing in Russia (34)
Forest sector: wood substance in million cubic meters across Russia (35)
History of population dynamics (Markevich and Mihailova lecture, 2011) (36) • History of Russian Empire = territorial expansion – Core regions (traditionally Russian): Moscow and North-West – The rest of the country was a frontier at some point in history è spatial population dynamics • History of the USSR = regional industrial policy
Population diffusion in Russian Empire (37) (Markevich and Mihailova lecture, 2011) • Migration to better lands: shift to the south and eastward – Constraint: external (nomad) military threat • Low level of migration: 0. 2 percent per year in the 17 -19 th Cc. (Mironov 1999) – State-controlled migration • Barriers to migration (elites demand cheap labor in ‘old’ regions) – Domar hypothesis (1970): serfdom introduced because of negative shock to labor to land ratio in the 16 th C. è Overpopulation in the central and black earth region
Population diffusion in the 20 th century (38) (Markevich and Mihailova lecture, 2011) • Late 19 – early 20 th Cc. - relatively free migration – the only period in Russian history! èRapid growth of migration to South Siberia and redistribution of labor onto available land – Constraints: transportation costs and poor access to credit (Chernina et al. 2011) • Back to state control during the Soviet times • Eastward (and to the north) shift of population because of industrial policy – The World War II shock
Population trends after collapse of Soviet Union (39) Unfavorable demographic developments: • • • Falling fertility. The crude birth rate (births per 1000 population) declined from 12. 1 in 1991 to 8. 6 in 1997. But increase to 12. 5 in 2010. Increasing mortality: 1990 – 11. 2; 2000 – 15. 4; 2010 – 14. 2. Negative natural increase: From 1992 to 1998, Russia's population declined by approximately 1. 4 million. Three distinct patterns have emerged since the collapse of the Soviet state: High levels of in-migration to the Russian Federation from other countries; Rapid out migration from Russia's northern and eastern regions to its western, southern, and central regions; • The response of net regional migration rates to increasingly varied regional labor market conditions. • •
So, how does Russian population geography compare to other countries’? (40) (Markevich and Mihailova lecture, 2011) • Large share in cold climates. • Too spread out – Centered population concentration measures are among the lowest cross-country (Campante&Do, 2009). – Why? Not only endowment, but also Soviet policy. • Far from borders, ports, world markets – Soviet legacy • On the other hand, infrastructure, transport, political power are too centralized – connections center-periphery dominate – (exceptions in Siberia, b/c of linear geographical structure) – connections between peripheral regions are weak (L. Dienes: “Archipelago Russia”) – Why? Legacy of centralized state + territorial expansion
Population density of modern Russia, 2012 (41) Density, persons per sq. km.
Geography of nationalities in Russia (42)
What do we know about Russian cities? (Markevich and Mihailova lecture, 2011) (43) • Too many of them for the population size – meaning, they are too small on average • Too few of them for the territory – meaning, they are too far away from each other (Treivish, 2007) • Mono-cities – one dominant employer. è Agglomeration externalities are weak (exceptions are few: Moscow, Saint Petersburg, Ekaterinburg, …): • Agglomeration index: Russia – 65%, OECD – 78%. Agglomeration index is equal to the share of population that lives within 60 minutes of travel time to the major population center or in a city of at least 50 thousand people and at least as dense as 150 people per square km. • Many are essentially rural population centers – was this way since imperial times
Million cities of Russia (44)
Industrial and regional policy: Transition and present time (45) (Markevich and Mihailova lecture, 2011) • Population migration – General trend: from North and East to South and West (reversal of Soviet subsidized trend), concentration (Heleniak, 2002, Kim 2007, others) – Exceptions: oil regions • Regional investment – market potential attracts, remoteness dampens investment, concentration (Brown at al, 2008, others) – Exceptions: oil regions • Divergence of regional incomes, productivity, quality of life (Lugovoi et al, 2007) – mitigated partially through transfers – exceptions: neighbours of rich become a bit richer (Kholodilin et al, 2008)
Industrial Centres of Russia (46) http: //urbanica. spb. ru/? p=1321&lang=en
Top 5 Industrial Centres of Russia (47) City Moscow St. Petersburg Region Moscow St. Petersburg Populatio Production n, tsd. volume, billion (2010) Euro (2010) Sectorial and corporate structure of industrial assets (Russia’s leading companies) 11514 Mechanical engineering; Food, drink, tobacco industry; Oil and gas refinery; 46, 45 R&D; Pharmaceuticals 4849 Food, drink, tobacco industry; Mechanical engineering; Ferrous metallurgy; Construction 31, 44 materials; Chemical industry; R&D Surgut Khanty–Mansi Autonomous Okrug 307 Oil and gas extraction; Electric power generation; Oil and gas refinery; Food, drink, 19, 62 tobacco industry; R&D Nizhnevartovsk Khanty–Mansi Autonomous Okrug 252 11, 80 Oil and gas extraction; Oil and gas refinery Omsk Oblast 1154 Source: http: //urbanica. spb. ru/? p=1321&lang=en Oil and gas refinery; Chemical industry; Food, 8, 54 drink, tobacco industry; Mechanical engineering
Industrial clusters (48) Cluster definition from Michael Porter: “Geographic concentrations of interconnected companies, specialized suppliers, service providers, firms in related industries, and associated institutions that compete but also collaborate. ” Orientation around focal points allows for precise targeting of benefits. Allows for creation of public policy to offset weaknesses in macroeconomic growth: • Shrinking labor force • Natural resource shortages • Weakness in innovation-intensive areas (services sectors) • Competing in global markets Spurs multi-factor productivity – a key source of economic growth in most developed countries.
Industrial clusters in Russia (49) Though the cluster strategy has been taken up only recently, there are success stories in Russia. A huge cluster in St Petersburg for light manufacturing, alcohol, and car manufacturing. Kaluga – 200 km off Moscow - has been one of the pioneers, attracting car manufacturers to the region. Mordovia has become a centre of Russia`s light industry.
25 innovative industrial cluster in 2016 (50) In 2012: competition of pilot programs of development of innovative territorial clusters was announced. 94 applications – 25 have been chosen. Six prior industrial sectors: 1. Nuclear and radiation technologies; 2. Production flying and space crafts, shipbuilding; 3. Pharmaceutics, biotechnologies, medical industry; 4. New materials; 5. Chemistry and petro chemistry; 6. Information technologies and electronics.
25 clusters in Russia by 2016 on map (51)
Some additional information Might be interesting!
Electricity • In Russia regional power systems are integrated into Interregional Power Systems (IPS), with further interconnection of the latter ones (as a rule, by means of long-distance overhead lines). • Nowadays there are 6 self-balanced IPS operating in parallel which makes transfer of electricity over 6 time zones possible. • The seventh, IPS of the Far East, operates separately.
Interregional Power Systems
Electricity • Unified Energy System of Russia- RAO UES forms the backbone of the Russian electricity sector. • The companies belonging to this group generate approximately 70 % of all the electricity produced in Russia. • As the corporation uses a great amount of natural gas in its electricity production it is highly dependent on Gazprom’s deliveries. • RAO UES was divided in 2007 into regional electricity generating companies with an official goal to enhance competition in the field.
Electricity • As of 31 December 2006, the state owned 52. 68 % of shares in RAO UES. • 45% of issued shares are traded on the stock market of the Russian Federation. • In addition to RAO UES, state owned Rosatom (state nuclear energy corp. ) is a major player in electricity production, as it controls the nuclear power stations in Russia. • At the moment, nuclear energy generates around 22 % of Russia’s total electricity production.
Russian railways
Number Food, drink, tobacco industry, top 10 industrial centers City Region District 1 Moscow Central 2 St. Petersburg Northwest 3 Surgut Khanty-Mansy Autonomous okrug (Tyumen region) Ural 4 Omsk region (Western) Siberia 5 Perm region Volga 6 Ufa Bashkortostan Volga 7 Chelyabinsk region Ural 8 Volgograd region Southern 9 Lipetsk region Central 10 Togliatti Samara region Volga http: //urbanica. spb. ru/? p=1321&lang=en
Mechanical engineering, top 10 industrial centers Number City Region District 1 Moscow Central 2 St. Petersburg Central 3 Omsk region Siberia (Western) 4 Perm region Volga 5 Ufa Bashkortostan Volga 6 Chelyabinsk region Ural 7 Almetyevsk Tatarstan Volga 8 Volgograd region Southern 9 Lipetsk Central 10 Togliatti Samara region Volga http: //urbanica. spb. ru/? p=1321&lang=en