Labor market in Russia Svetlana Ledyaeva Aalto University

Labor market in Russia Svetlana Ledyaeva Aalto University School of Business

Learning outcomes of this lecture Particularities of Russian education system. Development of labor market during Russian economic transformation in recent decades. Current labor institutions in Russia.
 Part 1")
Russia`s education system (briefly) Part 1

Soviet education and its reform in transition High achievement in all measures of educational attainment. But! Laggard levels of labor productivity a peculiar legacy of post Soviet Russia. The reform of its higher education system: the increased level of private funding system. The development of a specific mixed system of access to higher education. Two track admission: tuition free vs. the full amount of tuition. Underdeveloped educational credit market. The corruption of college staff.

Educational system in Russia Overview of the education system in Russia: next slide
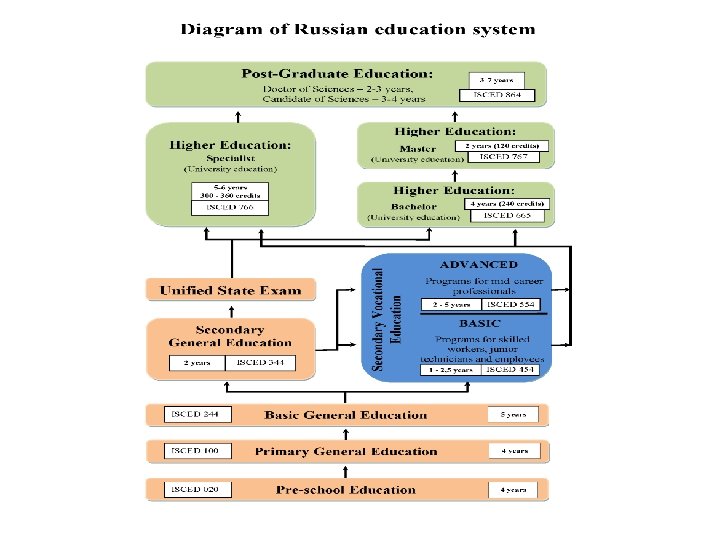
 Until 2009, universities held its")
University admissions process (from Denisova Schmidt and Leontyeva 2014) Until 2009, universities held its own entrance examination Corruption in this area was the highest of all kinds of corruption in education (about US$455 million per year). Solution: EGE (Edinyi Gosudarstvennyi Eksamen—Unified State Exam) tests that serve as both a school final examination and for university entrance. Corruption now: • disseminating exam questions before the examination; • using mobile phones (for Internet searches or SMS); • receiving help from the onsite proctors/inspectors; • reopening sealed test envelopes to correct mistakes.

Higher education in Russia Higher education is provided by public and non public (non State) accredited higher education institutions. Public (State) institutions – better level of education than in private institutions. Types of higher education establishments in Russia: University – all the levels of higher, post higher and further edu cation within a wide range of Natural Sciences, Humanities, Technology, and Culture. Academy/School – the same as university but for one to three specific related areas of science. Institute - vocational educational curricula in specific areas of science and is involved in scientific research. Can be part of University or Academy.

% of the economically active population with University and College degrees 35 30 25 20 University degree College degree 15 10 5 0 1992 1995 1998 1999 2000 2001 2002 2005 2006 2007 2008 2009 2010 2011 2012

Number of 17 years old young people, thousands of people, Russia

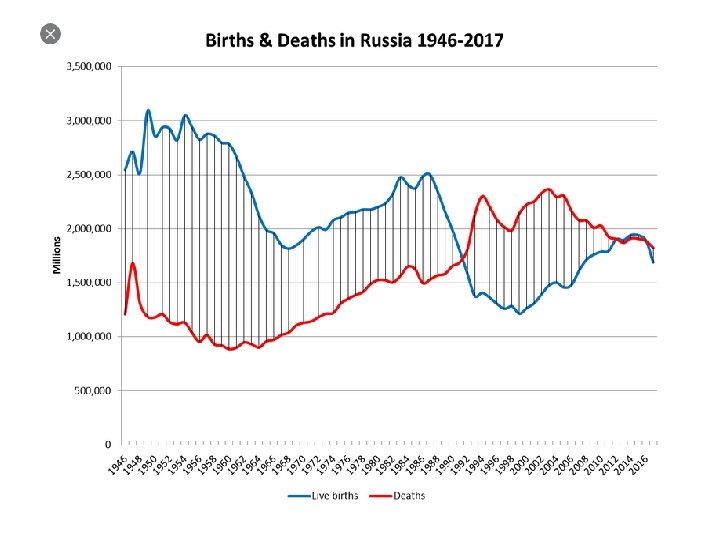
Recent trends in education Demographic trends have had a profound effect on Russian university system in recent decade: The number of school graduates and students dropped significantly (30 50%). Government reforms: Reduction of the number of higher education institutions. Financial state funding is redirected from Universities to professional colleges. Foreign students quotas have increased. Compared to countries like China or the United Arab Emirates, Russia is not a major host of foreign universities or branch campuses.

Russia`s labor market Part 2

Recent history of the Russian labor market Three stages: 1991 -1998 - transformational recession in Russia: a decline in employment, cuts in working hours, and sharp falls in real wages. 1999 -2008 - the dynamic post-recession recovery and a rapid improvement in labor market performance. The economic crisis of 2008 – present.

Employment and unemployment levels in Russia 1992 2018 80 70 67. 1 64. 3 60. 5 60 59 57. 7 54. 9 56. 8 63. 1 63. 2 62 61. 3 61. 7 60. 3 59. 8 59. 4 58. 5 58. 4 64. 9 64. 8 65. 3 65. 7 62. 7 63. 9 65. 6 53 50 40 30 20 10 5. 2 0 0. 8 5. 9 1. 2 8. 1 2. 3 9. 4 3. 2 9. 7 3. 6 11. 8 2. 9 13. 3 13 2. 9 1. 7 10. 6 1. 4 9 1. 6 7. 9 8. 2 7. 8 7. 1 2. 3 2. 6 2. 5 2. 3 6. 2 6 2. 1 2 8. 3 2. 9 7. 3 6. 5 5. 2 2. 1 1. 7 1. 4 1. 2 5. 6 5. 5 5. 2 4. 7 1992 1993 1994 1995 1996 1997 1998 1999 2000 2001 2002 2003 2004 2005 2006 2007 2008 2009 2010 2011 2012 2013 2014 2015 2016 2017 2018 Employment level, 15/72 old, total, % Unemployment level, 15/72 old, total, % Registered unemployment level, total, %

Employment level discussion The employment to population ratio has remained unexpectedly high. It decreased initially by 14. 1 pp from 67. 1% to 53% (1992 1998) but then – during the recovery period - reached 62. 7% (2010). The Russian employment level: a little above the OECD average and significantly above the average for other postsocialist countries.

Unemployment level discussion Unemployment did not shoot up in Russia even in the worst economic downturns. No mass layoffs were used. Total unemployment reached (for a short period) its peak value of 13. 3% in 1998. However, it has never approached peak values typical for some other transition economies (see next slide).
 (modeled ILO estimate)")
Unemployment in transition countries Unemployment, total (% of total labor force) (modeled ILO estimate) 30 25 20 15 10 5 0 1991 1992 1993 1994 1995 1996 1997 1998 1999 2000 2001 2002 2003 2004 2005 2006 2007 2008 2009 2010 2011 2012 2013 2014 2015 2016 2017 Armenia Azerbaijan Bulgaria Belarus Czech Republic Estonia Georgia Greece Hungary Kazakhstan Lithuania Latvia Moldova Poland Russian Federation Slovak Republic Slovenia Tajikistan Ukraine Uzbekistan

Explanations for employment stability Low inter-firm labor mobility and existing barriers, some of which were inherited from the Soviet past. Flexible working hours. Flexible wages.

Low inter-firm labor mobility An equilibrium outcome of the interaction between dependent workers and paternalistic employers: • Russian workers were deeply afraid of entering the external labor market mostly because they highly valued firm provided social benefits. • Therefore, on the supply side, they did their best to keep the jobs they occupied. • On the demand side, paternalistic employers preserved labor and rejected any downsizing.

Flexible working hours First 5 years of the transition: The annual duration of working hours in the Russian economy was shortened by 12% (15% in industrial sector). From the mid-90 s on: The duration of working time grew rapidly, increasing by 2008 by about 6% in the whole economy and about 16% in industrial sector. If hours had been stable, the change in employment would have been twice as large as that observed in the crisis and in the recovery, other things equal. By contrast, in the CEE countries the cyclical dynamics of hours were much more muted.

Reasons for hours to shrink so significantly: multiple The Russian authorities used legislative cuts of working hours as social and political cushions against mounting hardships. Cutting hours was one of the cheapest ways to adjust labor costs for firms. Short-time work and forced vacations. Fast recovery in working hours and the wide use of overtime work limited employment growth in the boom period.

Flexible wages Shorter hours brought labor costs down but not enough to accommodate the GDP fall Downward wage flexibility did the rest. During the 90 s: real wages ―just‖ halved. The restart of economic growth in 1999 launched a steep recuperation of real wages. Inflation remained rather high but nominal wages grew even higher. In 1999 2007 the real wage grew by 10 20% annually and cumulatively tripled over this period!

Wage adjustment The specific composition of the wage bill that is typical for the majority of Russian firms: Premiums and bonuses contingent upon general economic conditions and firm performance This fraction of wage compensation moves pro cyclically. In the crisis ridden year of 1998, the most flexible part of the wage made up on average 27%, while in much more prosperous 2007 it reached almost 36%. Paying late. Informal payments.

Composition of wage bill by major components, some sectors, 2005, % Industry Flexible tariff (Extra payments, premiums and bonuses) Fixed tariff Oil and gas 42 58 Metallurgy 48, 4 51, 6 Electricity, gas and water supply 52, 1 47, 9 Machine building 53, 7 46, 3 Transportation 59, 8 40, 2 Food industry 63, 7 36, 3 Construction 65, 2 34, 8 Healthcare 65, 3 34, 7 Retail and wholesale trade 74, 2 25, 8 Education 75, 7 24, 3

Paying late Wage arrears/debts grew explosively over the 90 s and were widely discussed in the research literature. They emerged in early 1992 and peaked in mid 1998. At that time, about two thirds of all wage and salary workers were paid late. During the path of economic growth wage arrears began to dissipate rapidly. By mid 2008, they made up under 2% of the monthly wage bill, while the proportion of workers affected was less than 1%.

Salary ”in the envelope” Russian salaries can be white, black and grey. “Black salary” is the salary from which no taxes were paid. For example, you work somewhere, but not officially, so you get “black salary. ” If they fire you, you won't be able to prove you worked there. “Salary in the envelope”, usually meaning black salary. You receive your salary in cash in an envelope. “Grey salary”, when part of your salary is legal, white, and the other is not (i. e. black, in envelope).

Salary ”in the envelope” These ‘envelope wages’ are not used for making overtime payments wages’ but, rather, for paying employees a portion of their core wage on an informal basis. The proportion of total wage received in such a manner can range from 20 to 80 per cent (in the study for Moscow, Williams&Round 2007). Williams&Round 2007: 2007 This is not some minor practice existing in a limited range of occupations or sectors involving small amounts but rather, is a widespread and intrinsic feature of waged employment.

Salary ”in the envelope” In most organizations and enterprises, job applicants in Moscow will hear at the interview, ‘your formal salary is. . . (a figure usually from 2 000– 10 000 rubles—Euro 40/30– 200/150—a month). . . but your real wage will be higher’. IT IS BENEFICIAL for these organizations: Various social payments (e. g. maternity leave) decrease significantly; higher dependence of the worker. BUT NOT beneficial for employees: It reduces not only their pension and unemployment entitlements, but also their ability to gain access to credit.

Real wages, % to previous year Real wage, % to previous year 140 120. 9 119. 9 120 116. 2 112. 6 113. 3 110. 9 106. 4 104. 7 100. 6 92. 1 108. 4 102. 8 104. 8 106. 5 101. 2 97. 5 96. 5 90. 1 86. 7 80 111. 5 105. 2 100. 4 96. 6 118. 9 117. 2 78 72 67. 3 60 40 20 0 1991 1992 1993 1994 1995 1996 1997 1998 1999 2000 2001 2002 2003 2004 2005 2006 2007 2008 2009 2010 2011 2012 2013 2014 2015 2016 2017 2018

Annual changes in output, employment, working hours and real wages, 2009 to 2008, percentage points Output Working Real Employment hours wages Total economy -7. 9 -1. 7 -2. 4 -3. 5 Industry -10. 0 -5. 9 -4. 8 -5. 7 Manufacturing -15. 8 -7. 2 -6. 2 -7. 2

Preliminary conclusions The Russian model‖ is more alive than dead though in a slightly modified form. The Russian labor market demonstrated its ability to accommodate major negative shocks without large losses in employment and drastic increases in unemployment. However! This does not mean that this persistent adjustment mode is close to the optimal, given all welfare and productivity related considerations.

Labor institutions in Russia Do the Russian labor market institutions trade off employment against wages? If yes, then how? The choice of a particular wage employment trade off is a political economy problem and reflects particular social and political preferences. In Russia, this institutional choice seemed to be made early in the transition and was path dependent in relation to the late Soviet period.
: largely the Code of Laws")
Employment regulations In Russia, the EPL (employment protection legislation): largely the Code of Laws on Labor (KZOT). Existing indices tend to confirm that the Russian EPL, as written in the law, should be considered very stringent/strict. By some estimates Russia is first on the list of the countries with the most rigid EPL: job protection for permanent workers gets a score of 2. 8 against 2. 1 for OECD average. The rigidity/fixity of employment in Russia 44 vs. 30. 8 for OECD average (Doing Business 2007).

Normative Firing Costs in Russia and some OECD countries, number of months and monthly wages The scope for employment flexibility is largely determined by firing costs introduced by the EPL. Severance pay: 2 3 months* (+3 months for the Northern and Far Eastern Regions). *firing costs are constant over the tenure. For Sweden, Finland, Germany, USA – 0 months!

Minimum wage The minimum wage sets a wage floor and can, therefore, constrain downward wage flexibility. In Russia, during most of the transition period, the minimum wage was fixed at a low level and was hardly binding for the majority of firms in the economy. Indexation was irregular, lagged far behind inflation, and had a short run effect on relative earnings.

Minimum wage per month, USD 200 180 172. 1 163 160 147 140 149 143 142 143 144 133. 721926967255 120 100 97 93 102. 268656716418 80 60 42 40 20 20 22 26 14 0 1995 5 2000 7 2005 2010 2015 2020

Minimum to Average Wage Ratio, % Minimum to Average wage ratio, % 30. 0 25. 0 23. 2 20. 7 20. 0 16. 9 19. 7 17. 3 17. 5 17. 1 17. 6 18. 7 15. 0 10. 3 10. 0 10. 9 10. 3 8. 9 5. 0 5. 9 8. 9 6. 2 0. 0 2001 2002 2003 2004 2005 2006 2007 2008 2009 2010 2011 2012 2013 2014 2015 2016

Average wage in Russia, USD 1000 900 885 915 827 800 725 700 690 672 687 600 590 554 615 605 550 500 404 400 300 243 200 185 100 56 0 79 107 137 1999 2000 2001 2002 2003 2004 2005 2006 2007 2008 2009 2010 2011 2012 2013 2014 2015 2016 2017 2018

Average monthly wage across Russian regions, 2015, USD Region, highest wage Wage, USD Region, lowest wage Wage, USD Chukotka 1168, 37 Pskov region 316, 63 Yamalo nenetskij okrug 1135, 18 Ingush Republic 315, 57 Nenetskij okrug 1046, 42 Chuvash republic 313, 93 Magadan region 969, 53 North Osetia 312, 43 Moscow 944, 76 Ivanovo region 310, 87 Sakhalin region 900, 71 Republik Kabardino Balkaria 306, 54 Hanty Mansijskij okrug 882, 44 Republic Karachaevo Cherkessiya 301, 32 Kamchatka 843, 31 Kalmykia 295, 42 Tyumen region 831, 73 Altay region 295, 14 Yakutia 802, 57 Dagestan 282, 64
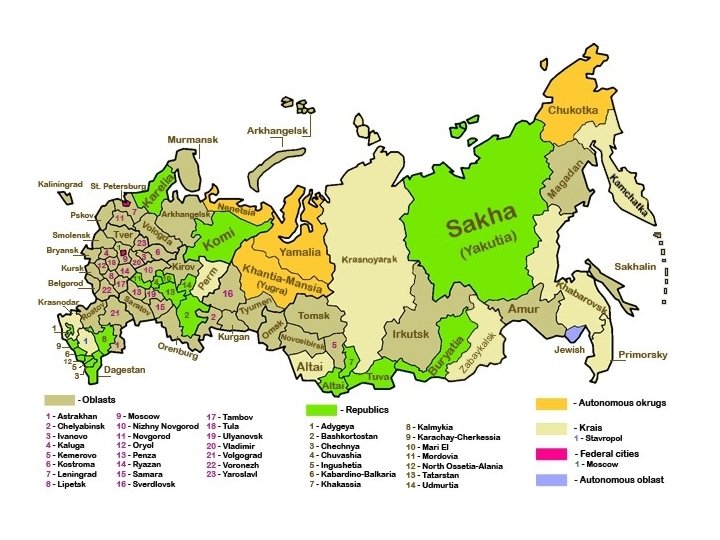

Average monthly wage across Russian regions, 2015, USD

Re nd il a ta le ho w le sa er la cia an Fin or te ce an ac s g tiv iti e in 1400. 0 ac 1045. 2 in n s 1200. 0 M tio ica tiv iti e ity ur m st ea ec ls un m ca l cia m co ur in s d so ni ch e; t e ag or st l ta en m in d an nd ta y, ga s nc an nd n d an fe de io at rm fo ifi c nt d an cit tri ec el sp rta To es tri us in d vic es er n io 692. 9 701. 3 In cie l, s e nc na na sio es of of te en in g ls ct 639. 4 644. 4 go v an Tr rt, ss cia so s le 800. 0 Pr e at id in g ov Pr d tru ns io n oc yc ot uc at es te as w s ry g ice rv tiv iti ac Ed m Co d an ce an po , s re re Pr o ca rt po ns te ta es of se he fis 558. 5 524. 8 547. 3 492. 0 499. 6 Cu lth tra al n tio la te d g, rin te 449. 5 He a ed Re re in a im el d an tin ca 415. 5 el n, ut io n tio un bl ic pu try , h d an 600. 0 608. 0 St he rib di st fw d es or , f ls te ho ra in ist re of ul tu m Ad an ro ai ep ; r de in g id ov pr tra er W at ric Ag tiv iti es Ac Average monthly wage by industry, USD, 2018 1600. 0 1462. 7 1327. 9 1080. 5 1000. 0 757. 5 759. 3 762. 7 400. 0 200. 0

Unemployment benefits Russia entered the transition having no open unemployment and consequently no social protection targeted at the unemployed. The safety net to cushion emerging social costs had to be created from scratch and without delay. Its designers were caught between expectations of high unemployment and fears of being too generous.

Unemployment benefits Throughout the 90 s, the share of annual GDP budgeted for labor market policies remained remarkably low. It constituted less than one half of percent, while expenditures of this sort in Hungary or Poland reached 1. 3 and 2. 25 percent, respectively (UN Commission for Europe, 2003). In the 2000 s, this share became almost negligible. Total spending on passive and active labor market policies remained less than 0. 1% and it only approached 0. 2% in the crisis 2009 due to additional spending.

Unemployment benefits in Russia, USD 180. 0 161. 7 167. 1 158. 1 154. 9 160. 0 154. 0 140. 0 127. 3 125. 7 120. 0 112. 6 101. 8 106. 0 100. 0 84. 1 80. 2 80. 0 73. 2 60. 0 40. 0 25. 5 26. 5 28. 2 31. 4 26. 9 28. 0 29. 0 27. 4 26. 7 22. 1 13. 9 20. 0 2005 2006 2007 2008 2009 2010 Minimum size of unemployment benefits, USD 2011 2012 2013 2014 Maximum size of unemployment benefits, USD 2015 12. 7 2016 14. 6 2017

Ratio “monthly UB/monthly average wage”, % 25. 0 21. 1 20. 0 17. 0 15. 4 15. 0 13. 8 13. 2 12. 3 11. 3 10. 6 10. 0 9. 6 8. 8 8. 5 7. 8 5. 0 0. 0 2003 2005 2007 2009 2011 2013 2015 2017

Unemployment benefits at present There are more job places in the economy than unemployed people – should be able to find a job quickly. First year: 3 month – 75% from previous salary; 4 month – 60%; 5 month – 45%. From the second year – minimum unemployment benefits – 850 rubles (12 Euro); changes almost every year.

Trade Unions TU density was close to 100% at the start of the transition. Federation of Independent Trade Unions in Russia (was established in 1990). Federation of Independent Trade Unions in Russia • Includes 122 industrial trade unions across the country (20 million members). • Can include both employees and employers which contradicts international experience. Rival organization – Confederation of Labor of Russia (1995). Confederation of Labor of Russia • much smaller but more dynamic. • includes about 20 national and interregional trade unions (2 million employees).

Trade unions and wage agreements A very rigid corporatist arrangement inherited from the Soviet past. The wage setting in Russia seems to be highly centralized and coordinated. It has a multi layer bargaining/negotiating structure: Based on tripartite agreements – between government, trade unions and employers. Tripartite agreements can be at national, regional and industry levels. Main tripartite agreement – on national level – between Federal government of Russia, representatives of Russian trade unions and Russian employers.

Trade unions and wage agreements Within this framework, firms would seem to be completely constrained in their wage policy; almost no room is left for either upward or downward decentralized wage adjustments. However! This conclusion would be completely misleading since it ignores important nuances concerning the functioning of the system. Over one third of the total wage is not contracted at all and remains contingent upon performance. TU initiatives (at any level) are easily blocked by the government and are accepted only if the government agrees. The whole corporatist structure largely decorative and shallow.

Doing business 2017: Labor Market Regulation data

Doing business 2017: Labor Market Regulation data Russia, SPB Russia, Moscow Germany Estonia Finland
- Slides: 53