Lecture 6 Gravity model Giorgia Giovannetti Outline Summary


 - distinct from absolute advantage")


 in pills • Trade can result from increasing")


")


")
: The attractive force (Fij) between")
 • Fij")


 • Indirect (government policy;")
 • In fact, the size of an")


, What separates us? Sources of")

 = C")

 •")


")


 – published annually by the WEF.")


 Canada Rank Overall GCI")
 Canada Rank Overall GCI")
 Canada Rank Overall GCI")


")


- Slides: 87
Lecture 6 Gravity model Giorgia Giovannetti
Outline • Summary of last lecture • The gravity model • Challenges of heterogenous firms (empirics)
Summary: Ricardian Model in pills Comparative Advantage (technology based) - distinct from absolute advantage (Smith) - all countries can compete/trade (if wages low enough) - all can gain from trade - smaller countries tend to “gain more” But - complete specialisation - no internal income distribution
The H-O model in pills, 1 • The Heckscher-Ohlin model, in which two goods are produced using two factors of production, emphasizes the role of resources in trade. • A rise in the relative price of the labor-intensive good will shift the distribution of income in favor of labor: • The real wage of labor will rise in terms of both goods, while the real income of landowners will fall in terms of both goods. • For any given commodity prices, an increase in a factor of production increases the supply of the good that uses this factor intensively and reduces the supply of the other good. • The Heckscher-Ohlin theorem predicts the following pattern of trade: • A country will export that commodity which uses intensively its abundant factor and import that commodity which uses intensively its scarce factor.
The H-O model in pills, 1 • The owners of a country’s abundant factors gain from trade, but the owners of scarce factors lose. • In reality, complete factor price equalization is not observed because of wide differences in resources, barriers to trade, and international differences in technology. • Empirical evidence is against the Heckscher-Ohlin model (Leontief paradox). • Most researchers do not believe that differences in resources alone can explain the pattern of world trade or world factor prices.
The Leontief Paradox • In 1954 and 1956 Leontieff run two tests of Heckscher-Ohlin. Samuelson theory. • In the first test (1954) he uses American data from the 1947 inputoutput tables with 200 industries aggregated in 50 sectors. • He computes direct and indirect requirements of labour and capital for the production of 1 million dollars worth of US export and for the production of 1 million dollars worth of competivive imports (import replacement). • Then he computes the capital/labour ratio of US import and export in order to test the H-O-S theory under the hypothesis that the USA is a “Capital Abundant” country
The Leontief Paradox • Expected results: Assuming that the USA have a relative abundance of capital, the USA should export capital intensive goods and should import labour intensive goods • Results: just the opposite! The USA exports labour intensive goods! • Explanations: American workers are more efficient so that American labour is more valuable (example: 1 hour of American work is worth 2 hours of foreign work) As a consequence, the USA is actually better endowed with labour than other countries; but Leontieff does not explain why American work should be more efficient • In 1956 Leontieff repeats his test using the same 1947 input-output tables but taking in account 192 industries and the 1951 US trade composition The “paradox” shows up again even if it is attenuated • US export appears to be still labour intensive
Summary: Monopolistic Competition (New Trade Theory) in pills • Trade can result from increasing returns or economies of scale, that is, from a tendency of unit costs to be lower at larger levels of output. • Economies of scale can be internal or external. • The presence of scale economies leads to a breakdown of perfect competition. • Trade in the presence of economies of scale must be analyzed using models of imperfect competition. Krugman (1979, 1980); Helpman and Krugman (1985) in HO trade models Uses “love of variety” preferences – e. g. Dixit-Stiglitz Goods are differentiated by firm, while increasing returns at the firm level limit product variety
Summary: New Trade Theory in pills • In monopolistic competition, an industry contains a number of firms producing differentiated products. • Intraindustry trade benefits consumers through greater product variety and lower prices. • In general, trade may be divided into two kinds: • Two-way trade in differentiated products within an industry (intraindustry trade). • Trade in which the products of one industry are exchanged for products of another (interindustry trade). • External economies give an important role to history and accident in determining the pattern of international trade. • When external economies are important, countries can conceivably lose from trade.
Gravity in pills • Distance matters for trade • Consistent with both new trade theory and old trade theory • Theory has helped refine the gravity relationship • Gravity can be used to test other hypotheses even if we don’t know what drives gravity
90% of world trade is by sea; Shipping Routes
Suez Channel, 1869, huge cut in costs, recently the channel has been doubled (2015)
Panama Channel, 1914
If channels/infrastructures trigger trade by sea, Pirates discourge it…
Seaports are a physical manifestation of the global trade of goods
Shanghai
Cost of trade decreased
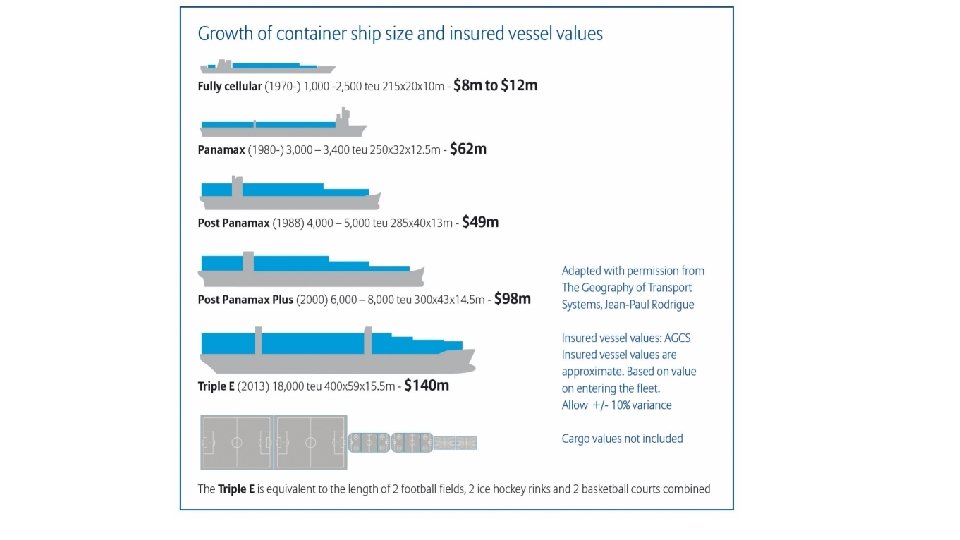
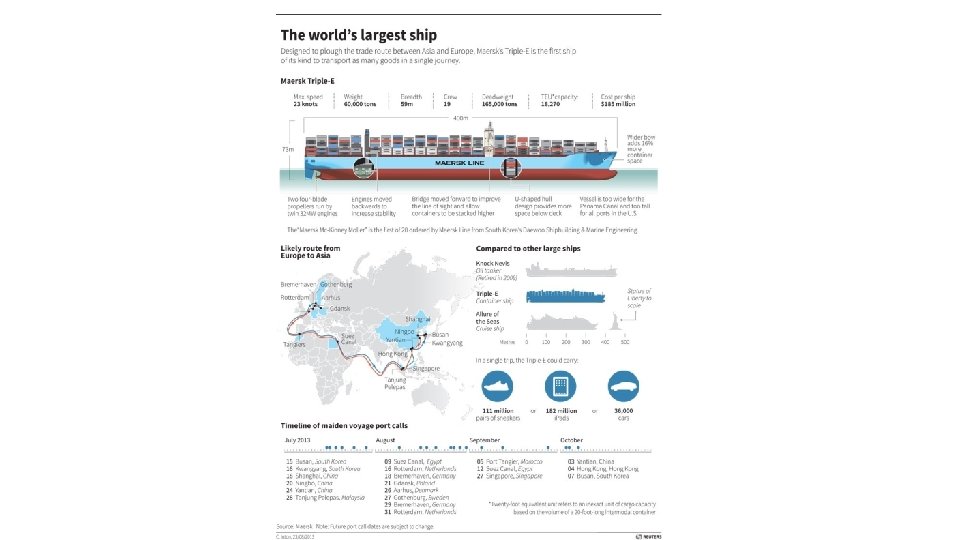
Increase role for containers "One of the most significant, yet least noticed, economic developments of the last few decades… Containerization slashed the cost of transporting goods around the world and made the boom in global trade possible”
Containers, increase in less than 50 years
Who trades with whom? The gravity model
The gravity model
The gravity model • Newton’s Law: Any two bodies in the universe attract each other with a force that is directly proportional to the product of their masses and inversely proportional to the square of the distance between them.
The gravity model • The gravity model also explains international trade! • Size (GDP) and distance determine bilateral trade across countries • Distance matters for trade • As mentioned above, this model is consistent with both new trade theory and old trade theory • Theory has helped refine the gravity relationship • Gravity can be used to test other hypotheses even if we don’t know what drives gravity
From Newton… • Newton’s “Law of Universal Gravitation” (1687): The attractive force (Fij) between i and j • Mi, Mj are the masses • D is distance between two objects • G is gravitational constant Mi F D Mj
To today’s Economists…. • Model many social interactions (migration, tourism, trade, FDI) • Fij is the flow from i to j • M’s are measure of economic mass • D is the distance
Estimation of the Gravity Equation • Take logs:
The Role of economic mass • Usually measured using GDP • Most theoretical explanations predict coefficient equal to one • Estimates often not significantly different from 1, but range is from 0. 7 to 1. 1
The role of distance • Distance usually measured using great circle distance based on latitude and longitude • Head (2000) averages results from 62 regressions in eight papers, for sample years ranging from 1928 to 1995 • Average distance effect is 1. 01 • Doubling distance halves trade
Distance and trade costs • Trade costs: • Direct (transport) • Indirect (government policy; language) • Is distance just capturing the effect of trade costs (acting as a proxy) or does it play an additional role?
Size Matters: The Gravity Model (cont. ) • In fact, the size of an economy is directly related to the volume of imports and exports. • Larger economies produce more goods and services, so they have more to sell in the export market. • Larger economies generate more income from the goods and services sold, so people are able to buy more imports. 2 -32
“The gravity model” • Gravity Law: Holding constant the product of two countries’ sizes, their bilateral trade will, on average, be inversely proportional to the distance between them.
The gravity model
The gravity model
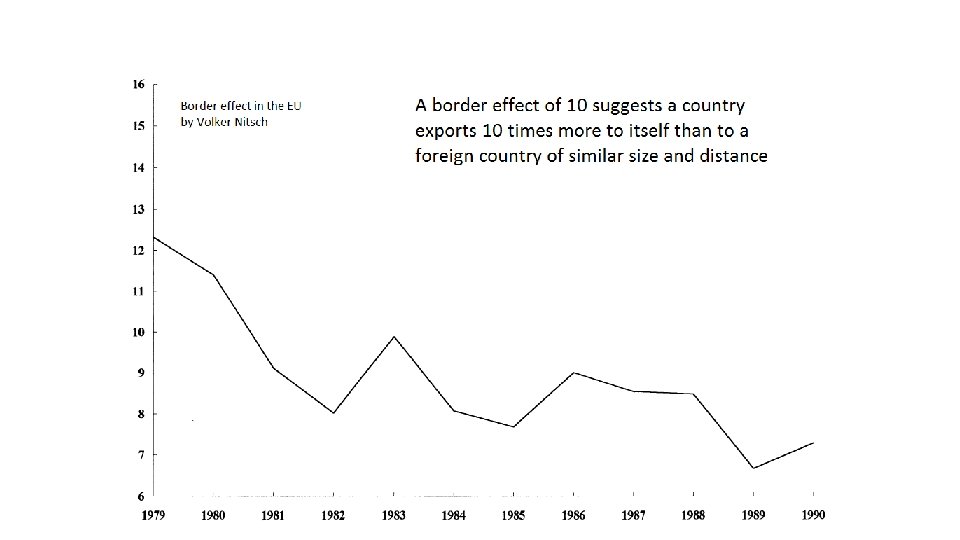
The gravity model • Has globalization brought the death of distance?
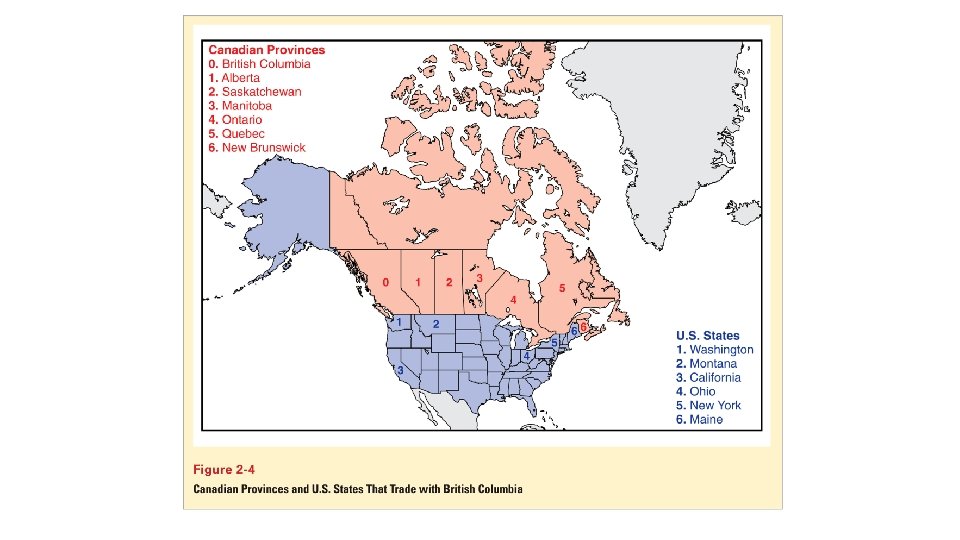
The border effect • Trade between countries is harder than trade between regions within a country • Economists have coined how harder it is “the border effect”, as it involves crossing an international border • The border effect is the empirical regularity that trade is much higher within countries than across country borders
The border effect • Example: • Do US States and Canadian provinces trade as much between them when goods have to cross the border? • We can answer this question by looking at how much Canadian provinces and US States at similar distances trade with British Columbia
The border effect Crossing the border reduces trade by 80%
The border effect • Why do borders reduce trade? • • • Tariffs Administrative barriers (docs) Currency exchange Cultural barriers …? • The border effect can also be thought of as a home bias, i. e. a preference for home goods over foreign ones
Extra readings • Head, K. and Mayer, T. (2013), What separates us? Sources of resistance to globalization. Canadian Journal of Economics, 46: 1196– 1231.
More on gravity models • Countries distance from the Rest of the World also matters for their bilateral trade Rest of the World Country A Country B
Estimated gravity equation. . . • Normal trade with Resistances ln (Tradeij) = C + a ln(GDPi) + b ln(GDPj) + +c ln(distanceij) + d ln(Remoteness)i + + e ln(Remoteness)j+ uij In applied exercises the Remoteness term is calculated as: Sumk distancekj/GDPk
Estimated gravity equation. . . Normal Trade • Normal trade normalizing for a third country ln (Tradeij /Tradekj) = C+ a ln(GDPi/GDPk) + c ln(distanceij/distancekj) + uij
“Augmenting” the gravity equations • Income per capita (higher income countries trade more) • Adjacency • Common language, colonial links • Institutions, infrastructures, labour flows, . . . • Surprisingly, bilateral tariff barriers often missing!!!
“Augmenting” gravity model • Traditional approach to evaluate the impact of RTAs: Trade creation and trade diversion ln (Tradeij) = a ln(GDPi) + b ln(GDPj) + +c ln(distanceij, , adjacency, language. . ) + d (Dummy i) + + e (Dummy j) + g (intra-RTAij)+ h (extra-RTAij) + uij • IMPORTANT the gravity model does not estimate welfare effects
“Augmenting” gravity model • . . . the problem of endogeneity of FTA (Baier and Bergstrand, 2005) dln Trade. Shareij, t-(t-1) = b d. RTAij, t-(t-1) + d Dummy i, t-(t-1) + e Dummy j, t(t-1) + uij n*t Country-and-time fixed effects
Weak points of the Gravity Model • does not determine endogenously which country produces which goods, • does not tell us how trade will affect factor incomes, • requires various ad hoc adjustments for fitting to data. • For empirical estimation, the concept of “distance” must be interpreted not just in the physical sense but in an economic sense. • Distance within a country matters much less than distance across borders, having a common border or not makes a difference, preferential trade agreements and common currencies matter, etc.
The concept of a country’s competitiveness is often associated with its trade performance…. • Aggregate indicators – e. g. Unit labour costs (ULC), the exchange rate - are used as proxy for competitiveness. But it is important to go beyond costs factor and aggregate indicators: also non price factors matter (tastes/quality). Also we can focus on trade competitiveness • Export market shares aims at capturing structural gain or losses in competitiveness. At macro level, indicators in this category track the export performance of a country/sector. • Importance of firm level and cross border perspective • Micro-founded indicators are based on intensive (how much) and extensive (how many) margins of trade • Productivity is the cornerstone dimension of firm heterogeneity – productivity threshold by international status (exporters are more productive etc) vs specificities of firms below/above thresholds
Competitiveness is a multifacet concept Some Indicators used to measure trade competitiveness • 5 year change in export market shares; problem: market shares are unrelated to competitiveness in a world chracterized by GVCs • Relative trade balance; problem: a negative trade balance is not necessarily a bad sign • Revealed comparative advantage • Current account as % of GDP; problem: endogeneity; also, includes non trade related components • Other (measurable) aspects are: price and costs competitiveness (real effective exchange rate; unit labour costs; price cost margins; ) Innovation and technology (non price competitiveness); firm dynamics; Global value chains
Demand also matters. . Different opportunities in different areas, 2016 -2017 (estimates, prometeia)
It would be important for SMEs to know who are the competitors • Data for this are difficult to find • In Italy model ICE-Prometeia does this (and could be possibly used).
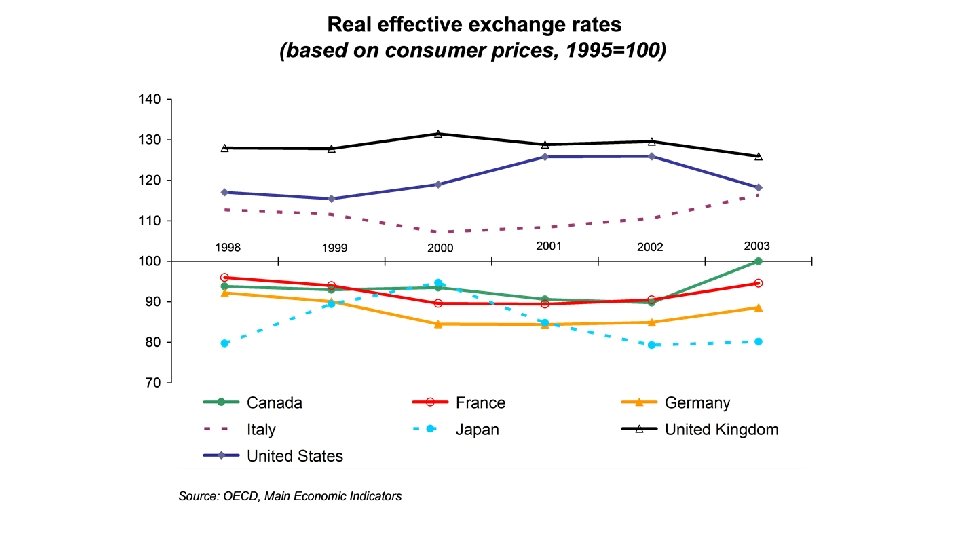
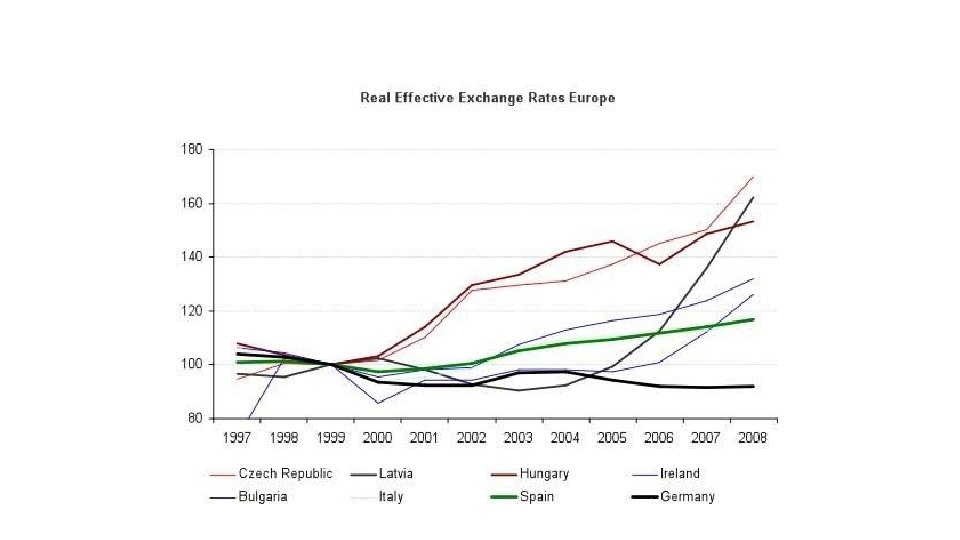
Competitiveness indicators • The real effective exchange rate q = E P / P* where: E = nominal effective exchange rate (foreign currency per unit of domestic currency) P = index of domestic prices P* = index of foreign prices
Competitiveness: changes in RER An increase is a loss of competitivenness
Globalization index The KOF Index of Globalization measures the three main dimensions of globalization: economic; social; and political. 1970 2008 http: //globalization. kof. ethz. ch/
Some Global Ranking: • Global Competitiveness Index (GCI) – published annually by the WEF. It captures the microeconomic and macroeconomic foundations of national competitiveness, including structural factors. The GCI considers 12 main determinants of competitiveness called “pillars”: institutions, infrastructure, macroeconomic stability, health and primary education, higher education and training, goods market efficiency, labor market efficiency, financial market sophistication, technological readiness, market size, business sophistication, and innovation. • The World Competitiveness Index (WCI) – published by the IMD, uses 329 criteria for evaluating enhancing factors for doing business and social welfare. It elaborates a country profile measuring macroeconomic performance, governmental and private sector efficiency and infrastructure levels for 57 countries. • The Doing Business Index – published annually by the World Bank, investigates the business environment in countries, considering regulations that enhance business activity and those that constrain it. Indicators: starting a business, dealing with construction permits, employing workers, registering property, getting credit, protecting investors, paying taxes, trading across borders, enforcing contracts, and closing a business etc
The Global Competitiveness Report • World Economic Forum http: //www. weforum. org • Global competitiveness Index http: //www 3. weforum. org/docs/WEF_Global. Competitiveness. Report_2012 -13. pdf
The Global Competitiveness Index The Framework Key for factor-driven economies Key for efficiency-driven economies A. Basic Requirements B. Efficiency Enhancers Key for innovation-driven economies C. Innovation & Sophistication Factors 1. Institutions 5. Higher education and training 11. Business sophistication 2. Infrastructure 6. Goods market efficiency 12. Innovation 3. Macroeconomic environment 7. Labor market efficiency 4. Health and primary education 8. Financial market development 9. Technological readiness 10. Market Size
The Global Competitiveness Index 2010 Top 20 and selected economies ranking Rank (Out of 139) 1 2 3 4 5 6 7 8 9 10 11 12 13 14 15 16 17 18 19 20 Economy Switzerland Sweden Singapore United States Germany Japan Finland Netherlands Denmark Canada Hong Kong SAR United Kingdom Taiwan, China Norway France Australia Qatar Austria Belgium Luxembourg Score 5. 6 5. 5 5. 4 5. 3 5. 2 5. 1 5. 0 Rank (Out of 139) 26 27 29 30 31 34 36 44 48 49 50 51 54 58 60 61 63 66 113 134 Economy Malaysia China Ireland Chile Iceland Oman Czech Republic Indonesia Italy Montenegro Malta India South Africa Brazil Slovak Republic Turkey Russian Federation Mexico Tanzania Burkina Faso Score 4. 9 4. 8 4. 7 4. 6 4. 4 4. 3 4. 2 3. 6 3. 2
The Global Competitiveness Index Canada comparison with France
The Global Competitiveness Index Canada comparison with United Kingdom
The Global Competitiveness Index Canada comparison with developed countries: United States
Global Competitiveness Index 2010 -2011 Canada's areas of strength (details) Canada Rank Overall GCI 2010 -2011 10 Goods market efficiency components Rank Intensity of local competition 20 Extent of market dominance 13 Effectiveness of anti-monopoly policy 14 Extent and effect of taxation 48 Total tax rate Number of procedures required to start a business 79 Time required to start a business 9 Agricultural policy costs 28 Prevalence of trade barriers 45 Trade tariffs 38 Institutions 11 Infrastructure 9 Macroeconomic environment 36 Health and primary education 6 Higher education and training 8 Goods market efficiency 11 Labor market efficiency 6 Prevalence of foreign ownership 11 Financial market development 12 Business impact of rules on FDI 48 Technological readiness 16 Burden of customs procedures 27 Market size 14 Imports as a percentage of GDP 94 Degree of customer orientation 13 Business sophistication 16 Buyer sophistication 6 Innovation 11 1
Global Competitiveness Index 2010 -2011 Canada's areas of strength (details) Canada Rank Overall GCI 2010 -2011 10 Institutions 11 Infrastructure 9 Macroeconomic environment 36 Health and primary education Financial market development components Rank Availability of financial services 2 Affordability of financial services 14 Financing through local equity market 8 6 Ease of access to loans 24 Higher education and training 8 Venture capital availability 19 Goods market efficiency 11 Labor market efficiency 6 Restriction on capital flows 39 Financial market development 12 Soundness of banks 1 Technological readiness 16 Regulation of securities exchanges 22 Market size 14 Legal rights index 60 Business sophistication 16 Innovation 11
Global Competitiveness Index 2010 -2011 Canada's areas for improvement (details) Canada Rank Overall GCI 2010 -2011 10 Institutions 11 Infrastructure 9 Macroeconomic environment 36 Health and primary education 6 Higher education and training 8 Goods market efficiency 11 Labor market efficiency Innovation components Rank Capacity for innovation 19 Quality of scientific research institutions 8 Company spending on R&D 20 6 University-industry collaboration in R&D 7 Financial market development 12 Technological readiness 16 Government procurement of advanced technology products 26 Market size 14 Availability of scientists and engineers 6 Business sophistication 16 Utility patents per million population 10 Innovation 11
Global Competitiveness Index 2010 -2011 Most problematic factors for doing business in Canada
The most problematic factors for doing business Note: Respondents were asked to select the five most problematic for doing business in their country and to rank them between 1 (most problematic) and 5. The bars in the figure show the responses weighted according to their rankings. Source: The Global Competitiveness Report 2012 -2013
United States Source: The Global Competitiveness Report 2012 -2013
Source: The Global Competitiveness Report 2012 -2013
Source: The Global Competitiveness Report 2012 -2013
Source: The Global Competitiveness Report 2012 -2013
Source: The Global Competitiveness Report 2012 -2013
Selected Definitions of competitiveness Firm level: • „A firm is competitive if it can produce products [. . . ] of superior quality or lower costs than its domestic and international competitors. (US-President`s Commission on Industrial Competitiveness 1985, S. 6) Sectoral level: • . . . Position of a sector in relation to other sectors or to the same sector in other countries in terms of market share and productivity. National level: • “Competitiveness [. . . ] is understood to mean a sustained rise in the standards of living of a nation and as low a level of involuntary unemployment possible. ” (European Competitiveness Report 2004)
The concept of a country’s competitiveness is often associated with its trade performance…. • Aggregate indicators – e. g. Unit labour costs (ULC), the exchange rate - are used as proxy for competitiveness. But it is important to go beyond costs factor and aggregate indicators: also non price factors matter (tastes/quality). Also we can focus on trade competitiveness • Export market shares aims at capturing structural gain or losses in competitiveness. At macro level, indicators in this category track the export performance of a country/sector. • Importance of firm level and cross border perspective • Micro-founded indicators are based on intensive (how much) and extensive (how many) margins of trade • Productivity is the cornerstone dimension of firm heterogeneity – productivity threshold by international status (exporters are more productive etc) vs specificities of firms below/above thresholds
Competitiveness is a multifacet concept Some Indicators used to measure trade competitiveness • 5 year change in export market shares; problem: market shares are unrelated to competitiveness in a world chracterized by GVCs • Relative trade balance; problem: a negative trade balance is not necessarily a bad sign • Revealed comparative advantage • Current account as % of GDP; problem: endogeneity; also, includes non trade related components • Other (measurable) aspects are: price and costs competitiveness (real effective exchange rate; unit labour costs; price cost margins; ) Innovation and technology (non price competitiveness); firm dynamics; Global value chains
Demand also matters. . Different opportunities in different areas, 2016 -2017 (estimates, prometeia)
It would be important for SMEs to know who are the competitors • Data for this are difficult to find • In Italy model ICE-Prometeia does this (and could be possibly used).
Competitiveness indicators • The real effective exchange rate q = E P / P* where: E = nominal effective exchange rate (foreign currency per unit of domestic currency) P = index of domestic prices P* = index of foreign prices
Competitiveness: changes in RER An increase is a loss of competitivenness
Source: The Global Competitiveness Report 2012 -2013
Source: The Global Competitiveness Report 2012 -2013