Lecture 7 International trade The models Giorgia Giovannetti


 are based on monopolistic competition, but")


 problem with measuring productivity is")

 reviews 54 firm-level studies for 34 countries between 1995 and 2006")
 survey ►The number of export markets increases with")


")


 29")

")
 Enrico Marvasi 32")


 Data from French manufacturing firms trading internationally, by domestic")


 follows Hopenhayn (1992). • Individual firms each have a")
 Model Extension of the “Krugman model” Firms use labor")


 • Price index of all varieties is defined as: – Where is")
")


 • Exit and Entry of Firms – Productivity is fixed")
 • If free entry condition holds, the expected value of")
 Re-allocates market shares")


 No Trade - fi .")
 Trade pi pi( ) No Trade")

 model is successful in accounting for")


- Slides: 62
Lecture 7 International trade, The models Giorgia Giovannetti
Outline • Summary of last lecture: – Finished the gravity – Described some stylized facts of international trade • The new theory: the Melitz model, an introduction
International Trade, September 16 th- December 8 th 1 16/9 Introduction: The main issues 2 19/9 Introduction, 2 detailed presentation of the course 3 23/9 4 26/9 Introduction, 3; Measuring globalization Measuring Globalization, (VA) and overview of models 5 30/9 6 7 3/10 7/10 8 10/10 9 10 11 14/10 17/10 21/10 12 24/10 Trade and imperfect competition, 2 13 28/10 14 31/10 Recap Mid term (indicators, gravity, Ricardo, H-O, imp. Comp) 15 4/11 16 17 18 19 7/11 11/11 14/11 18/11 20 21/11 25/11 Trade policy- trade wars 22 28/11 China and India (BRICS) 23 2/12 Granularity and aggregate shocks Overview trade models (Bernard et al 2007; 2011) Gravity model Gravity, Melitz intro and intro Ricardo and comparative advantage, 2 Trade models: H-O, 2, Leontieff Trade and Imperfect competition, 1 Hysteresis, Heterogeneous firms The Melitz model Networks of trade. FDI/migrants FDI and Multinationals: OLI theory FDI and Multinationals Offshoring/trade in tasks Plan of the course/l ectures
summary, 1 Stylized facts - Exporters are bigger than non-exporters: they ship on average 5. 6 times more than non exporters (4. 8 times more domestically). - Plants are heterogeneous when we measure productivity; - —Exporters’ productivity distribution is a shift to the right of the non exporter’s distribution. Exporters have, on average, a 33% advantage in labor productivity relative to non exporters. —This suggests that the most productive firms selfselect into export markets, but it could also reflect learning by exporting (Clerides et al. , 1998)
Summary, 2 Furthermore, micro-level studies have also found evidence of substantial reallocation effects within an industry following trade liberalization episodes. —Exposure to trade forces the least productive firms to exit or shut-down (Bernard and Jensen, 1999; Aw, Chung and Roberts, 2000; Clerides et al. , 1998). —Trade liberalization leads to market share reallocations towards more productive firms, thereby increasing aggregate productivity (Pavcnik, 2002, Bernard, Jensen and Schott 2003).
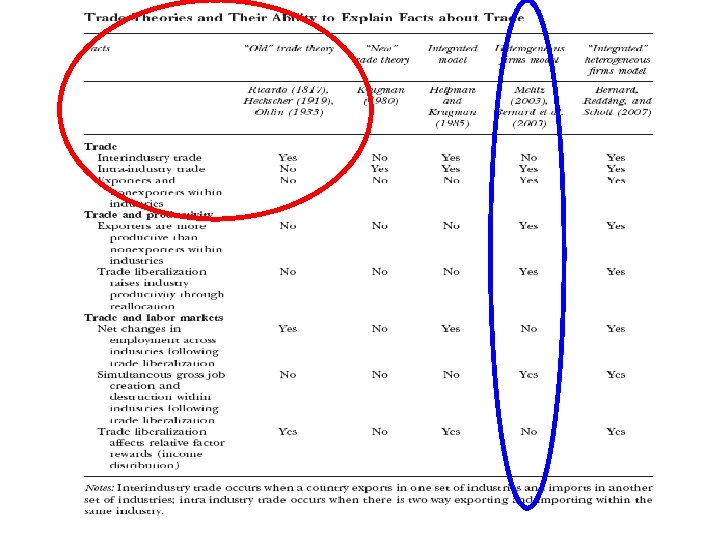
Theoretical intuitions of the new trade theory models 6
Intuition: random productivity ►Heterogeneous firms models (Melitz, 2003) are based on monopolistic competition, but they allow firms to have different productivity ►Potential firms do not know their productivity ►They have to pay a cost to discover it ►Once they know their productivity they can setup a plant or exit the market ►Setting up a plant implies a fix cost 7
Intuition: expectations ►A firm will pay the sunk cost to discover its productivity only if the expected productivity is sufficiently high to make it worth ►If there is a high probability to pick up a very low productivity - so low that it would not make production profitable - then the firm would not pay the sunk cost to discover it 8
Intuition: superstars ►Suppose you pay the sunk cost and get some productivity level (i. e. marginal cost) ►Would you pay the fix cost to setup a plant? ►Yes, if your productivity is sufficiently high to make it profitable exit otherwise ►Medium productivity firms enter the market ►High productivity firms are larger ►Extremely productive firms are superstars 9
Intuition: international trade ►In this closed-economy framework, imagine that firms can export ►But exporting is costly and implies a fix cost ►Who will export? ►Trade-off: (export + fix cost) vs. (no-export + no cost) 10
Intuition: exporters are better ►If the firm expects high export volumes, than it is convenient to pay the fix export cost ►If the firms expects low exports volumes, than it is unprofitable to export ►Only high productivity firms will find it profitable to export ►Similar argument for other activities…e. g. FDI 11
Let’s concentrate on Firms’ productivity 12
Measuring Productivity To measure real output we use value added • Value added is defined as sales minus raw materials used • Indicates what the firm has truly produced when transforming the raw materials into the final product • Both sales and raw materials have to be deflated for any price inflation when measuring over time Definitions of partial factor productivity: • labour productivity (value added per unit of labour) • capital productivity (value added per unit of capital) • High labour productivity is often largely explained by high levels of capital per worker (e. g. in mining and the steel industry) • High capital productivity will be present when labour is used intensively (e. g. in developing countries with scarce capital)
Measuring total factor productivity • This measure improves on partial factor productivity by correcting for growth in inputs • Derivation of total factor productivity: Suppose value added (Y) is produced by two input factors capital (K) and labour (L) and by total factor productivity (A) according to: Y = A K a. L b • Then growth of TFP is calculated by residual: g. A = g Y – a g. K – b g. L • Growth in TFP is equal to the growth in value added, less a times the growth in capital input and b times the growth in labour input
Methodological Issues Challenges: 1. Difficult to measure outputs and inputs especially capital a. Capital b. Prices especially at micro level 2. Estimating factor elasticities: a. OLS b. Cost Shares c. Proxy methods (Olley-Pakes; Levinsohn-Petrin) d. IV
Mixed Messages on Challenges… • Labor productivity and TFP often highly correlated – More important to get representative sample and firm dynamics than TFP? • Capital measurement difficult and potentially important for policies/institutions • Price/output measurement difficult given data limitations and very important for positive and normative implications
Measuring productivity, end • A well-known (and probably severe) problem with measuring productivity is that we rarely observe output yit properly. • Instead, in most settings, one sees revenues/sales rit at the plant level but some price measure only at the industry level: pt • Klette and Griliches (1995) show the consequences of this: What we think is a measure of firm-level TFP (eg yit /g(vit )) is really a mixture of firm-level TFP, firm-level mark-ups, and firm-level demand-shocks. • This is bad for studies of productivity. But it is worse for studies like Pavcnik (2002) above that want to relate economic change (like trade liberalization) to changes in productivity. • Economic change (including trade liberalization) may change mark-ups and demand. • Indeed, theory such as BEJK (2003) and Melitz and Ottaviano (Re. Stud, 2008) suggests that mark-ups will change. • And Tybout (2000, Handbook chapter) reviews evidence of mark-ups (and profit margins) changing. • de Loecker and Warzynski (AER 2012) extend Hall’s (1988) method for measuring mark-ups and finds that they differ by firm trading status.
Trade and productivity ►IFs are more productive, what is the direction of causality? 1. Prod. trade: self-selection (yes) 2. Prod. trade: learning-by-exporting (maybe) ►Trade forces the least productive firms to exit ►Trade liberalization reallocates market shares towards more productive firms 18
Self-selection ►Wagner (2007) reviews 54 firm-level studies for 34 countries between 1995 and 2006 ►Singh (2010) reviews 2006 -2008 studies ►Exporters have higher productivity ex-ante ►Holds controlling for many characteristics ►Future exporters are better years before they become exporters, other things equal 19
Aggregate facts ►Evidence from Wagner (2011) survey ►The number of export markets increases with productivity ►Exporters to more developed countries have superior ex-ante productivity levels than nonexporters and exporters to less developed countries ►Evidence on learning-by-exporting is scant and inconclusive 20
Reallocations ►Lower trade costs allow foreign firms to enter the domestic market ► market share of domestic firms shrinks, some domestic firms must exit (low prod. ) ►But some domestic firms also gain access to foreign markets ► these domestic firms earn additional profits abroad (high prod. ) 21
Reallocations ►Trade makes low productivity firms exit, medium productivity firms shrink domestically and high productivity firms expand abroad ►Average productivity increases! ►Trade increases average productivity by reallocating resources from low to high productivity firms 22
More on Stylized facts 23
Stylized facts ►IFs are superstars: few and big ►IFs are an exclusive club: more productive, higher value added, higher wages, more K/L, more skilled workers ►Intensive margin: average exports, imports and FDI ►Extensive margin: number of firms ►Adjustments take place mostly through the extensive margin 24
Superstar exporters Share of exports for top exporters in 2003, total manufacturing Source: Mayer-Ottaviano (2008) 25
Superstar exporters France 2003, total manufacturing Enrico Marvasi 26 Source: Mayer-Ottaviano (2008)
Fact 1 ►Aggregate exports are driven by a small number of top exporters ►Top 1% accounts for at least 40% of exports ►Top 5% accounts for at least 70% of exports ►Top 10% accounts for at least 80% of exports 27
Exporters are heterogeneous ►Even among exporters, the top exporters represent a disproportionate share of exports ►Many firms export very little amounts ►Only for few firms export represent a large share of sales 28
Extensive margin Source: Mayer-Ottaviano (2008) 29
Fact 2 ►Top exporters export many products to many countries ►Firms exporting more than 10 products to more than 10 markets account to for more than 75% of exports 30
Exporters and investors premia October 20 Enrico Marvasi 31 Source: Mayer-Ottaviano (2008)
Productivity premium Belgium 2004 Source: Mayer-Ottaviano (2008) Enrico Marvasi 32
Fact 3 ►FDI firms perform better than exporters and exporters perform better than non-exporters ►Again larger, more profitable, more Kintensive, more productive, pay higher wages ►Exporters are also more likely to be foreign owned than non-exporters 33
More on Intensive and Extensive Margins • With access to micro data on trade flows at the firm-level, a key question to ask is whether trade flows expand over time (or look bigger in the cross-section) along the: • Intensive margin: the same firms (or product-firms) from country I export more volume (and/or charge higher prices —we can also decompose the intensive margin into these two margins) to country j. • Extensive margin: new firms (or product-firms) from country i are penetrating the market in country j. This is really just a decomposition—we can and should expect trade to expand along both margins. Different papers look at this. • A rough lesson from these exercises is that the extensive margin seems more important (in a purely ‘accounting’ sense, not necessarily a causal sense).
Crozet and Koenig (CJE, 2010) Data from French manufacturing firms trading internationally, by domestic region j. (Extensive margin biased down by inclusion of only firms over 20 workers.
Fact 4 ►Variation in trade is mostly due to change in the number of exporters ►It accounts for most of the negative impact of trade barriers ►It accounts for most of the positive impact of the importing country’s size ►It accounts for all the positive impact of the exporting country’s size 36
Fact 5 ►Larger countries have more exporters, export more products, have smaller average exports per product ►Trade barriers reduce the number of exporters and the number of products, they increase average exports per product 37
Fact 6 ►Average quantity exported per product by firm decreases with country’s size (no gravity) ►Average price per product by firm increases with country size ►Both product quantity and price increase with trade barriers 38
Firm productivity and industry specialization ►More productive firms become larger and internationalize ►In different countries this is more likely to happen in different sectors ►Can we reconcile firm-level evidence with traditional industry specialization? 39
New new trade theory • Evidence suggests that successful theoretical frameworks for studying firms and the decision to export should include two features: 1. Within sectoral heterogeneity in size and productivity 2. A feature that leads only the most productive firms to engage in foreign trade • Melitz model 2003
Heterogeneous Firms • Melitz (2003) follows Hopenhayn (1992). • Individual firms each have a randomly chosen productivity parameter, as well as differentiated products • Bernard, Redding, and Schott (2005) put Melitz model in the HO model 41
Outline of the Melitz (2003) Model Extension of the “Krugman model” Firms use labor to produce varieties of manufacturing good Firms enter a market by paying a sunk entry cost Firms observe their productivity j from a distribution g(j) There is a fixed cost of producing and a fixed cost of exporting • Firms decide whether to produce or exit the industry • If firms produce, they decide whether to serve only the domestic market or also to export • Exogenous probability of firm death • • • 42
Models with Heterogeneous Firms reductions in barriers to trade → increase profits of exporters and reduce the export productivity cutoff → labor demand within the industry rises → increase in wages → profits of nonexporter decrease → less productive firms bankrupt A new source of gains from trade: Increase in productivity • Main Assumptions: – Many countries in the world and each trade with n 1 foreign country – Labour is the only production factor and is inelastically supplied – Labour does not move accross countries – Potential entrants face a sunk entry cost of fe units of labour 43
Preferences • Preferences are defined over consumption of a continuum of horizontally-differentiated varieties – Consumer prefers to have a diversified bundle of goods (1) – Where • indexes varieties • is the set of varieties available to consumers • is a measure of substitutability
Preferences (2) • Price index of all varieties is defined as: – Where is the elasticity of substitution between varieties – Hence, utility is positively correlated with number of varieties available • Revenue of a variety supplied to the domestic market is: (2) – Where: • pd( ) is price of variety • R equals aggregate income • P summarizes prices of competing varieties
Technology • A firm draws its productivity, , from a fixed distribution g( ) • Productivity remains unchanged after entry but firms face a probability of death (more later) • Production of a variety involves a fixed cost and a constant variable cost that depends on firm productivity, • Total labour required to produce q( ) of output is: • Where fd is fixed cost of units of labour
Production and Exporting Decisions • If firms decide to export: – They face a fixed exporting cost of fx units of labour – An iceberg variable trade cost of >1 for each variety • In the absence of fixed exporting cost all firms would export • Each firm supply one of the continuum varieties so it takes the price index as given • Applying F. O. C for profit maximization – Equilibrium prices are a mark-up over marginal cost that depends on the elasticity of demand
Production and Exporting Decisions • Given the same elasticity of demand in both markets, prices in the export market are a constant multiple of domestic prices (3) – Where wage (w) equals one for all countries • Equilibrium firm revenue in both markets is: (4) • From equation (4) revenue depends on variable trade cost
Profits • Firm profit in each market equals variable profits minus relevant fixed cost – Domestic market: (5) – Foreign market: (6) • Equation (5) implies that, there is a zero-profit cutoff productivity ( * ) below which firms will earn negative profits, so they exit from the market • Likewise, identity (6) implies there is an exporting cutoff productivity ( * ) below which surviving firms would not export d x
Steady-state Industry Equilibrium π * d * x -fd -fx Domestic mkt Foreign mkt
Steady-state Industry Equilibrium (2) • Exit and Entry of Firms – Productivity is fixed at entry and firms face a constant probability of death – Hence, ex-post productivity distributions in both markets are truncations of the ex-ante productivity distribution at the zeroprofit and exporting cutoff conditions (7) (8)
Steady-state Industry Equilibrium (3) • If free entry condition holds, the expected value of entry must be equal to sunk entry cost • Thus the expected value of entry depends on the value of each firm with its productivity (9) • In steady-state equilibrium the number of successful entrants must equal the number of firms exiting (10)
The equilibrium π Forces least productive firms to exit (competitive pressure) Re-allocates market shares towards more productive firms
Trade Liberalization and Intra-Industry Reallocation • When the economy opens to trade the exporting cutoff productivity will fall, while the zero-profit cutoff productivity will increase –. . . *x *d • Low-productive firms with productivities above the old but below the new zero-profit cutoff will exit the market • Intermediate-productivity firms will only serve the domestic market (with a contraction in revenue due *d ) • High-productive exporting firm will experience revenue contraction in the domestic market but revenue will increase in the export market
Properties and new gains from trade • Within-industry reallocations of resources – Increase in aggregate productivity in all trading economies • Reallocations of market shares and profits among firms • Welfare gains: (interactions of three factors) – Decrease in the number of non-exporters firms – Increase in the number of exporters – Increase in average productivity of domestic firms
Profits and Productivity with no Trade pi pi( ) No Trade - fi . . i i. A* Produce Exit 56
Trade Liberalization in the Melitz Model pi( ) Trade pi pi( ) No Trade - fi . . i. CT* ix. CT* i. A* Domestic Market Exit 57 Export i
Heterogeneous Firms • Implications – Industry gets small, but doesn’t disappear, when factor prices move against it, since most productive firms survive – Thus avoids extremes of specialization – Supply responds to prices through entry or survival of less productive firms 58
Implications of the Melitz model • Melitz (2003) model is successful in accounting for several micro facts in the data • More importantly, this micro-founded model of industry equilibrium has generated important new insights for the aggregate response of exports to shocks • The increase in aggregate productivity is just one example, but many others have been highlighted • Several applications and extensions of the Melitz model are reviewed in Melitz and Redding (2013 a).
After Melitz, Intensive margin gravity. . • In the Melitz model, the intensive margin is independent of variable trade costs and of market size of the destination country. In other words, the model is consistent with export volumes from i to j being lower for smaller and more distant markets, but the reason for this is very different than in homogeneous-firm models à la Krugman. It is not because firms export on average lower volumes to those markets but rather because a smaller set of firms export to those markets. • Chaney shows that this affects, for instance, how the elasticity of trade flows with respect to trade frictions depends on the elasticity of substitution σ. • Another remarkable feature of the model is that it delivers a modified sectoral version of the gravity equation for trade flows, which has been shown to fit the data rather well.
Chaney model • Cheny in 2007 develops multi-sector, multicountry Melitz model with Pareto distribution of productivity • Shows that model predicts modified gravity equation • Standard gravity • Gravity with heterogeneous firms