Is California Special Tony Correia Glenn Proctor Stephen











- Slides: 47
Is California Special? Tony Correia Glenn Proctor Stephen Rannekleiv
Topic of Discussion • Current supply and demand issues • Global competitor dynamics • SWOT analysis of California wine
1. Current supply/ demand issues
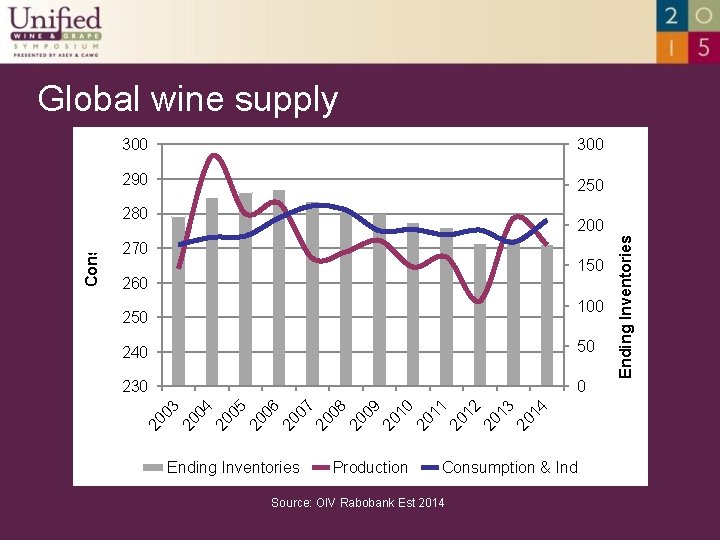
300 290 250 280 270 150 260 100 250 240 50 230 0 Ending Inventories Production Consumption & Ind Source: OIV Rabobank Est 2014 Ending Inventories 200 20 03 20 04 20 05 20 06 20 07 20 08 20 09 20 10 20 11 20 12 20 13 20 14 Production & Consumption Global wine supply
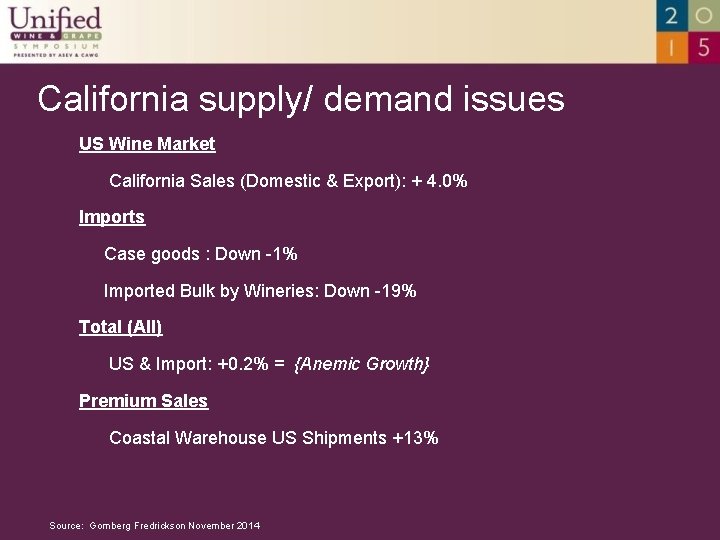
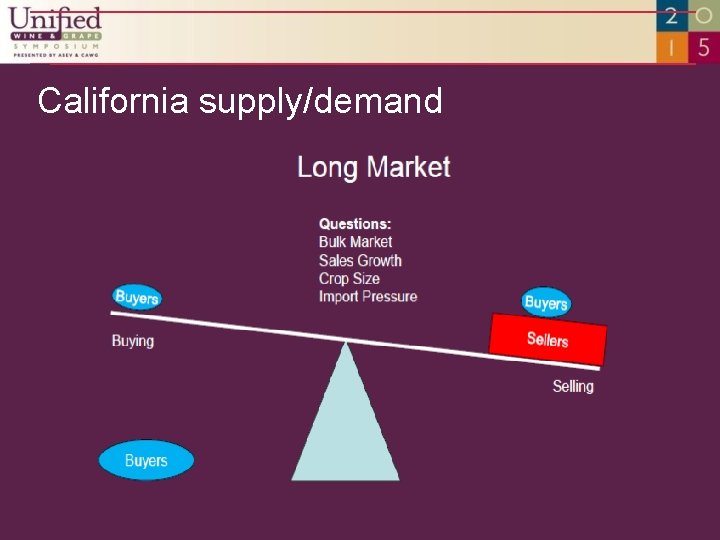
California supply/ demand issues US Wine Market California Sales (Domestic & Export): + 4. 0% Imports Case goods : Down -1% Imported Bulk by Wineries: Down -19% Total (All) US & Import: +0. 2% = {Anemic Growth} Premium Sales Coastal Warehouse US Shipments +13% Source: Gomberg Fredrickson November 2014
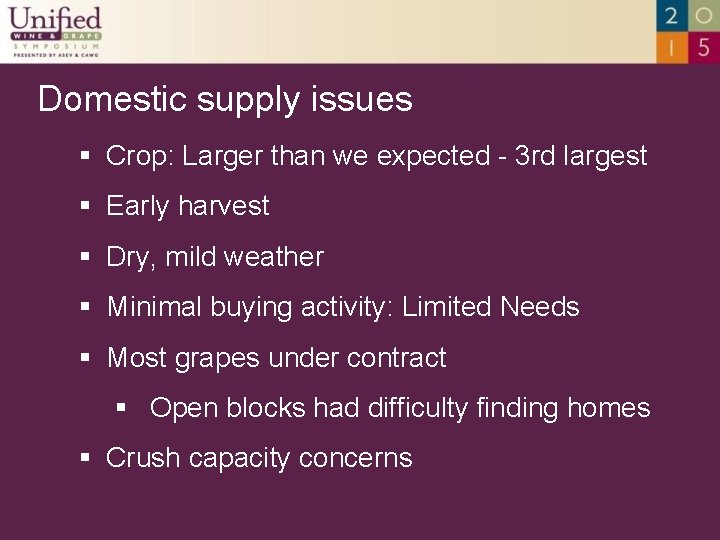
Domestic supply issues § Crop: Larger than we expected - 3 rd largest § Early harvest § Dry, mild weather § Minimal buying activity: Limited Needs § Most grapes under contract § Open blocks had difficulty finding homes § Crush capacity concerns
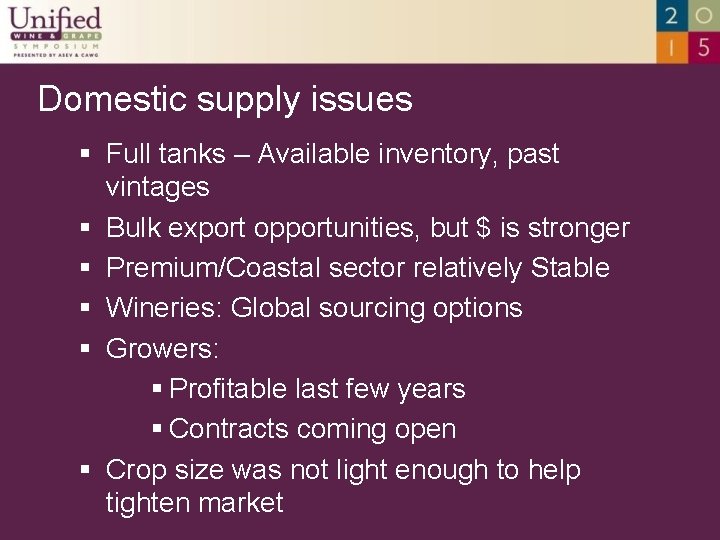
Domestic supply issues § Full tanks – Available inventory, past vintages § Bulk export opportunities, but $ is stronger § Premium/Coastal sector relatively Stable § Wineries: Global sourcing options § Growers: § Profitable last few years § Contracts coming open § Crop size was not light enough to help tighten market
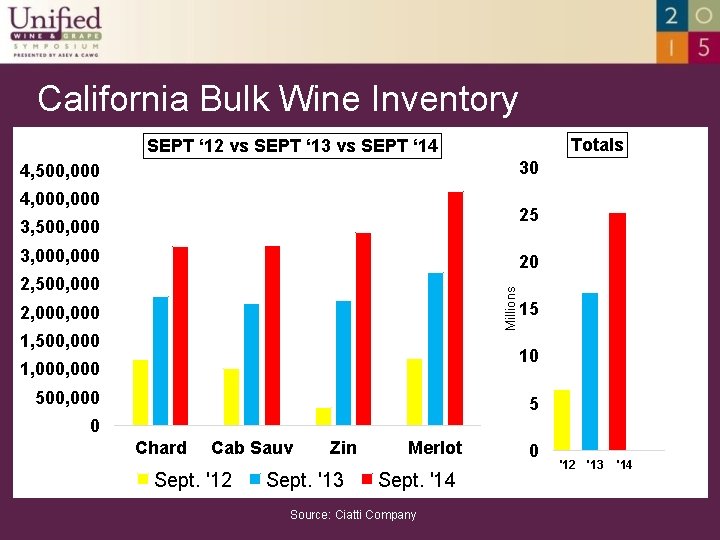
California Bulk Wine Inventory Totals SEPT ‘ 12 vs SEPT ‘ 13 vs SEPT ‘ 14 30 4, 500, 000 4, 000 25 3, 500, 000 3, 000 20 Millions 2, 500, 000 2, 000 1, 500, 000 15 10 1, 000 500, 000 5 0 Chard Cab Sauv Sept. '12 Zin Sept. '13 Merlot Sept. '14 Source: Ciatti Company 0 '12 '13 '14
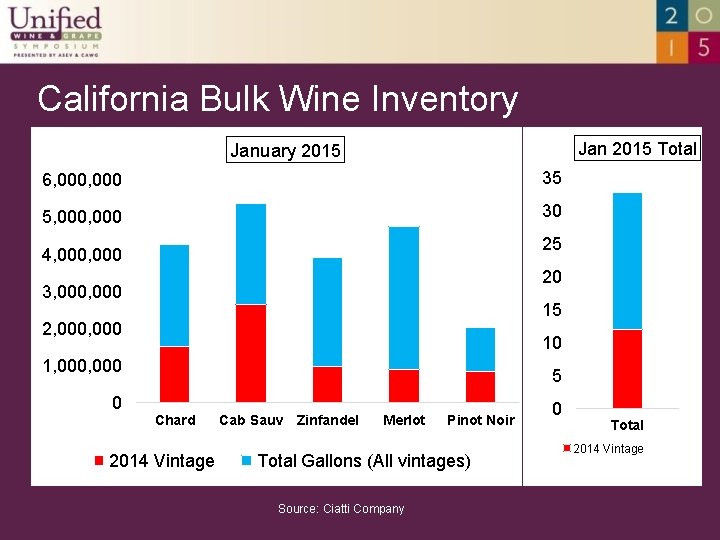
California Bulk Wine Inventory Jan 2015 Total January 2015 6, 000 35 5, 000 30 25 4, 000 Millions 20 3, 000 15 2, 000 10 1, 000 0 5 Chard 2014 Vintage Cab Sauv Zinfandel Merlot Pinot Noir Total Gallons (All vintages) Source: Ciatti Company 0 Total 2014 Vintage
California supply/demand
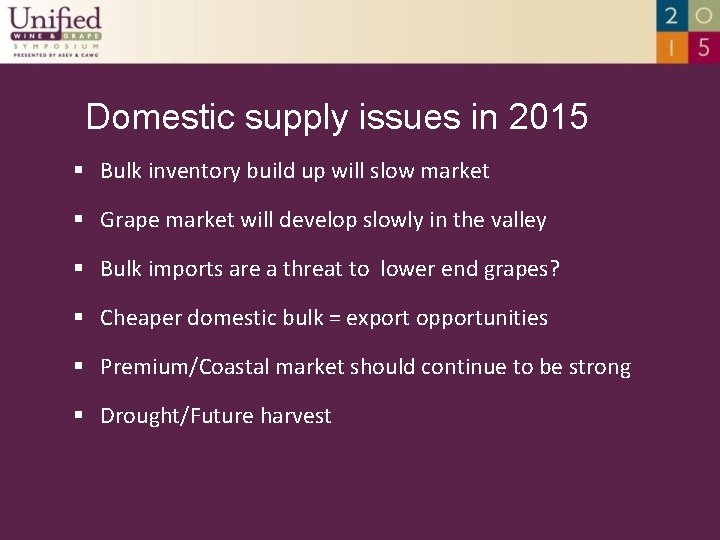
Domestic supply issues in 2015 § Bulk inventory build up will slow market § Grape market will develop slowly in the valley § Bulk imports are a threat to lower end grapes? § Cheaper domestic bulk = export opportunities § Premium/Coastal market should continue to be strong § Drought/Future harvest
2. Global competitor dynamics
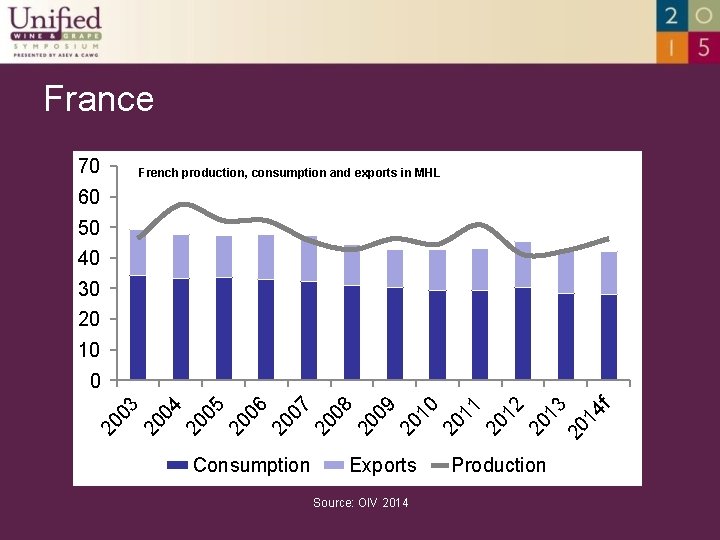
France 70 French production, consumption and exports in MHL 60 50 40 30 20 10 20 03 20 04 20 05 20 06 20 07 20 08 20 09 20 10 20 11 20 12 20 13 20 14 f 0 Consumption Exports Source: OIV 2014 Production
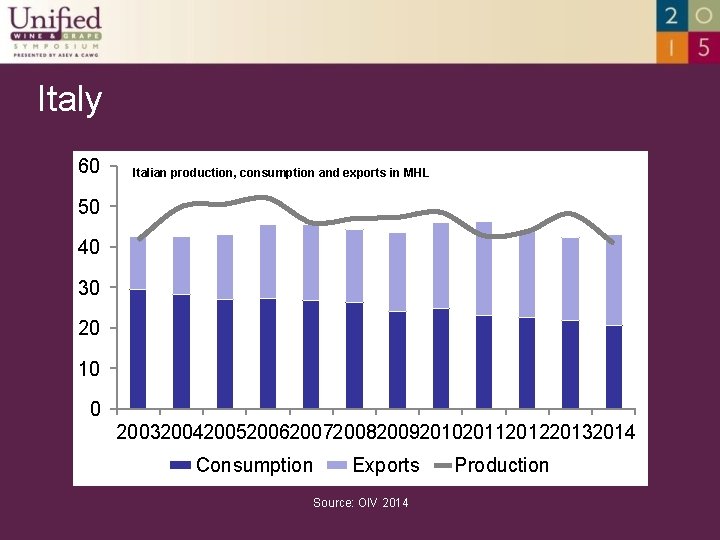
Italy 60 Italian production, consumption and exports in MHL 50 40 30 20 10 0 200320042005200620072008200920102011201220132014 Consumption Exports Source: OIV 2014 Production
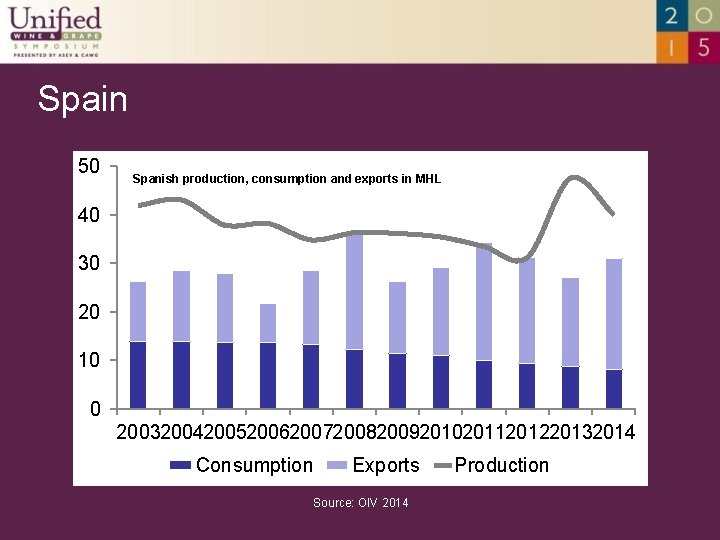
Spain 50 Spanish production, consumption and exports in MHL 40 30 20 10 0 200320042005200620072008200920102011201220132014 Consumption Exports Source: OIV 2014 Production
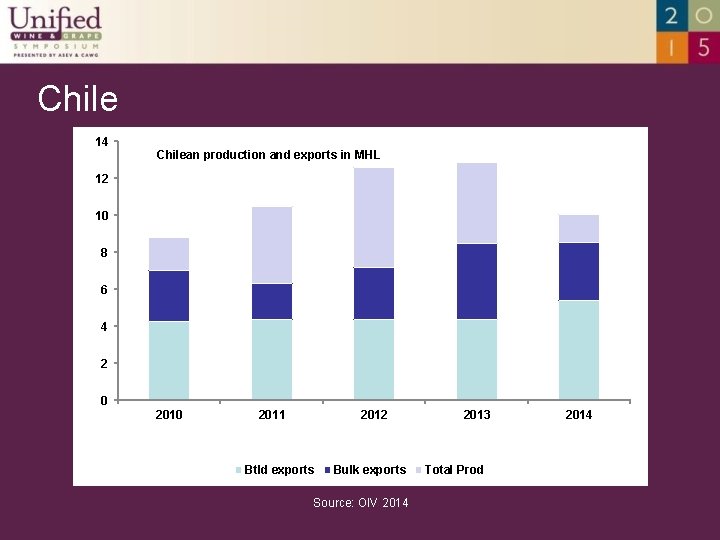
Chile 14 Chilean production and exports in MHL 12 10 8 6 4 2 0 2011 2012 Btld exports Bulk exports Source: OIV 2014 2013 Total Prod 2014
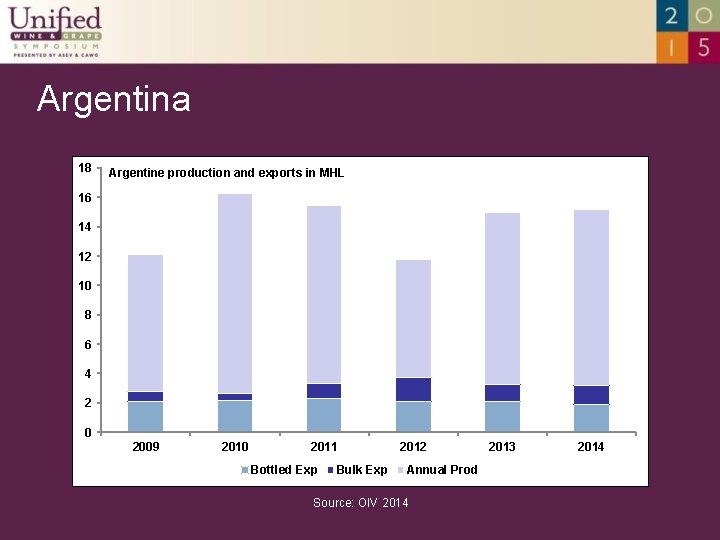
Argentina 18 Argentine production and exports in MHL 16 14 12 10 8 6 4 2 0 2009 2010 2011 Bottled Exp Bulk Exp 2012 Annual Prod Source: OIV 2014 2013 2014
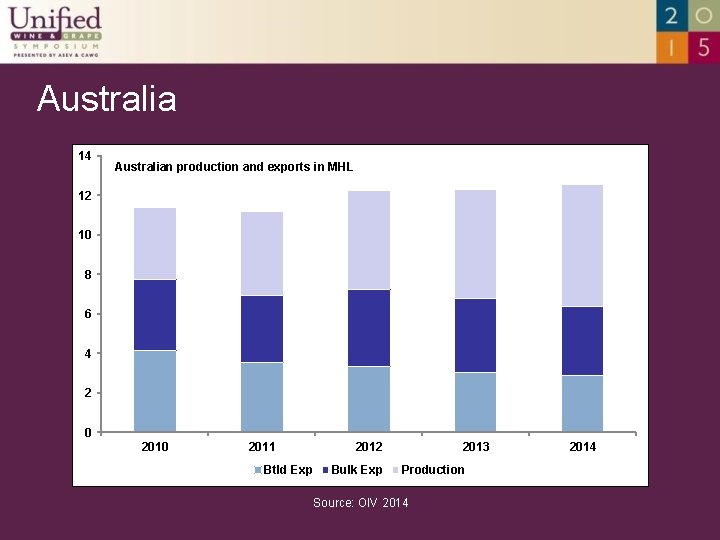
Australia 14 Australian production and exports in MHL 12 10 8 6 4 2 0 2011 Btld Exp 2012 Bulk Exp 2013 Production Source: OIV 2014
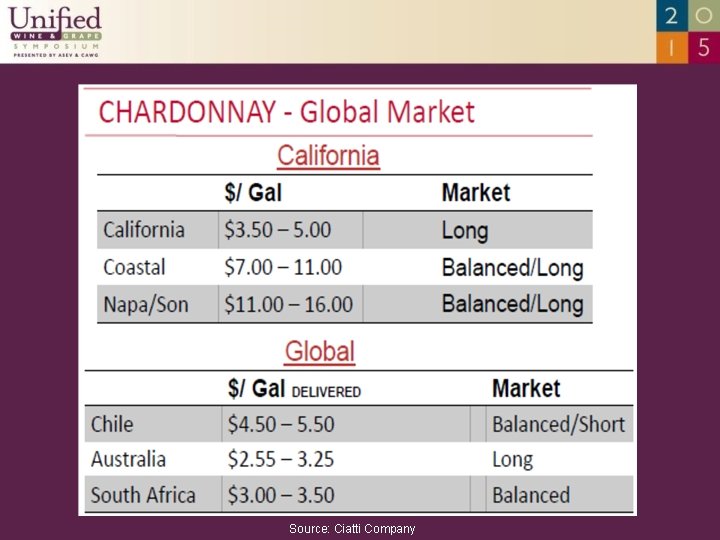
Source: Ciatti Company
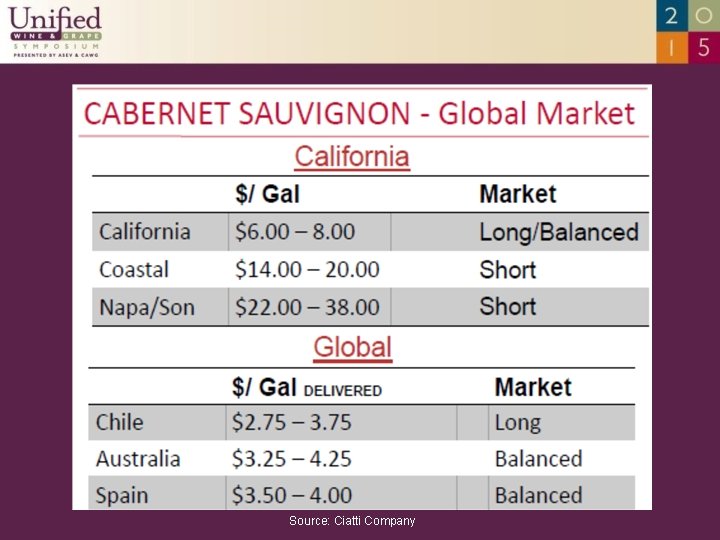
Source: Ciatti Company
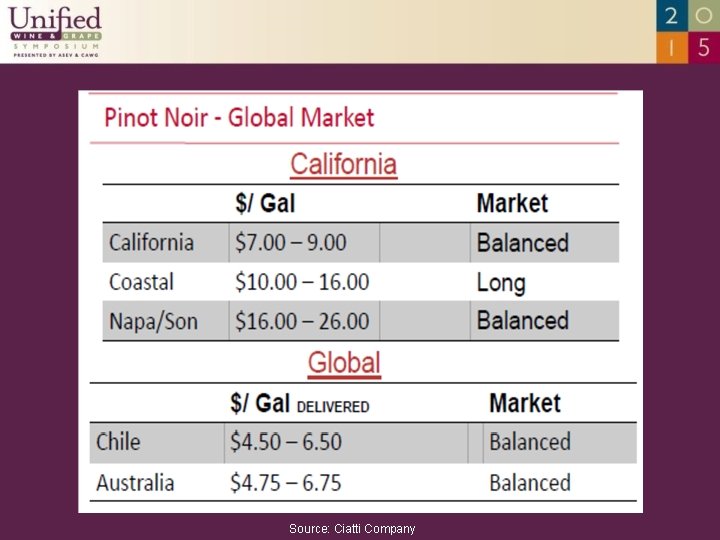
Source: Ciatti Company
3. SWOT analysis of the California wine industry
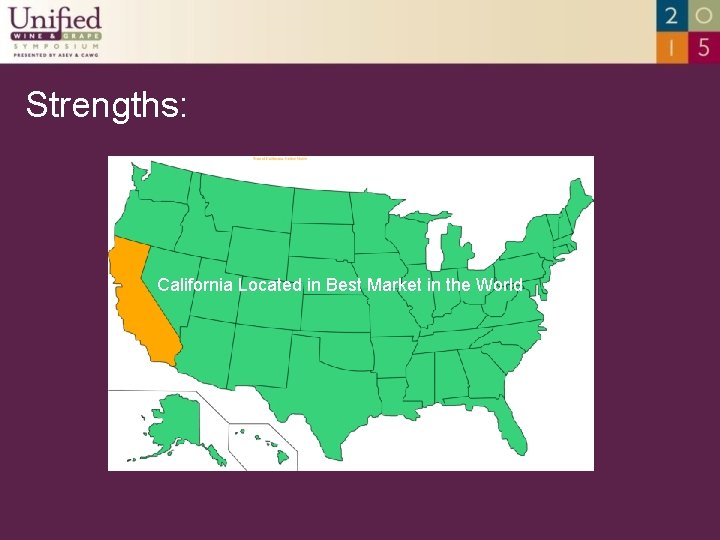
Strengths: California Located in Best Market in the World
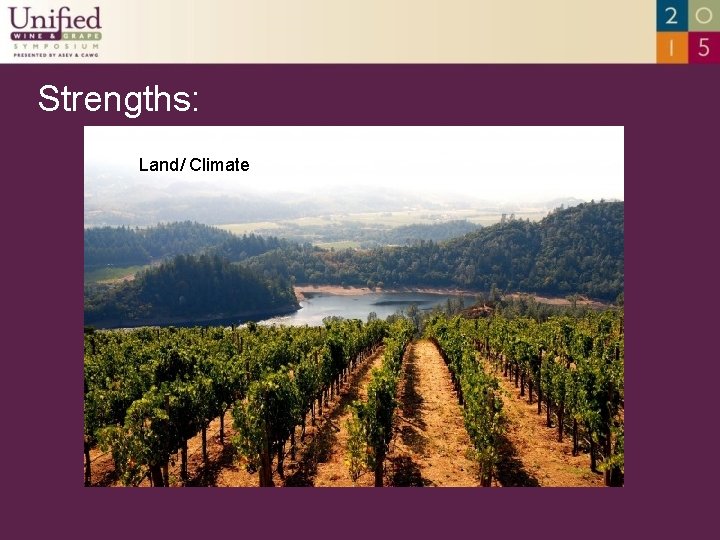
Strengths: Land/ Climate
Strengths: Research/ Technology support
Strengths: Flexibility to innovate
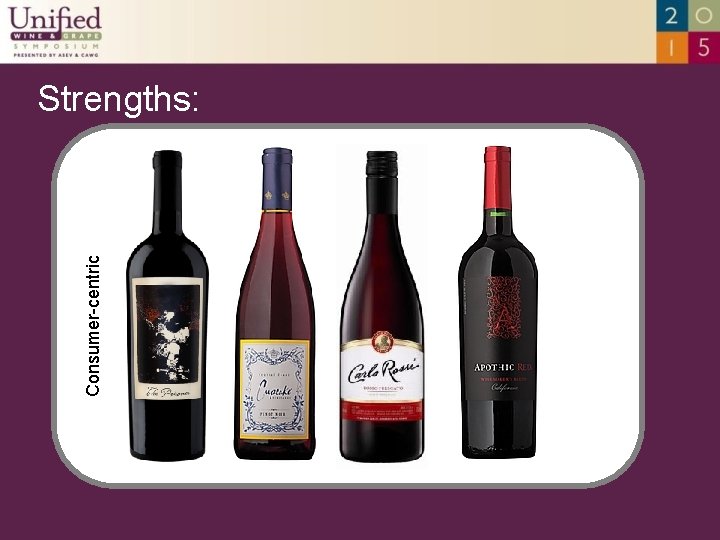
Consumer-centric Strengths:
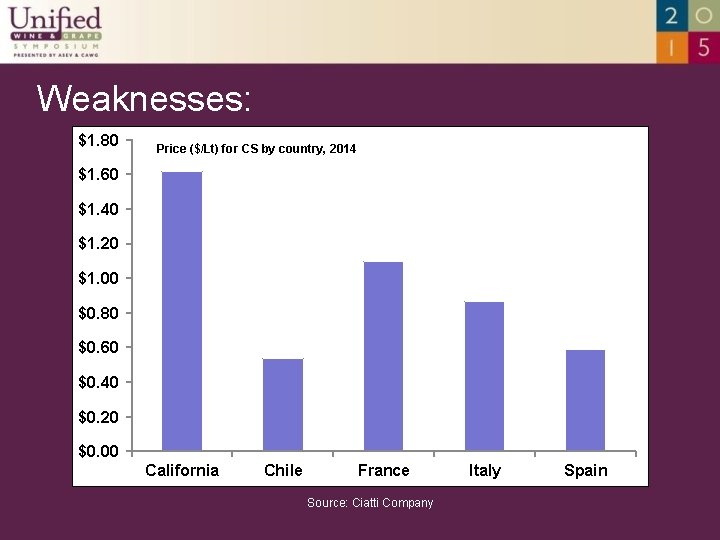
Weaknesses: $1. 80 Price ($/Lt) for CS by country, 2014 $1. 60 $1. 40 $1. 20 $1. 00 $0. 80 $0. 60 $0. 40 $0. 20 $0. 00 California Chile France Source: Ciatti Company Italy Spain
Weaknesses: Water
Weaknesses: Complacency
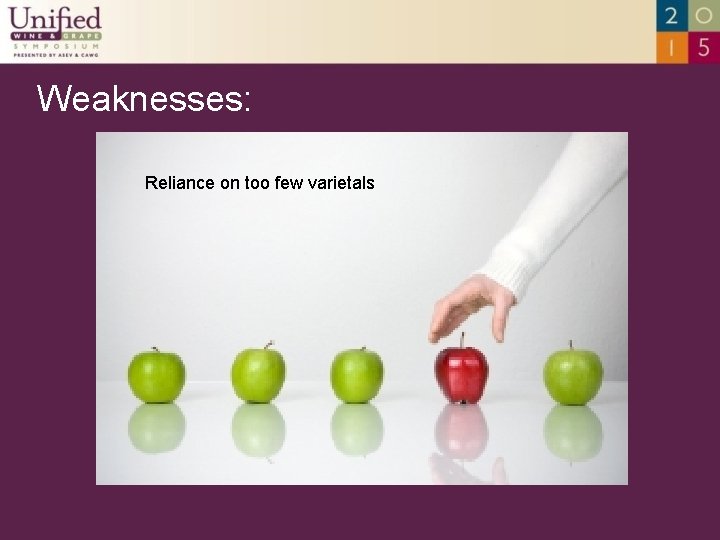
Weaknesses: Reliance on too few varietals
Weaknesses: Regulation
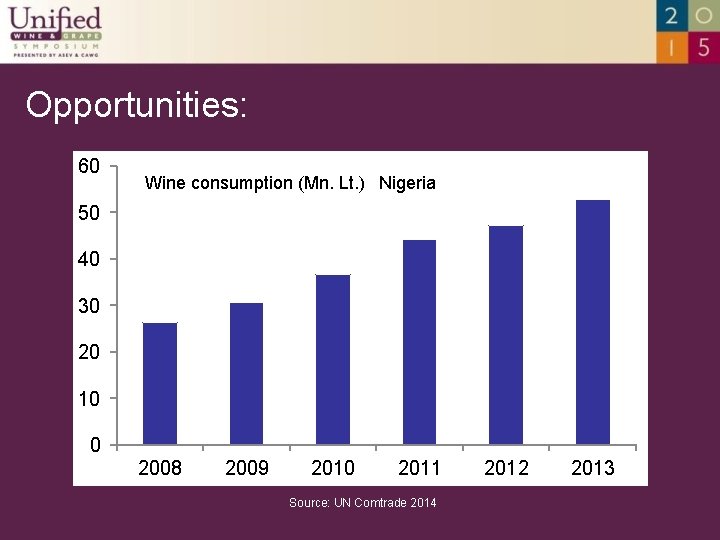
Opportunities: 60 Wine consumption (Mn. Lt. ) Nigeria 50 40 30 20 10 0 2008 2009 2010 2011 Source: UN Comtrade 2014 2012 2013
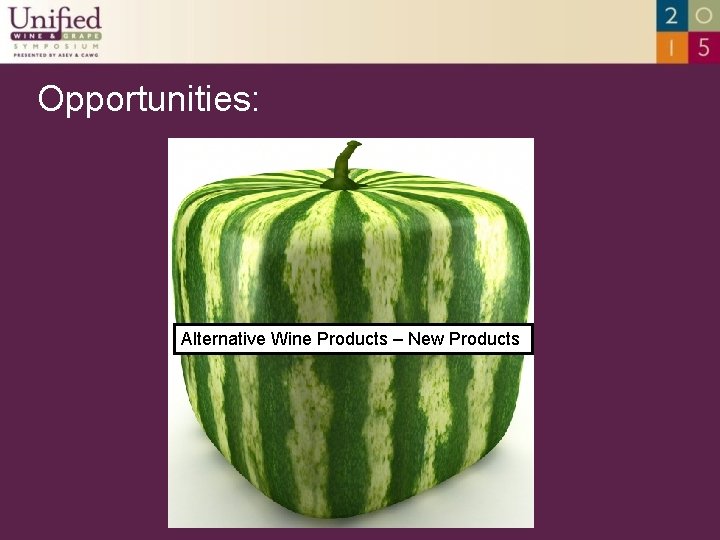
Opportunities: Alternative Wine Products – New Products
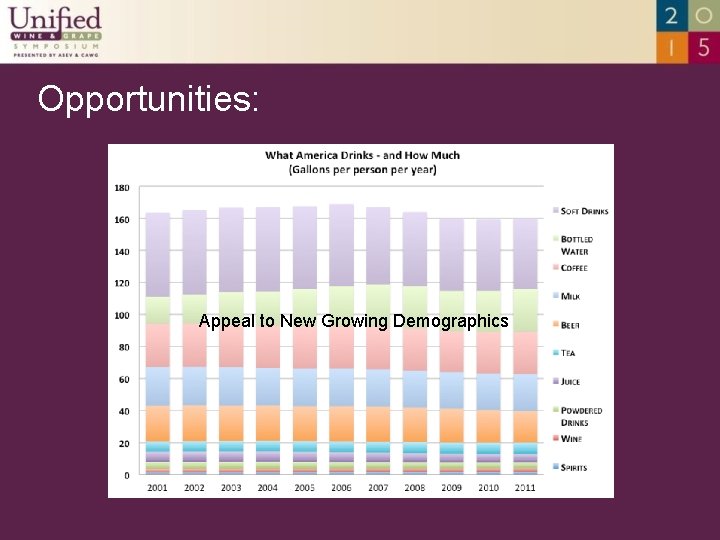
Opportunities: Appeal to New Growing Demographics
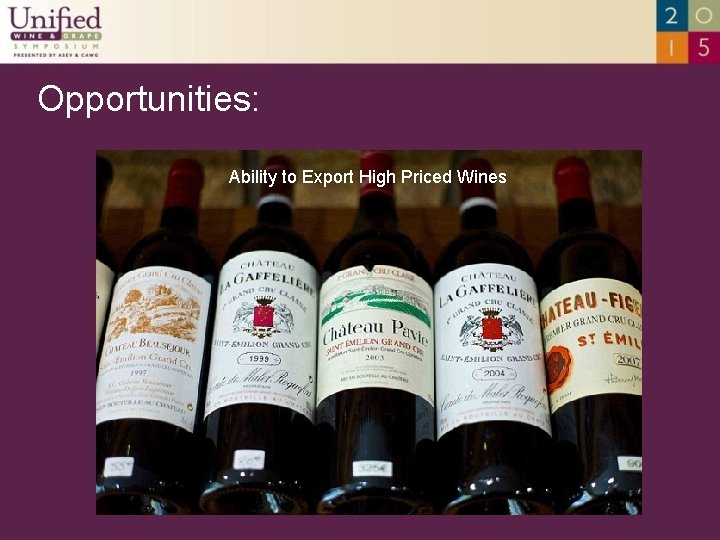
Opportunities: Ability to Export High Priced Wines
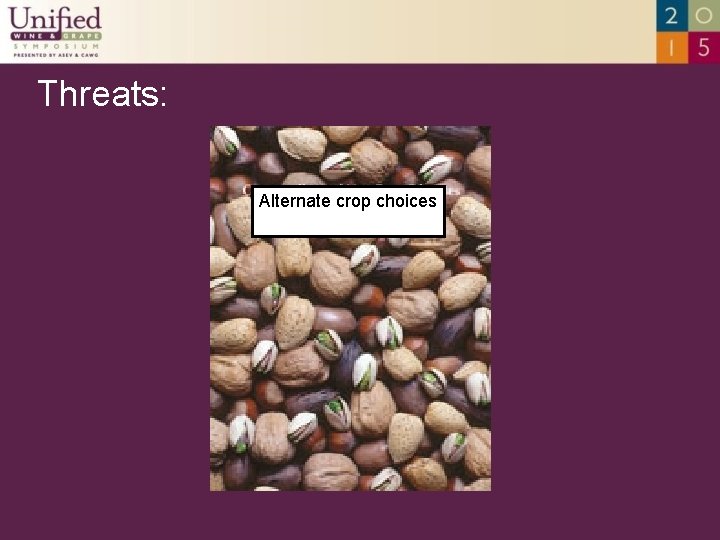
Threats: Alternate crop choices
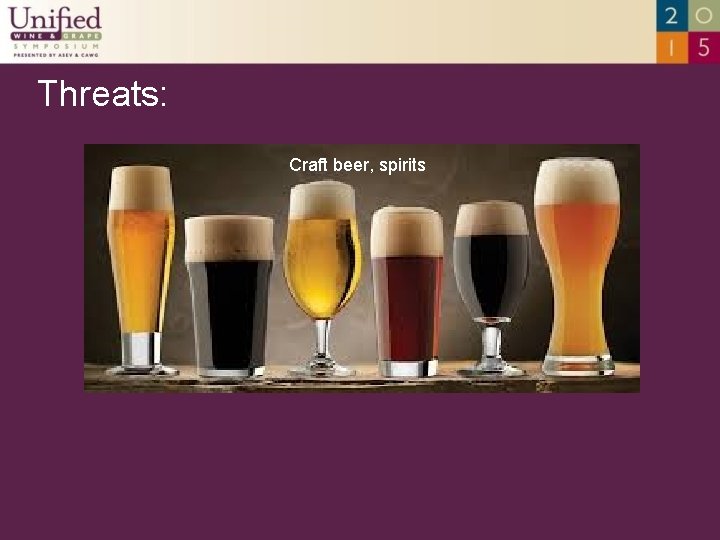
Threats: Craft beer, spirits
Threats: Pressure from imports
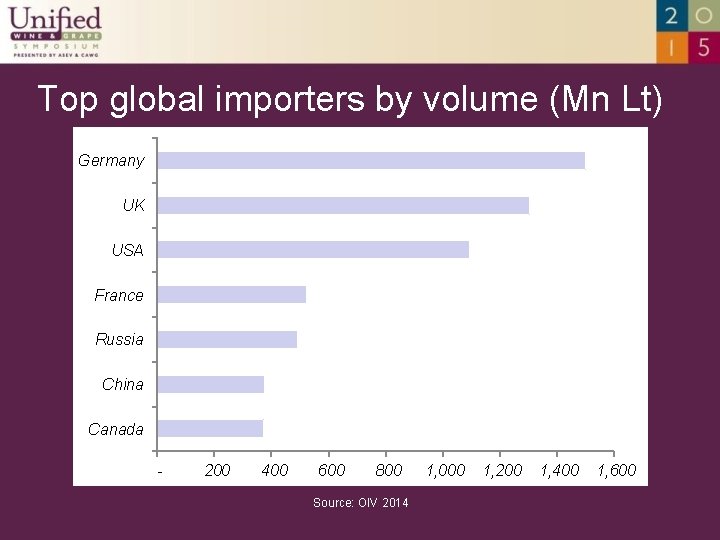
Top global importers by volume (Mn Lt) Germany UK USA France Russia China Canada - 200 400 600 800 Source: OIV 2014 1, 000 1, 200 1, 400 1, 600
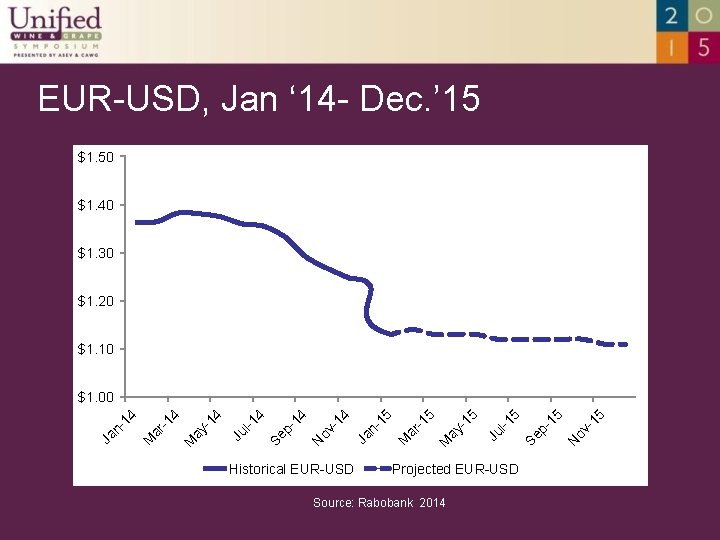
EUR-USD, Jan ‘ 14 - Dec. ’ 15 $1. 50 $1. 40 $1. 30 $1. 20 $1. 10 Historical EUR-USD Projected EUR-USD Source: Rabobank 2014 ov -1 5 N Se p 15 -1 5 Ju l ay -1 5 M -1 5 ar M Ja n 15 ov -1 4 N p 14 Se l-1 4 Ju ay -1 4 M -1 4 ar M Ja n 14 $1. 00
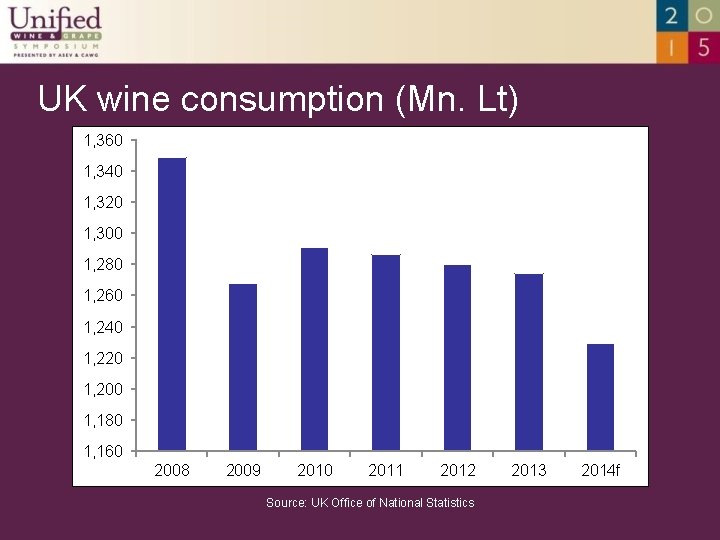
UK wine consumption (Mn. Lt) 1, 360 1, 340 1, 320 1, 300 1, 280 1, 260 1, 240 1, 220 1, 200 1, 180 1, 160 2008 2009 2010 2011 2012 Source: UK Office of National Statistics 2013 2014 f
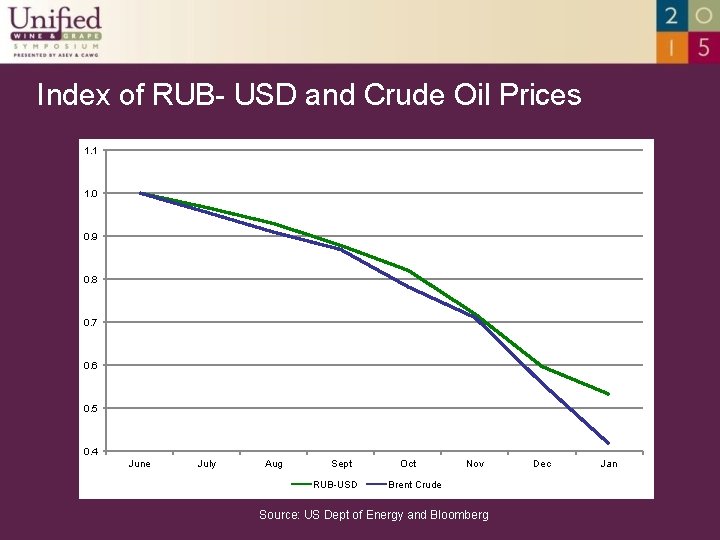
Index of RUB- USD and Crude Oil Prices 1. 1 1. 0 0. 9 0. 8 0. 7 0. 6 0. 5 0. 4 June July Aug Sept RUB-USD Oct Nov Brent Crude Source: US Dept of Energy and Bloomberg Dec Jan
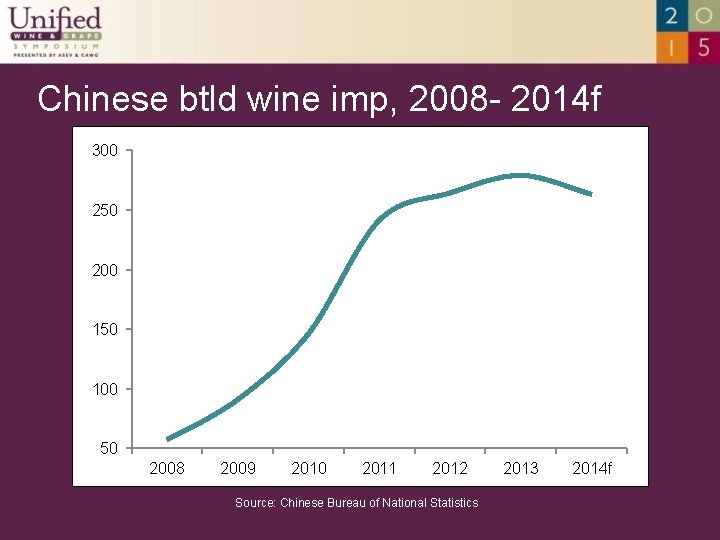
Chinese btld wine imp, 2008 - 2014 f 300 250 200 150 100 50 2008 2009 2010 2011 2012 Source: Chinese Bureau of National Statistics 2013 2014 f
Threats:
California is Special!
Thank You Tony Correia Glenn Proctor Stephen Rannekleiv