
Data Analysis and School Improvement January 23 2018





- Slides: 60
Data Analysis and School Improvement January 23, 2018 Glenn Nathan ESC – Region 19 ganathan@esc 19. net
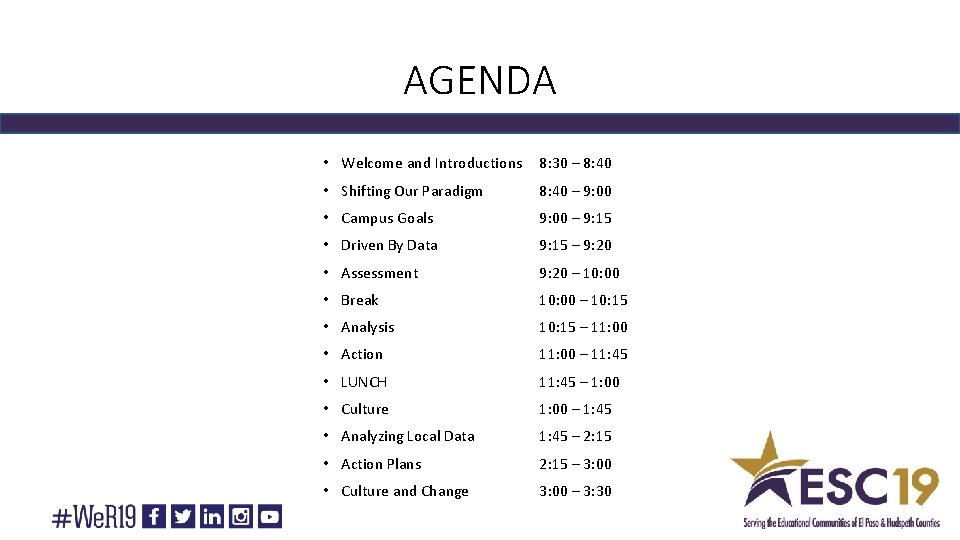
AGENDA • Welcome and Introductions 8: 30 – 8: 40 • Shifting Our Paradigm 8: 40 – 9: 00 • Campus Goals 9: 00 – 9: 15 • Driven By Data 9: 15 – 9: 20 • Assessment 9: 20 – 10: 00 • Break 10: 00 – 10: 15 • Analysis 10: 15 – 11: 00 • Action 11: 00 – 11: 45 • LUNCH 11: 45 – 1: 00 • Culture 1: 00 – 1: 45 • Analyzing Local Data 1: 45 – 2: 15 • Action Plans 2: 15 – 3: 00 • Culture and Change 3: 00 – 3: 30
Framing Our Lesson WE WILL: Learn the core elements for implementing data driven instructional practices. I WILL: Analyze current data from my campus and determine one action item that will improve student outcomes.
Rethinking Our Responsibilities What is your responsibility as a __________? What does the state of Texas say is your responsibility as a ________? Are you aligning to state expectations in terms of your professional responsibility? If yes, what evidence do you have to support your statement? If no, why is there a difference? How do we manage that difference?
Rethinking Our Responsibilities • How do we quantify our efforts and responsibilities in Texas education? • When the state issues an accountability rating, what is the state measuring? • What story is the data at your school/district telling? • Do you like or agree with the story being told by your data? • How can we change this story?
Rethinking Our Responsibilities As a ________, the state of Texas expects me to _________, and I will meet that expectation as given by _____________.
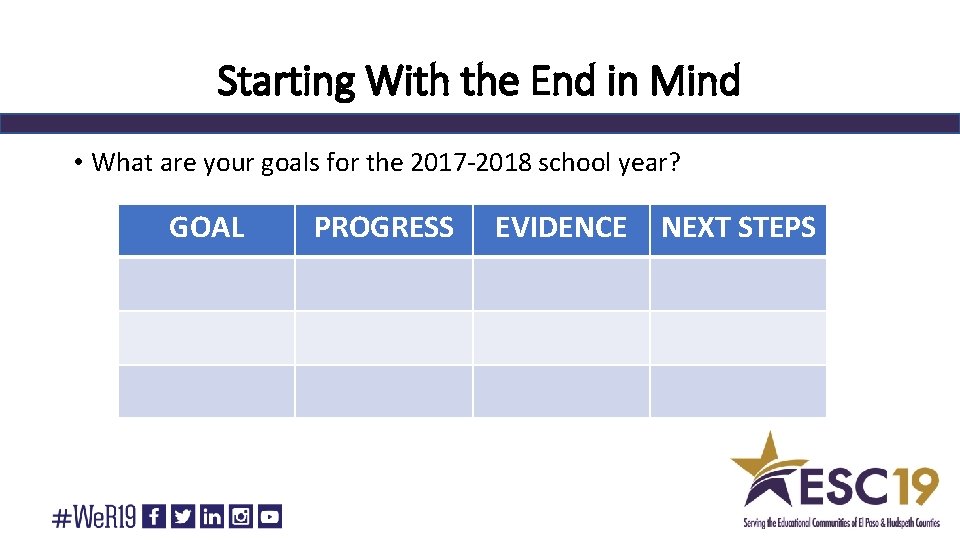
Starting With the End in Mind • What are your goals for the 2017 -2018 school year? GOAL PROGRESS EVIDENCE NEXT STEPS
Driven By Data • We must ground ourselves in common vocabulary and practices. • TEA, PSP’s, TCDSS, ESC, District, Campus • Our practices must be research/evidenced/objective based to address the root cause and accomplish the desired goal. • As leaders, we must also be practitioners and agents of change and growth.
Driven By Data • What processes or practices do you have in place to reach your goal? • How is data used to drive your decision making? • Provide one example. • Is your school set up for sustainability?
Driven By Data
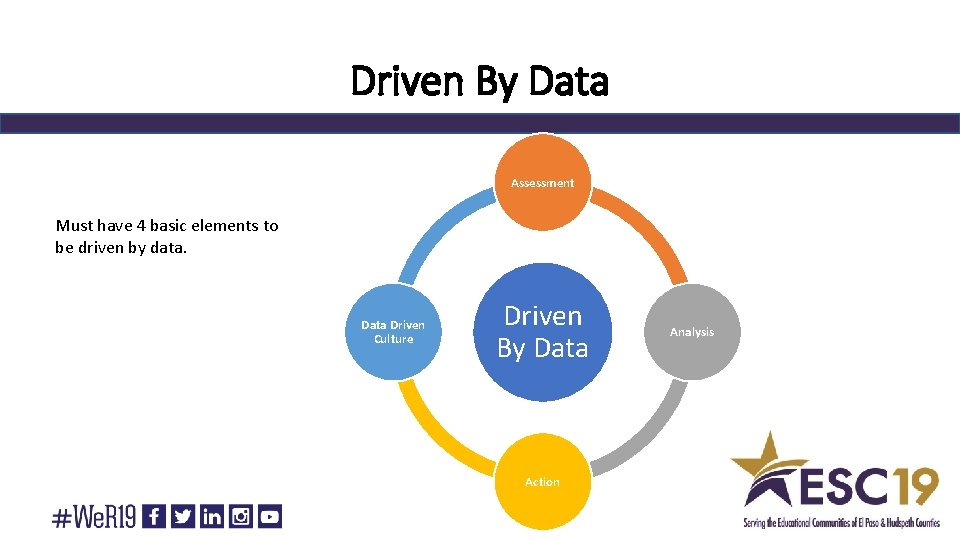
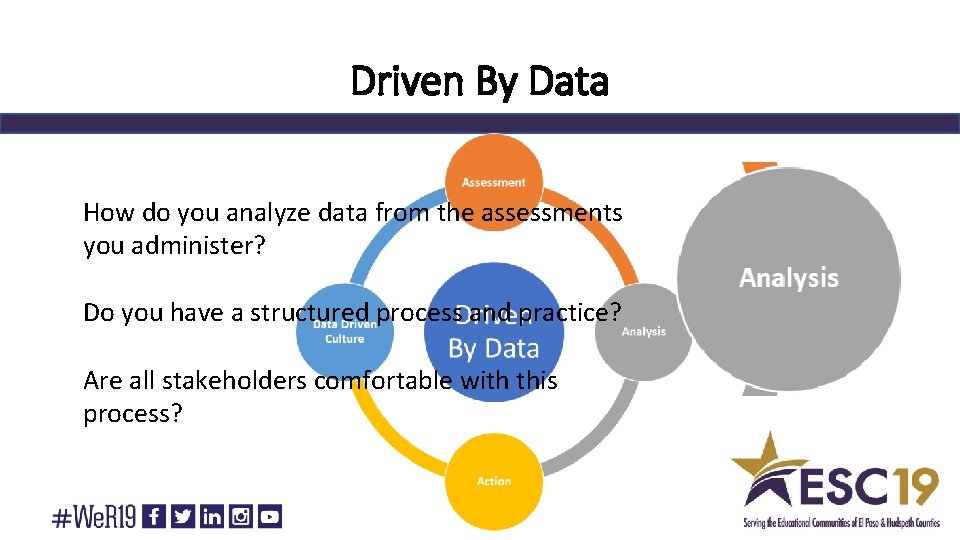
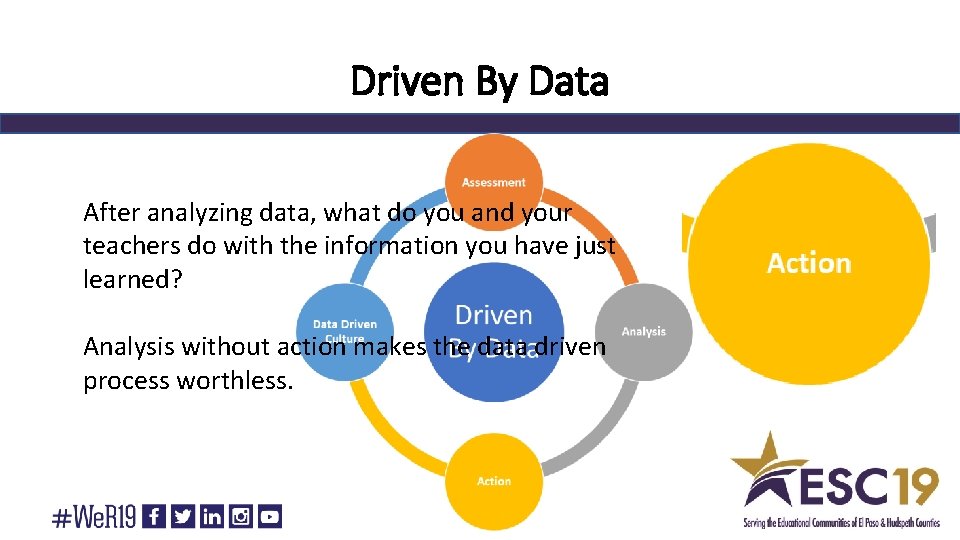
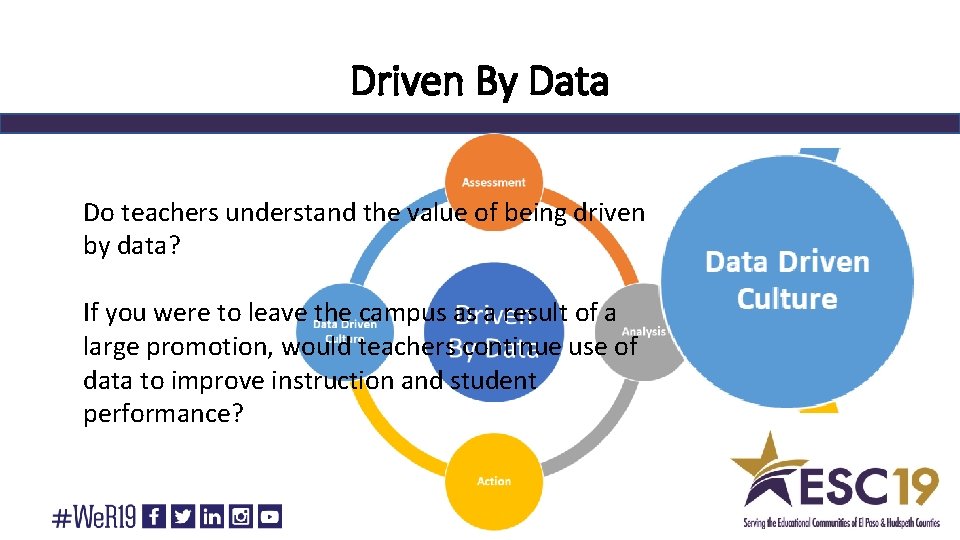
Driven By Data Assessment Must have 4 basic elements to be driven by data. Data Driven Culture Driven By Data Action Analysis
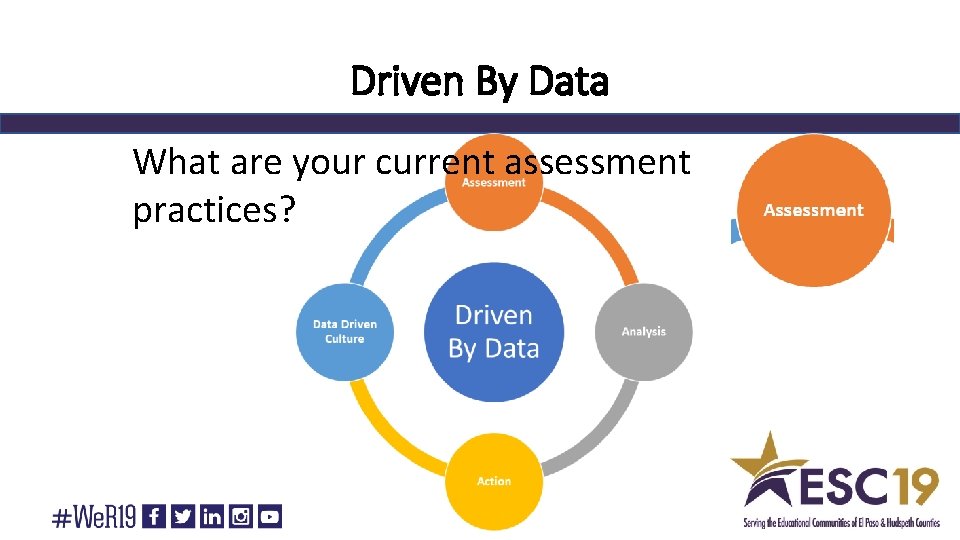
Driven By Data What are your current assessment practices?
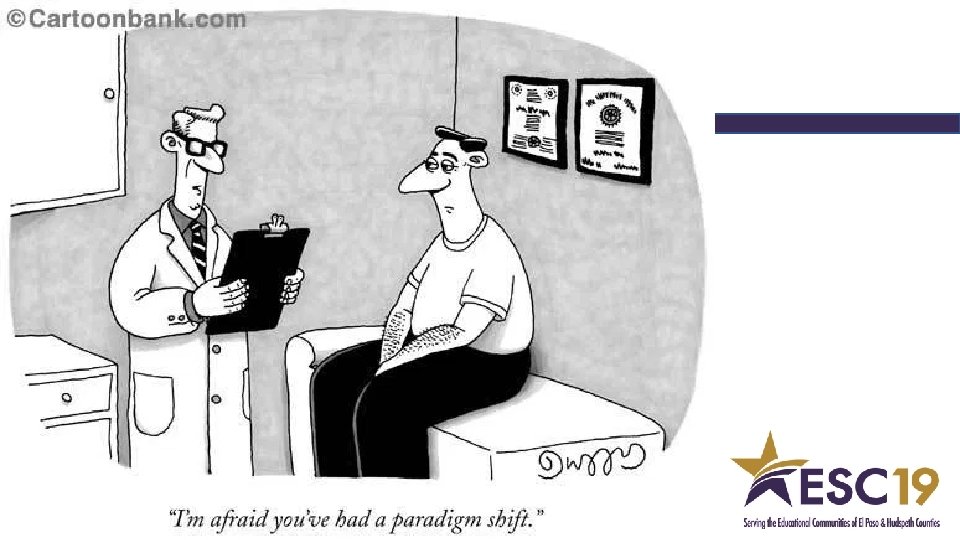
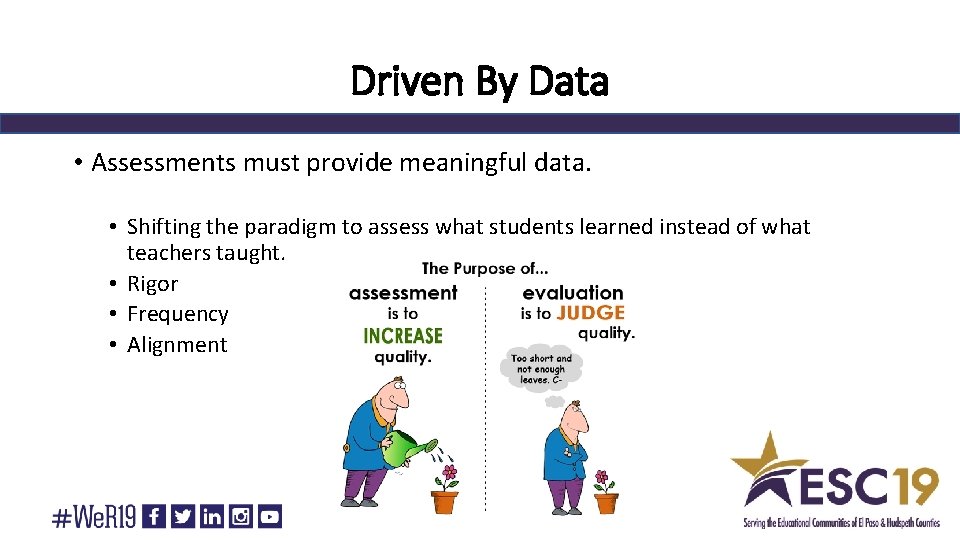
Driven By Data • Assessments must provide meaningful data. • Shifting the paradigm to assess what students learned instead of what teachers taught. • Rigor • Frequency • Alignment
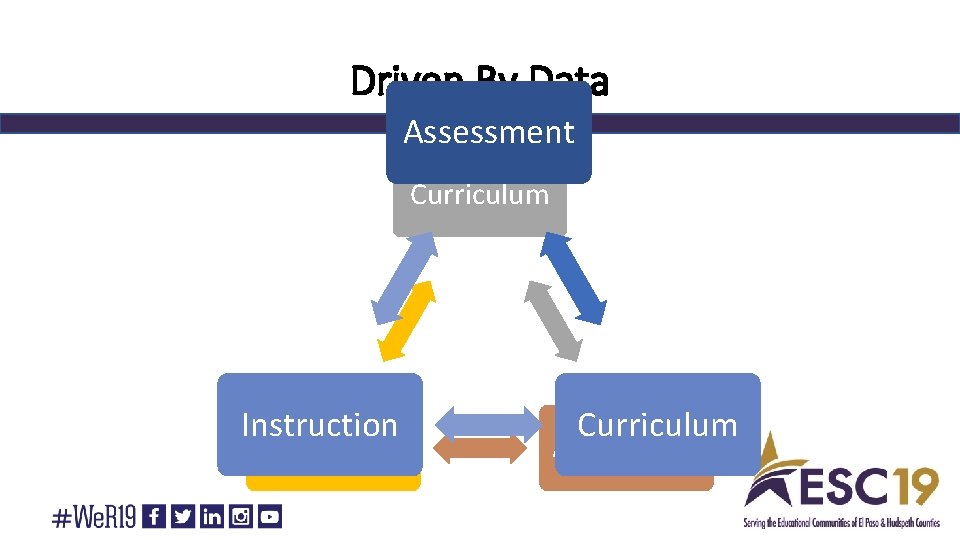
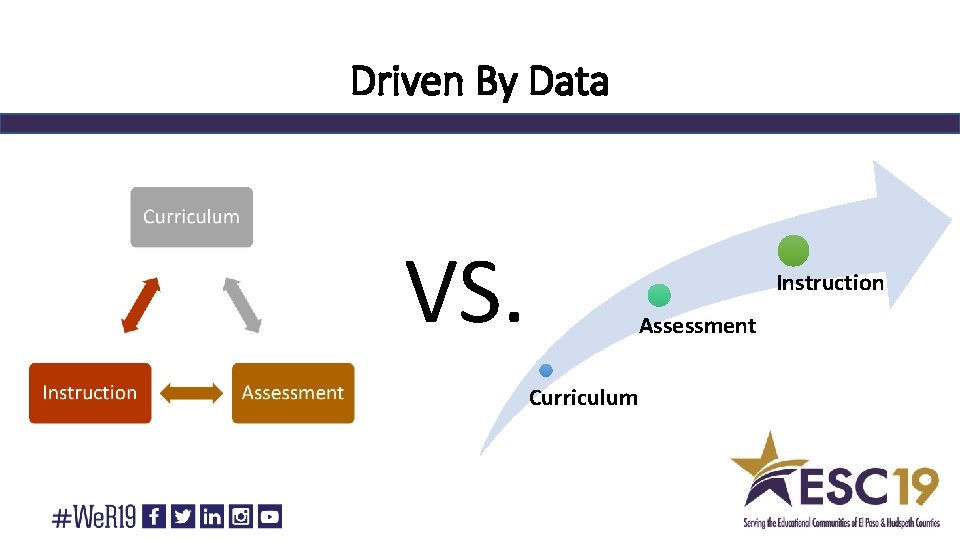
Driven By Data Assessment Curriculum Instruction Curriculum Assessment
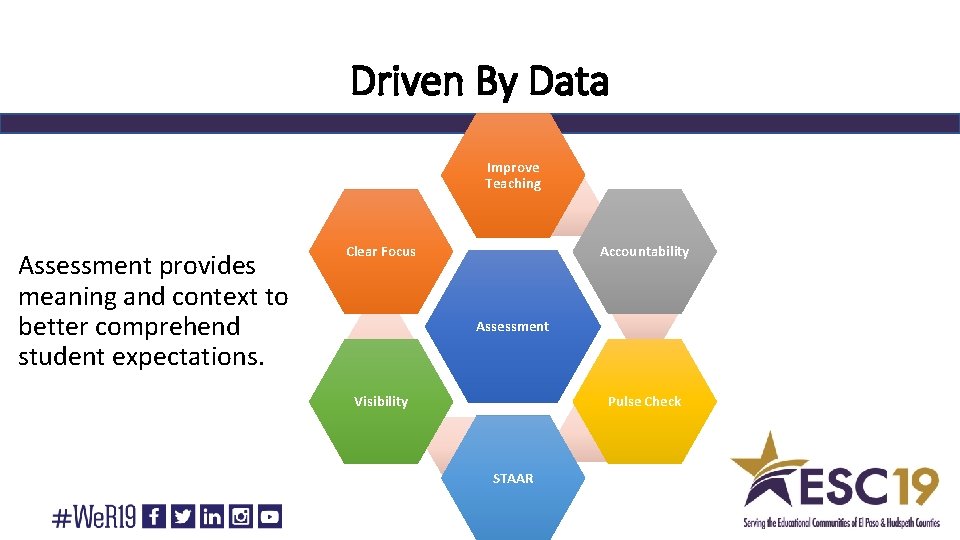
Driven By Data Improve Teaching Assessment provides meaning and context to better comprehend student expectations. Clear Focus Accountability Assessment Pulse Check Visibility STAAR
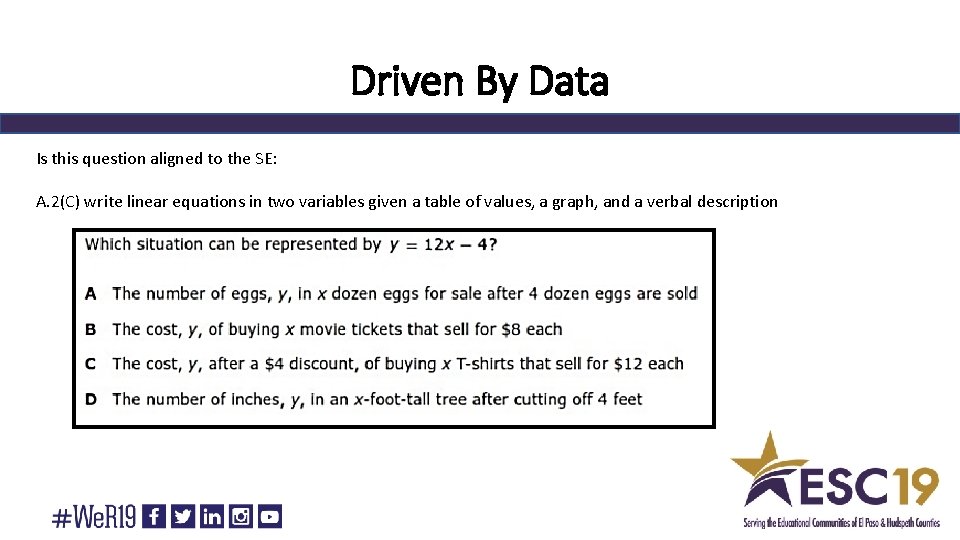
Driven By Data • Creating Quality Assessments • Algebra Example A. 2(C) write linear equations in two variables given a table of values, a graph, and a verbal description What are the 3 C’s of this SE?
Driven By Data Is this question aligned to the SE: A. 2(C) write linear equations in two variables given a table of values, a graph, and a verbal description
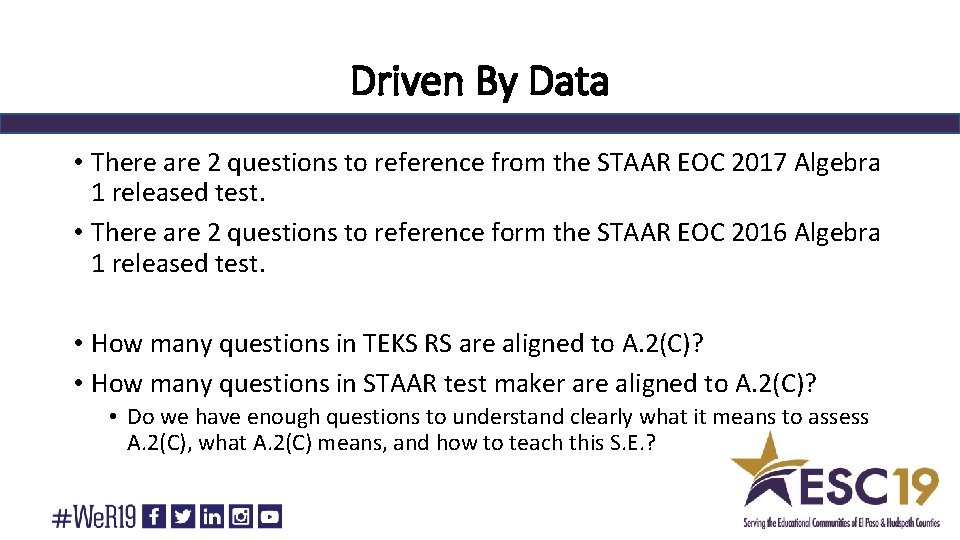
Driven By Data • There are 2 questions to reference from the STAAR EOC 2017 Algebra 1 released test. • There are 2 questions to reference form the STAAR EOC 2016 Algebra 1 released test. • How many questions in TEKS RS are aligned to A. 2(C)? • How many questions in STAAR test maker are aligned to A. 2(C)? • Do we have enough questions to understand clearly what it means to assess A. 2(C), what A. 2(C) means, and how to teach this S. E. ?
Driven By Data VS. Instruction Assessment Curriculum
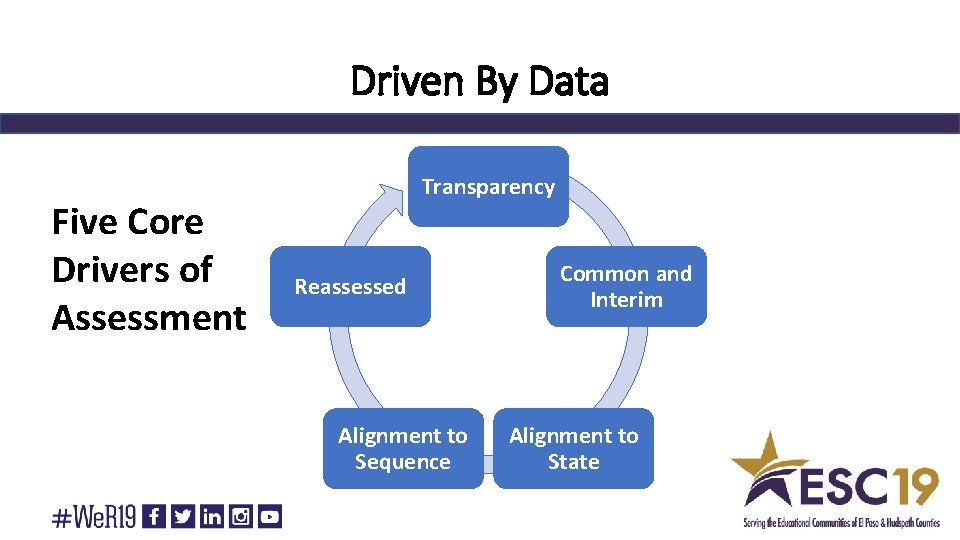
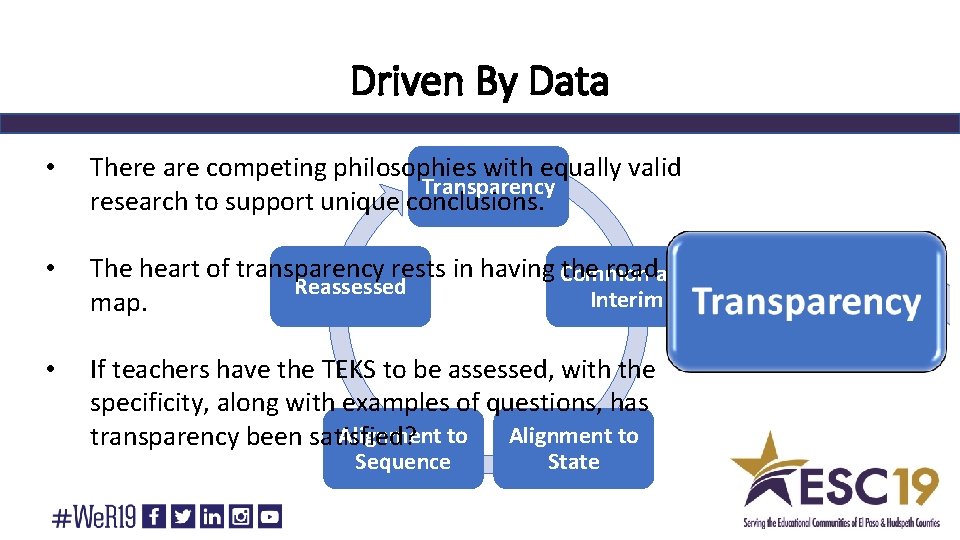
Driven By Data Five Core Drivers of Assessment Transparency Reassessed Alignment to Sequence Common and Interim Alignment to State
Driven By Data • There are competing philosophies with equally valid Transparency research to support unique conclusions. • The heart of transparency rests in having Common the roadand Reassessed Interim map. • If teachers have the TEKS to be assessed, with the specificity, along with examples of questions, has Alignment to transparency been satisfied? Sequence State
Driven By Data • Do your current assessments have the 5 core drivers of assessment as given by Paul Bambrick-Santoyo? • If yes, how will you empower you campus to continue the practice? • If no, what changes will you make to your assessment process and how will this me accomplished?
Driven By Data How do you analyze data from the assessments you administer? Do you have a structured process and practice? Are all stakeholders comfortable with this process?
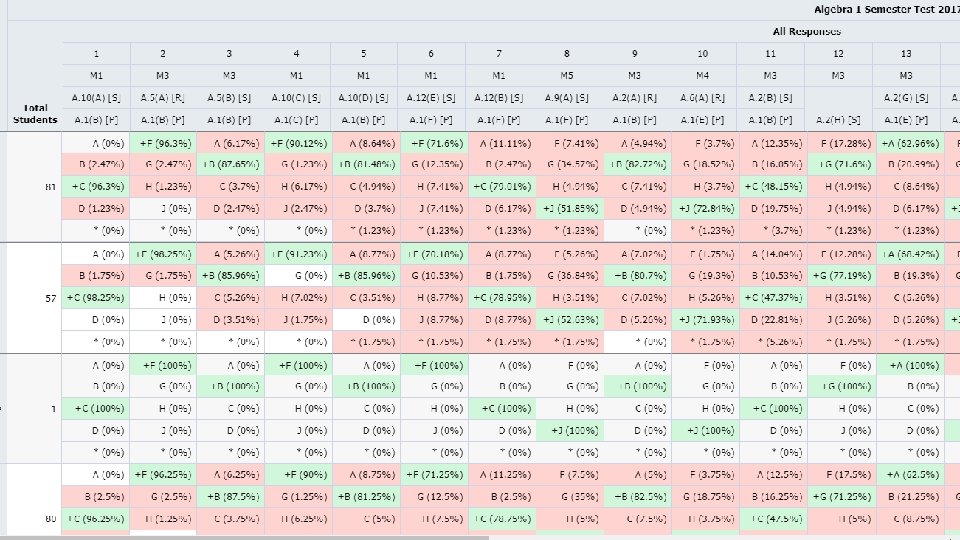
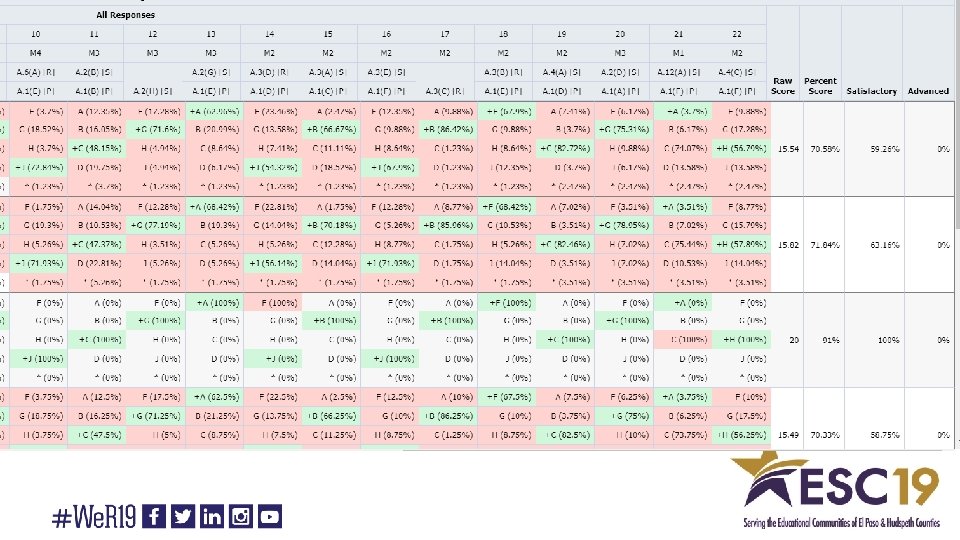
Driven By Data • Make the data easy to comprehensible • • • One pager Individual response with student expectation Considerate of the user Complete Sorting or color schemes • Let’s look at a sample report.
Driven By Data
Driven By Data • Why do we look at data? • • • Identify strengths and weaknesses Student needs Teacher needs Adjust instruction Plan intervention
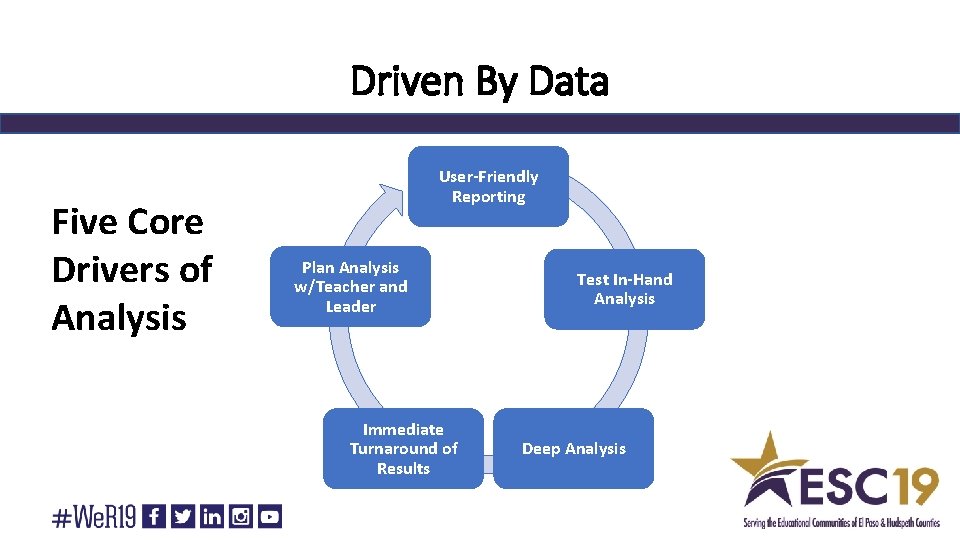
Driven By Data Five Core Drivers of Analysis User-Friendly Reporting Plan Analysis w/Teacher and Leader Immediate Turnaround of Results Test In-Hand Analysis Deep Analysis
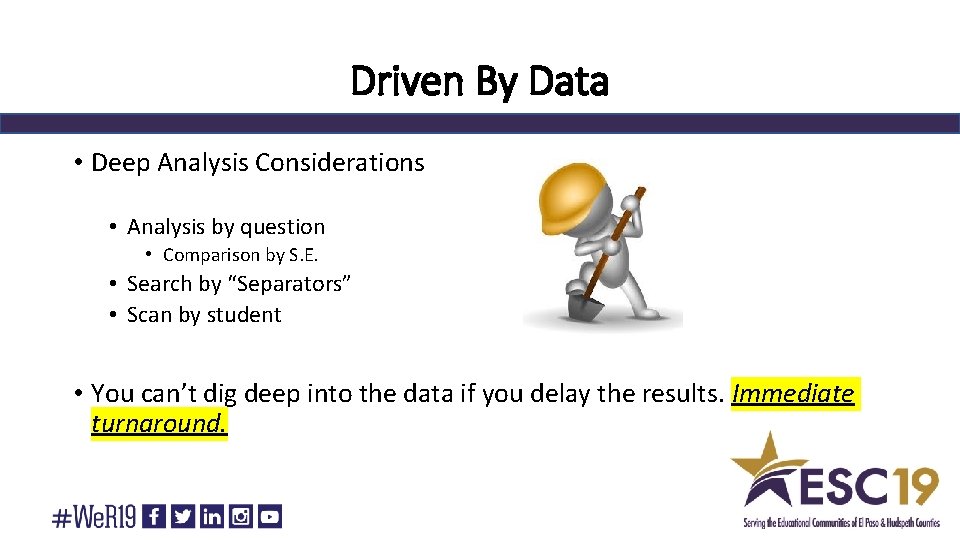
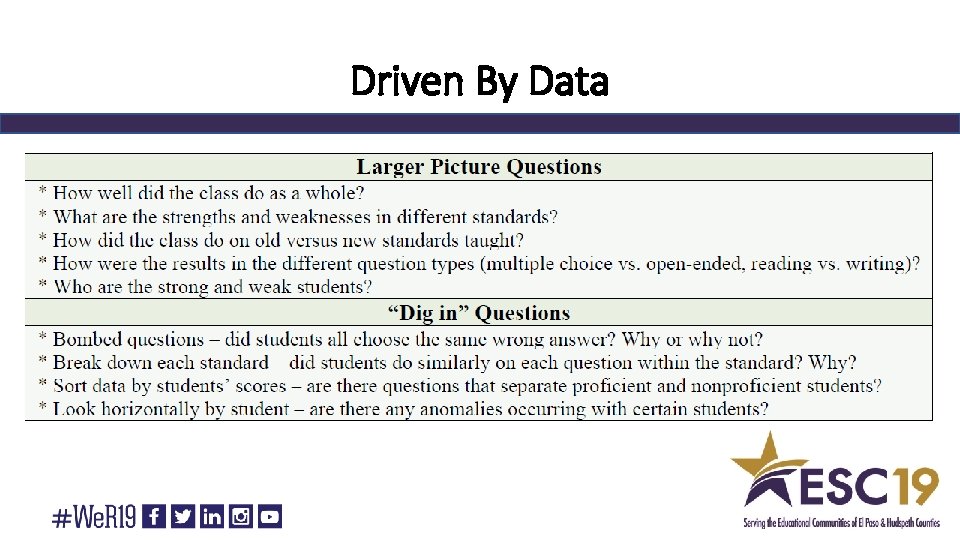
Driven By Data • Deep Analysis Considerations • Analysis by question • Comparison by S. E. • Search by “Separators” • Scan by student • You can’t dig deep into the data if you delay the results. Immediate turnaround.
Driven By Data
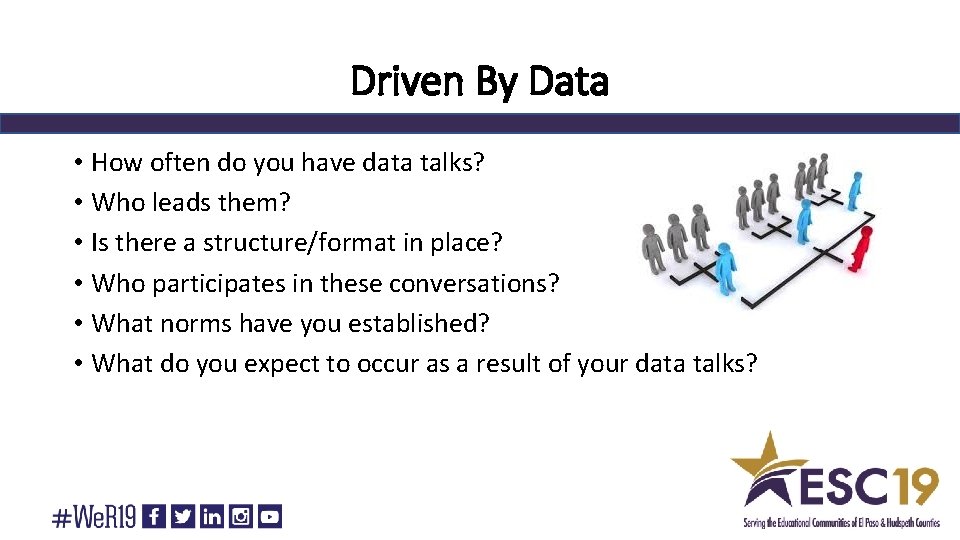
Driven By Data • How often do you have data talks? • Who leads them? • Is there a structure/format in place? • Who participates in these conversations? • What norms have you established? • What do you expect to occur as a result of your data talks?
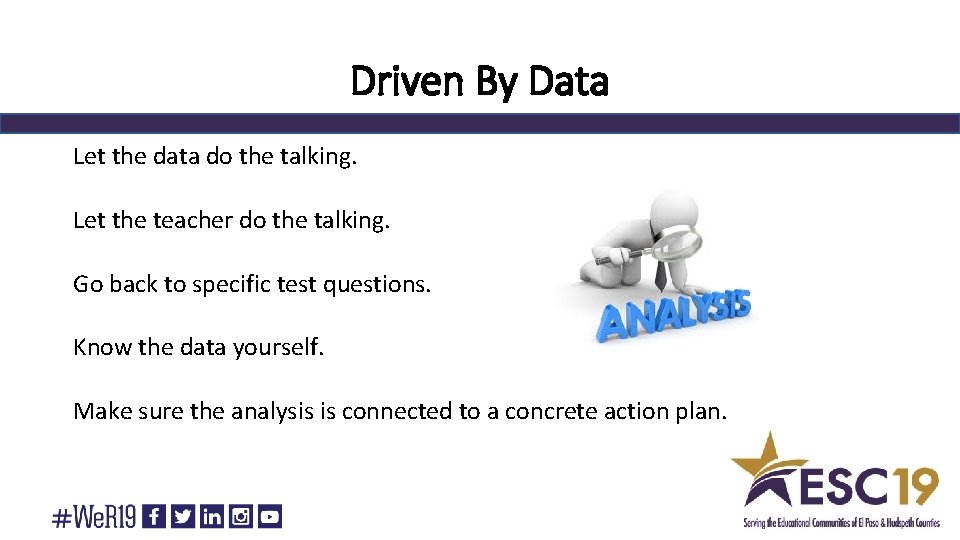
Driven By Data Let the data do the talking. Let the teacher do the talking. Go back to specific test questions. Know the data yourself. Make sure the analysis is connected to a concrete action plan.
Driven By Data • As a team, examine your current data analysis protocol. • What are some glows? • Where can you grow? • How effective is your current data analysis protocol? • Write out your data analysis protocol with any appropriate revisions. • Include key dates and action steps moving forward to hold yourself accountable for implementing these steps.
Driven By Data After analyzing data, what do you and your teachers do with the information you have just learned? Analysis without action makes the data driven process worthless.
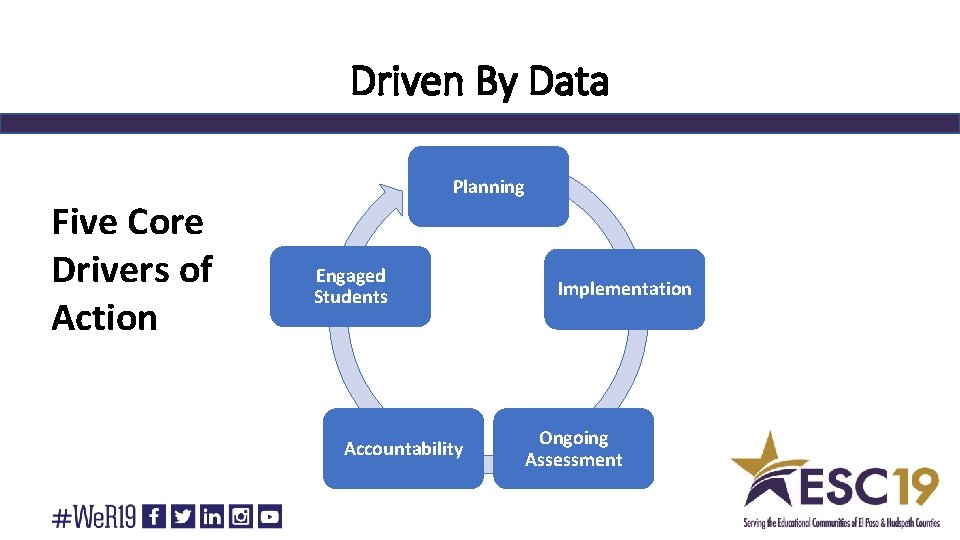
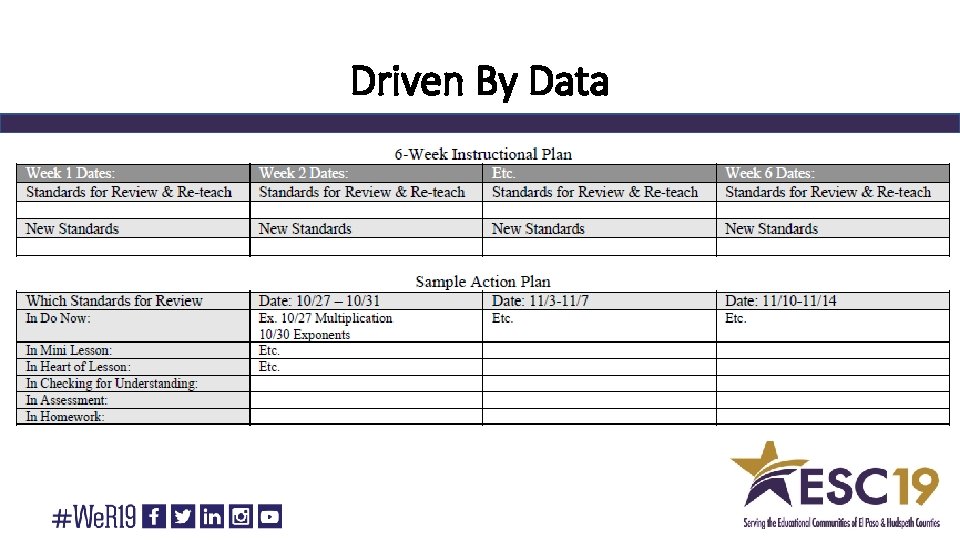
Driven By Data Five Core Drivers of Action Planning Engaged Students Accountability Implementation Ongoing Assessment
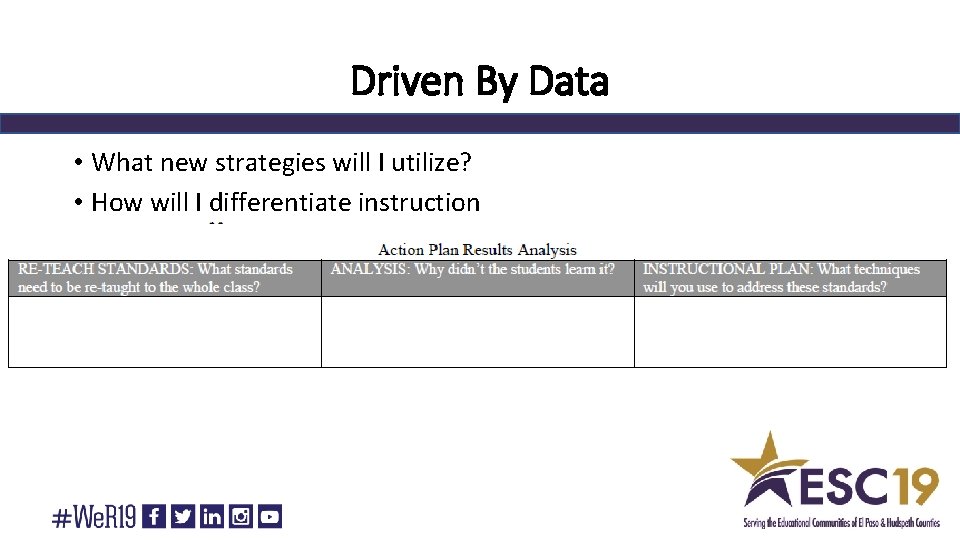
Driven By Data • What new strategies will I utilize? • How will I differentiate instruction
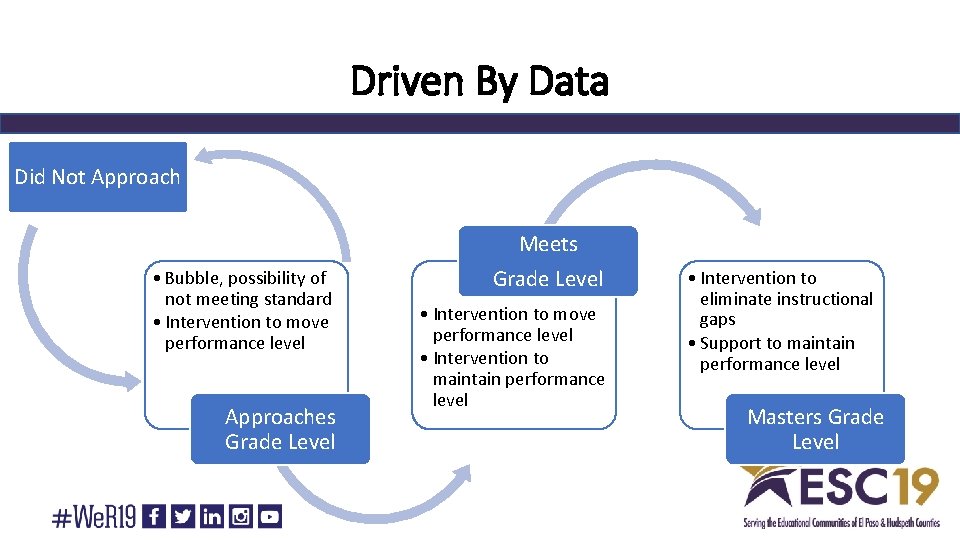
Driven By Data Did Not Approach Meets • Bubble, possibility of not meeting standard • Intervention to move performance level Approaches Grade Level • Intervention to move performance level • Intervention to maintain performance level • Intervention to eliminate instructional gaps • Support to maintain performance level Masters Grade Level
Driven By Data
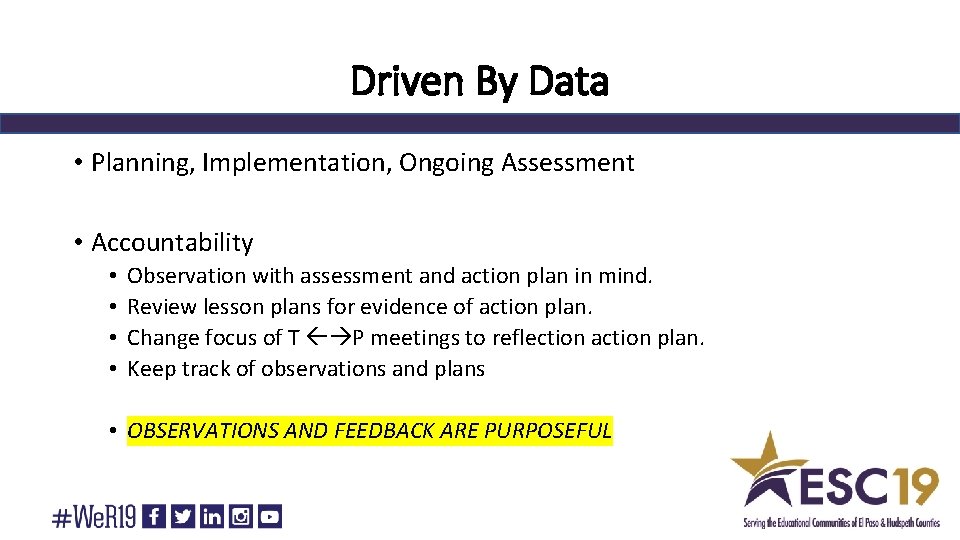
Driven By Data • Planning, Implementation, Ongoing Assessment • Accountability • • Observation with assessment and action plan in mind. Review lesson plans for evidence of action plan. Change focus of T P meetings to reflection action plan. Keep track of observations and plans • OBSERVATIONS AND FEEDBACK ARE PURPOSEFUL
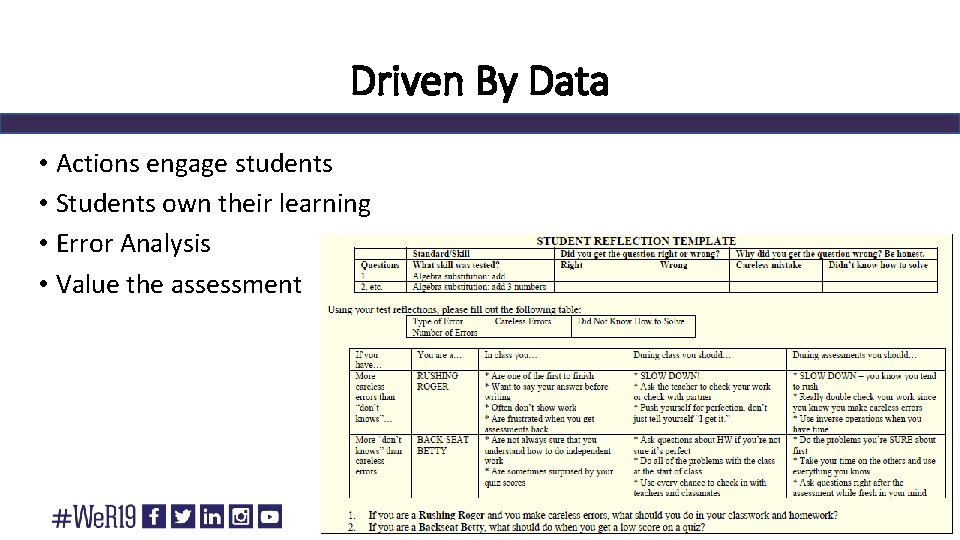
Driven By Data • Actions engage students • Students own their learning • Error Analysis • Value the assessment
Driven By Data Do teachers understand the value of being driven by data? If you were to leave the campus as a result of a large promotion, would teachers continue use of data to improve instruction and student performance?
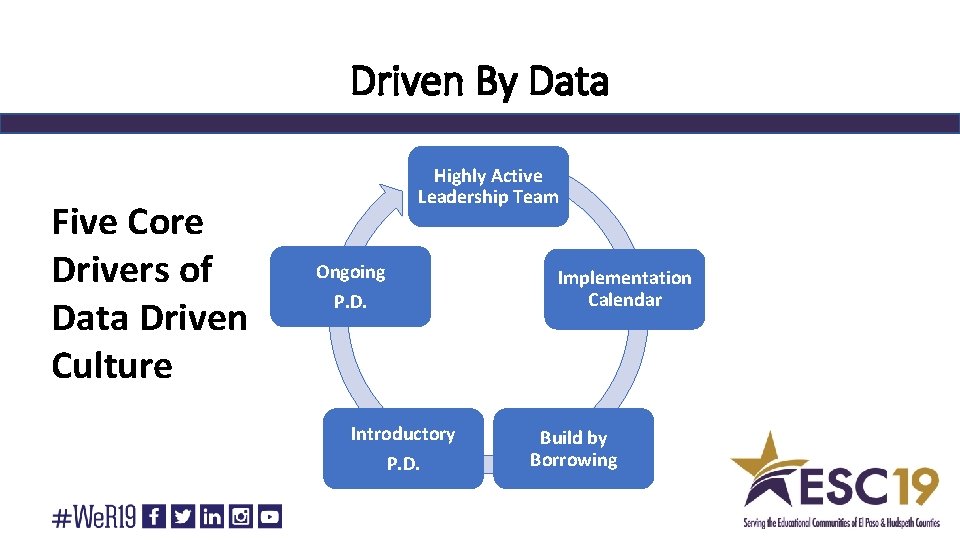
Driven By Data Five Core Drivers of Data Driven Culture Highly Active Leadership Team Ongoing Implementation Calendar P. D. Introductory P. D. Build by Borrowing
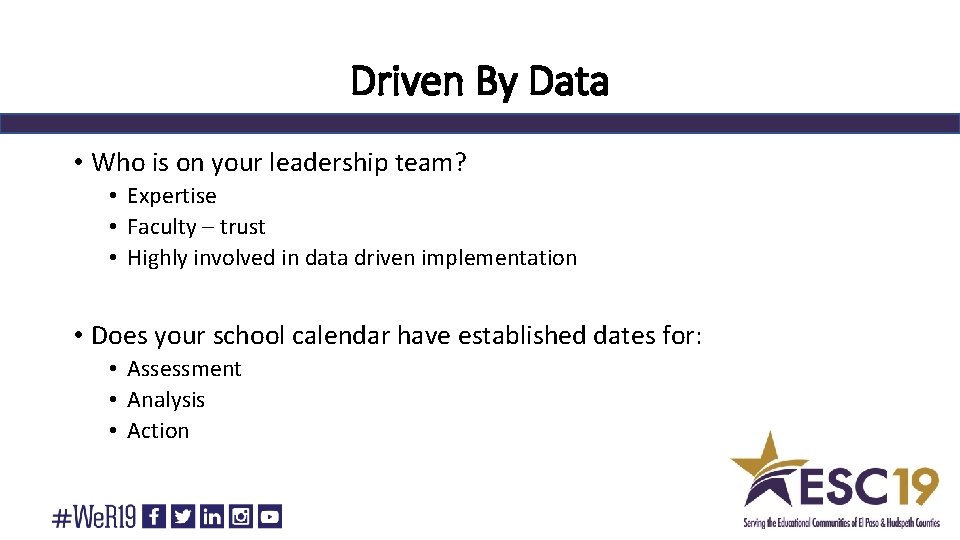
Driven By Data • Who is on your leadership team? • Expertise • Faculty – trust • Highly involved in data driven implementation • Does your school calendar have established dates for: • Assessment • Analysis • Action
Driven By Data • Building by borrowing: • Have you identified high performance strategies and borrowed from others? • As a campus teams, do we share strategies and resources? • Do we make excuses about the students or try new strategies for student success? • Introductory and Ongoing P. D. • How do we ask for P. D. ? • Are we attending what we need? • Do we apply P. D. received?
Driven By Data • About P. D. • Effective P. D. must include: • • Activities Reflection Framing Application • Is this a norm at your campus? • How do you follow-up or monitor implementation of P. D. attended by teachers? • What one action item will you commit to regarding P. D. after our session?
Driven By Data • Where is your campus? • Phase 1: Confusion and overload – “This is too much!” • Phase 2: Feeling inadequate and distrustful – “How can 2 questions on a test possibly establish mastery of an objective? ” • Phase 3: Challenging the test – “That is a poor question. Answer “B: is a trick answer. ” • Phase 4: Examining the results objectively and looking for causes – “Which students need extra help and what topics need re-teaching? ” • Phase 5: Accepting the data as useful information, seeking solutions, and modifying instruction.
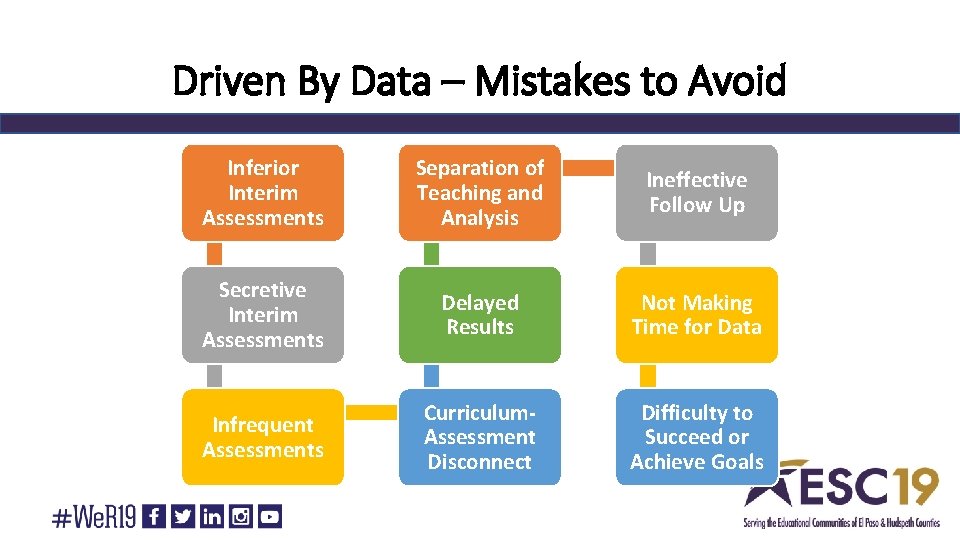
Driven By Data – Mistakes to Avoid Inferior Interim Assessments Separation of Teaching and Analysis Ineffective Follow Up Secretive Interim Assessments Delayed Results Not Making Time for Data Infrequent Assessments Curriculum. Assessment Disconnect Difficulty to Succeed or Achieve Goals
Analyzing Local Data • Time to pull your most recent local data for analysis. • Use the analysis process shared in this presentation to dialogue and dig deep into the results. • Create an action plan you will implement with your campus. • Determine your next steps for re-assessing and analyzing results.
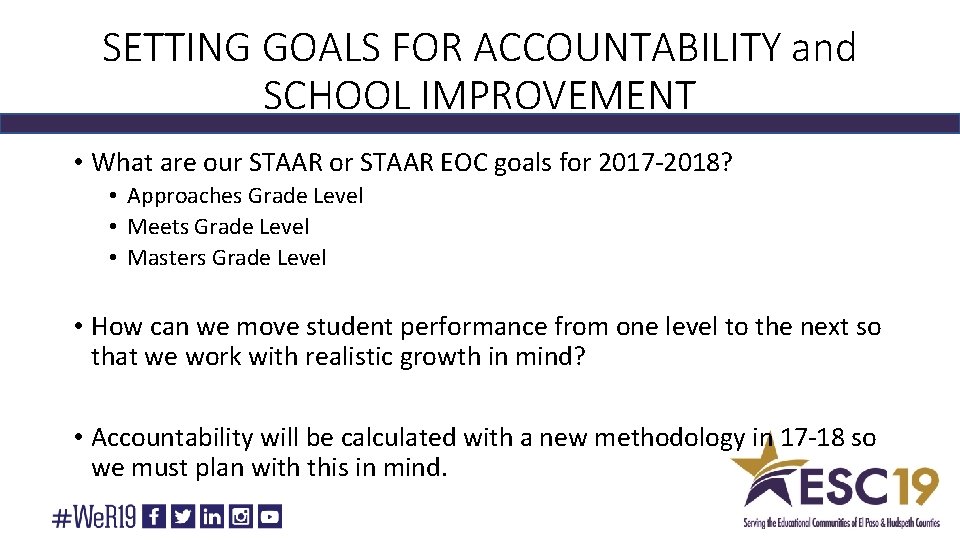
SETTING GOALS FOR ACCOUNTABILITY and SCHOOL IMPROVEMENT • What are our STAAR or STAAR EOC goals for 2017 -2018? • Approaches Grade Level • Meets Grade Level • Masters Grade Level • How can we move student performance from one level to the next so that we work with realistic growth in mind? • Accountability will be calculated with a new methodology in 17 -18 so we must plan with this in mind.
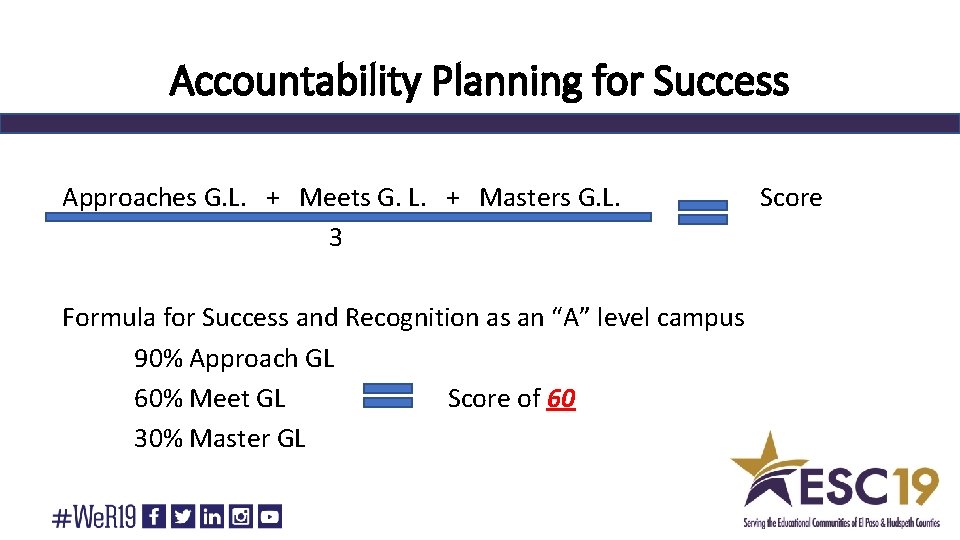
Accountability Planning for Success Approaches G. L. + Meets G. L. + Masters G. L. 3 Formula for Success and Recognition as an “A” level campus 90% Approach GL 60% Meet GL Score of 60 30% Master GL Score
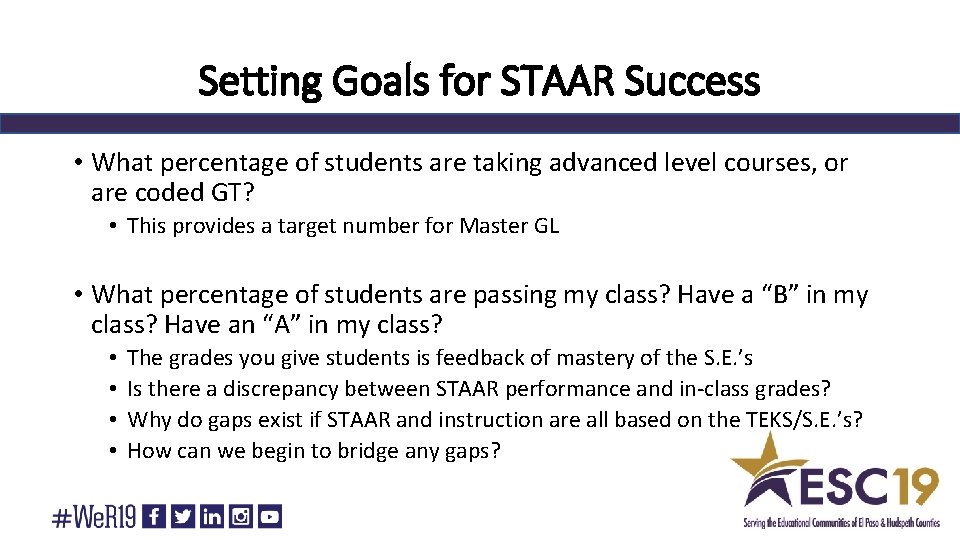
Setting Goals for STAAR Success • What percentage of students are taking advanced level courses, or are coded GT? • This provides a target number for Master GL • What percentage of students are passing my class? Have a “B” in my class? Have an “A” in my class? • • The grades you give students is feedback of mastery of the S. E. ’s Is there a discrepancy between STAAR performance and in-class grades? Why do gaps exist if STAAR and instruction are all based on the TEKS/S. E. ’s? How can we begin to bridge any gaps?
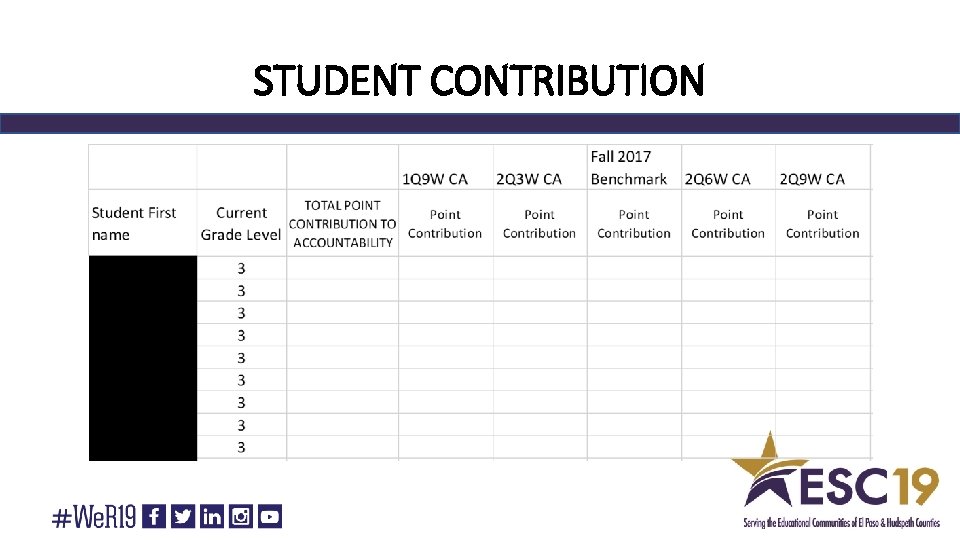
STUDENT CONTRIBUTION
Data Reality • TEA values our work and is committed to supporting educators. • Our efforts must show up in the form of numbers. • School Improvement is about evidence and letting the data tell the story. • We must now commit to maximizing student potential.
Driven By Data • Please write when you would like our next DDD for SI training. • We will use the Driven by Data framework to analyze STAAR 2018 results. • We will develop action plans from the STAAR 2018 exams for the 2018 -2019 school year, CIP, etc. • We will evaluate our progress towards meeting 2017 -2018 goals and what the next steps should be.
Driven By Data Glenn Nathan ESC – Region 19 ganathan@esc 19. net 915. 780. 6517