
BENEFITS OF FAMILY WORSHIP Dr Pat Fagan Senior

BENEFITS OF FAMILY WORSHIP Dr. Pat Fagan Senior Fellow and Director Marriage and Religion Research Institute, FRC

Education
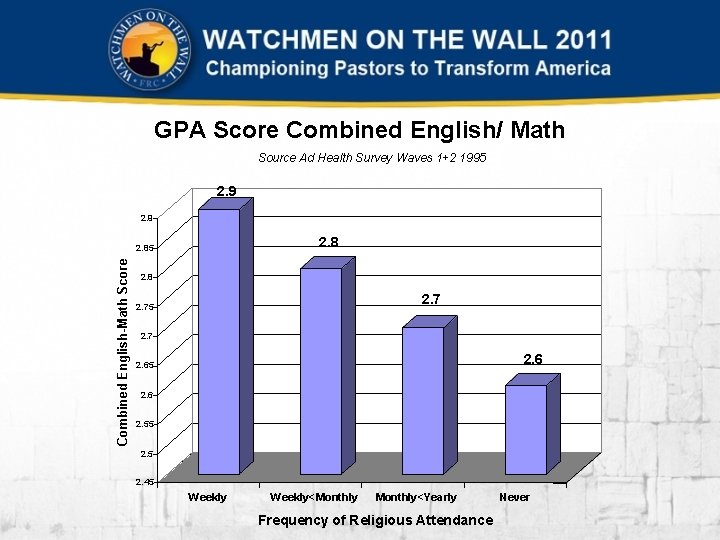
GPA Score Combined English/ Math Source Ad Health Survey Waves 1+2 1995 2. 9 2. 8 Combined English-Math Score 2. 85 2. 8 2. 75 2. 7 2. 65 2. 6 2. 55 2. 45 Weekly<Monthly<Yearly Frequency of Religious Attendance Never
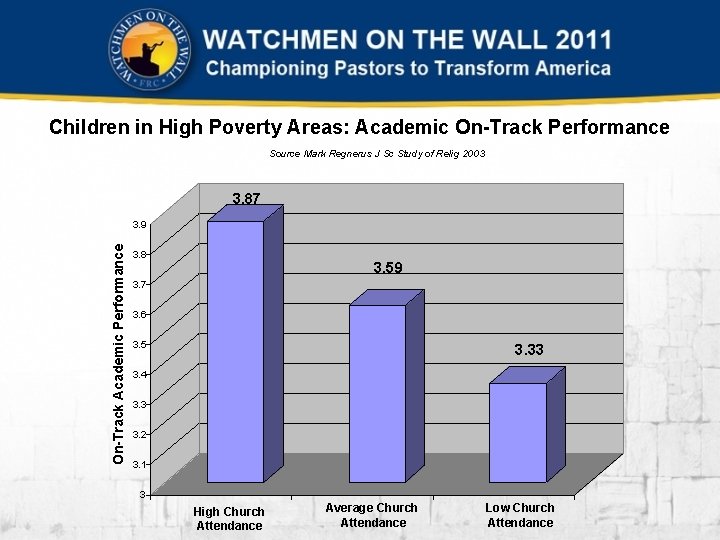
Children in High Poverty Areas: Academic On-Track Performance Source Mark Regnerus J Sc Study of Relig 2003 3. 87 On-Track Academic Performance 3. 9 3. 8 3. 59 3. 7 3. 6 3. 5 3. 33 3. 4 3. 3 3. 2 3. 1 3 High Church Attendance Average Church Attendance Low Church Attendance
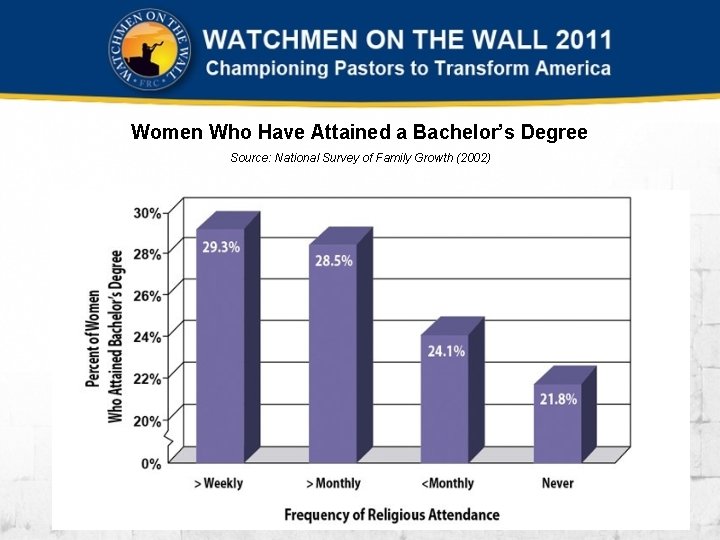
Women Who Have Attained a Bachelor’s Degree Source: National Survey of Family Growth (2002)
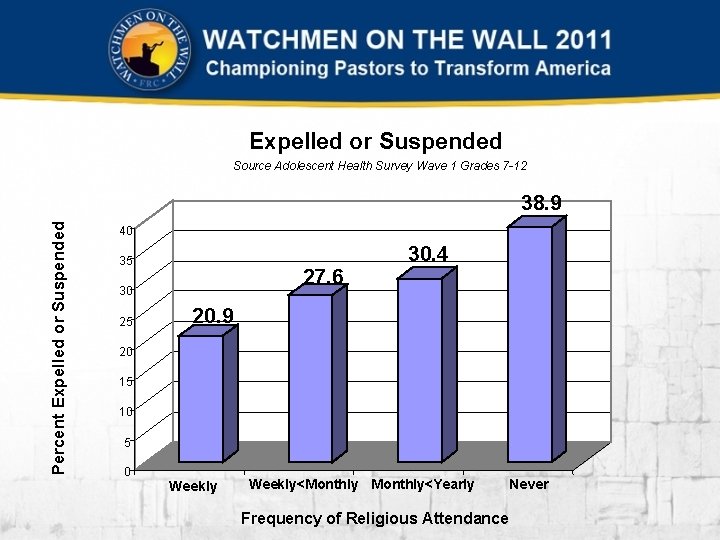
Expelled or Suspended Source Adolescent Health Survey Wave 1 Grades 7 -12 Percent Expelled or Suspended 38. 9 40 35 27. 6 30 25 30. 4 20. 9 20 15 10 5 0 Weekly<Monthly<Yearly Frequency of Religious Attendance Never

Violence and Crime
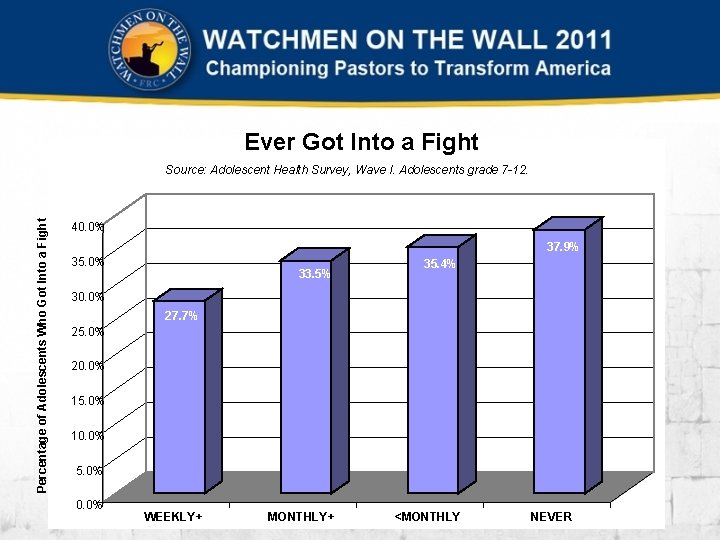
Ever Got Into a Fight Percentage of Adolescents Who Got Into a Fight Source: Adolescent Health Survey, Wave I. Adolescents grade 7 -12. 40. 0% 37. 9% 35. 0% 33. 5% 35. 4% 30. 0% 27. 7% 25. 0% 20. 0% 15. 0% 10. 0% 5. 0% 0. 0% WEEKLY+ MONTHLY+ <MONTHLY NEVER
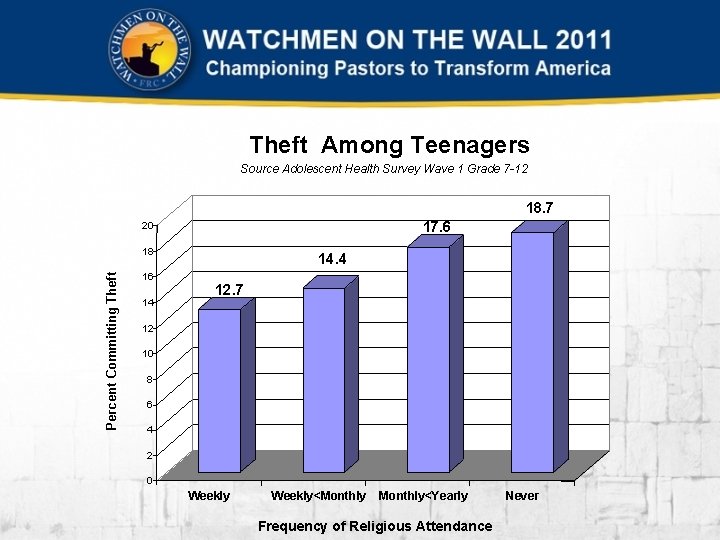
Theft Among Teenagers Source Adolescent Health Survey Wave 1 Grade 7 -12 18. 7 17. 6 20 Percent Committing Theft 18 16 14 14. 4 12. 7 12 10 8 6 4 2 0 Weekly<Monthly<Yearly Frequency of Religious Attendance Never
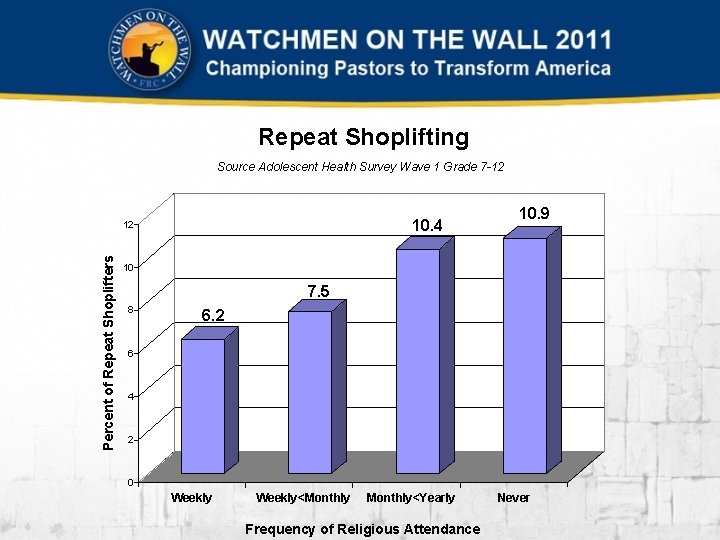
Repeat Shoplifting Source Adolescent Health Survey Wave 1 Grade 7 -12 10. 4 Percent of Repeat Shoplifters 12 10. 9 10 7. 5 8 6. 2 6 4 2 0 Weekly<Monthly<Yearly Frequency of Religious Attendance Never
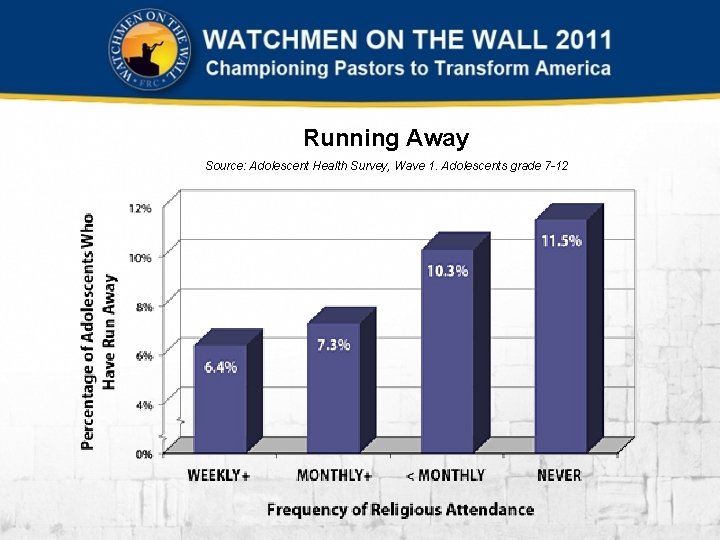
Running Away Source: Adolescent Health Survey, Wave 1. Adolescents grade 7 -12
Drugs and Alcohol Abuse
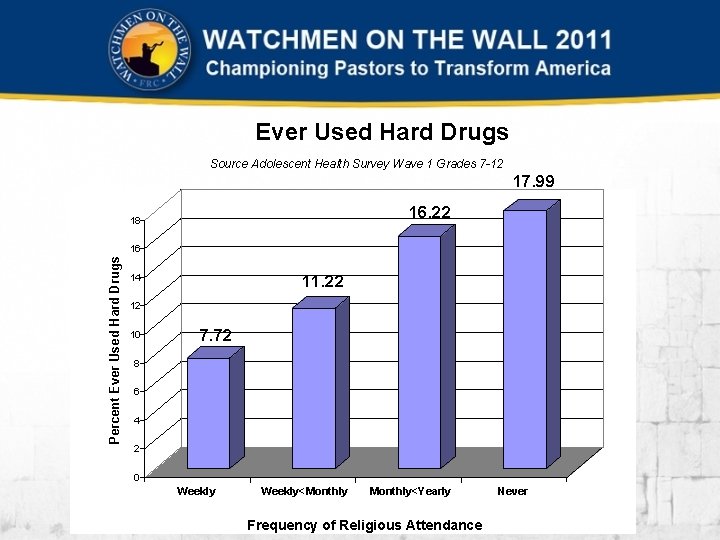
Ever Used Hard Drugs Source Adolescent Health Survey Wave 1 Grades 7 -12 17. 99 16. 22 18 Percent Ever Used Hard Drugs 16 11. 22 14 12 10 7. 72 8 6 4 2 0 Weekly<Monthly<Yearly Frequency of Religious Attendance Never
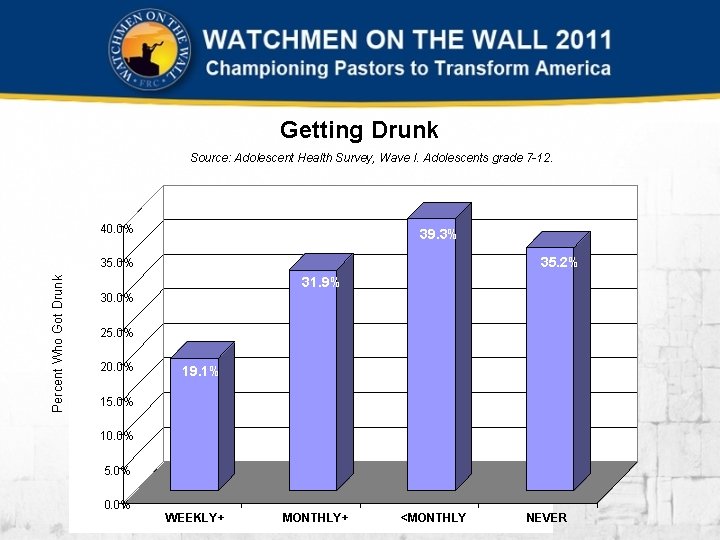
Getting Drunk Source: Adolescent Health Survey, Wave I. Adolescents grade 7 -12. 40. 0% 39. 3% 35. 2% Percent Who Got Drunk 35. 0% 31. 9% 30. 0% 25. 0% 20. 0% 19. 1% 15. 0% 10. 0% 5. 0% 0. 0% WEEKLY+ MONTHLY+ <MONTHLY NEVER
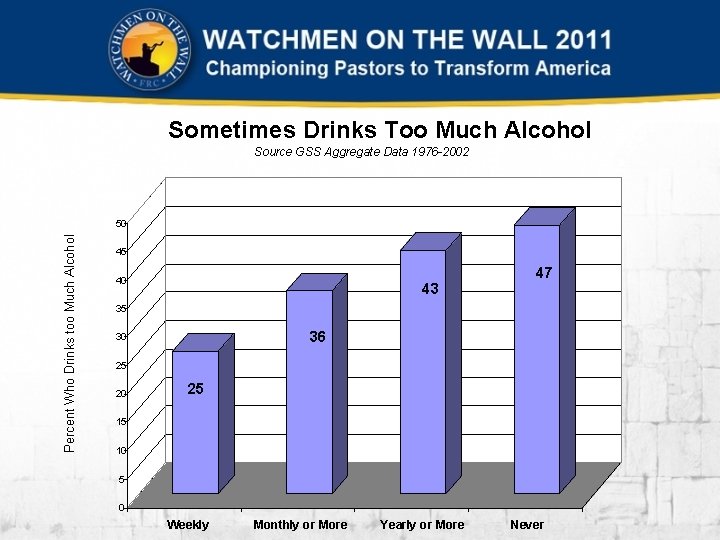
Sometimes Drinks Too Much Alcohol Source GSS Aggregate Data 1976 -2002 Percent Who Drinks too Much Alcohol 50 45 40 43 47 35 36 30 25 20 25 15 10 5 0 Weekly Monthly or More Yearly or More Never

MARRIAGE AND FAMILY
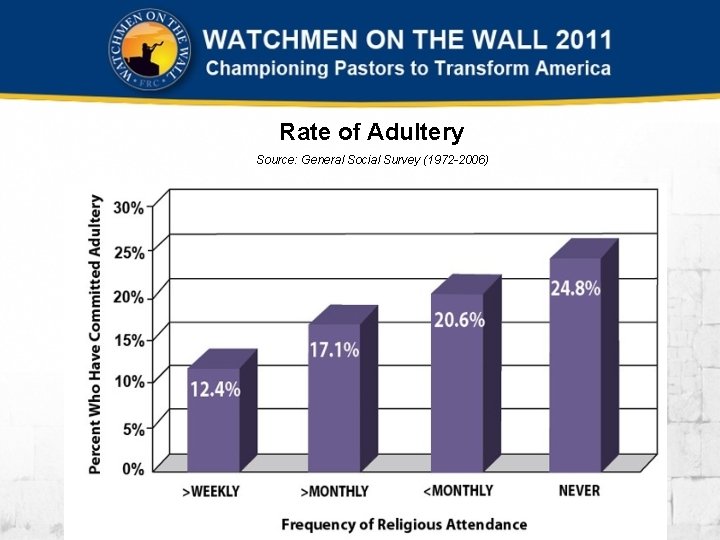
Rate of Adultery Source: General Social Survey (1972 -2006)
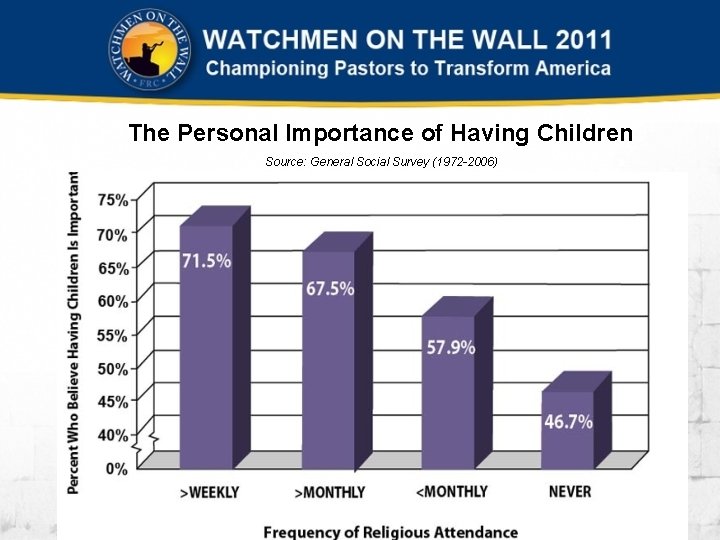
The Personal Importance of Having Children Source: General Social Survey (1972 -2006)
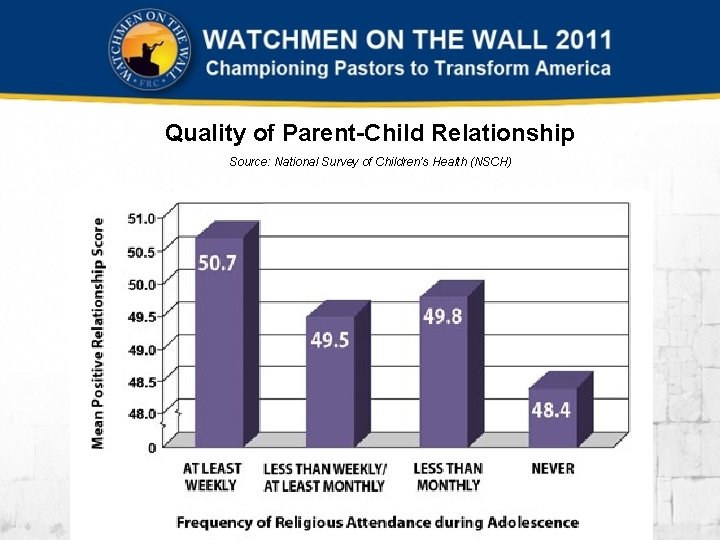
Quality of Parent-Child Relationship Source: National Survey of Children’s Health (NSCH)
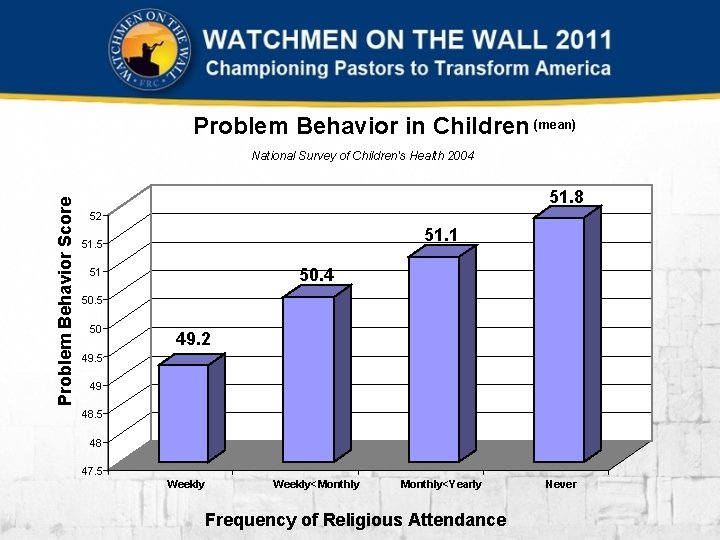
Problem Behavior in Children (mean) Problem Behavior Score National Survey of Children's Health 2004 51. 8 52 51. 1 51. 5 50. 4 51 50. 5 50 49. 2 49. 5 49 48. 5 48 47. 5 Weekly<Monthly<Yearly Frequency of Religious Attendance Never
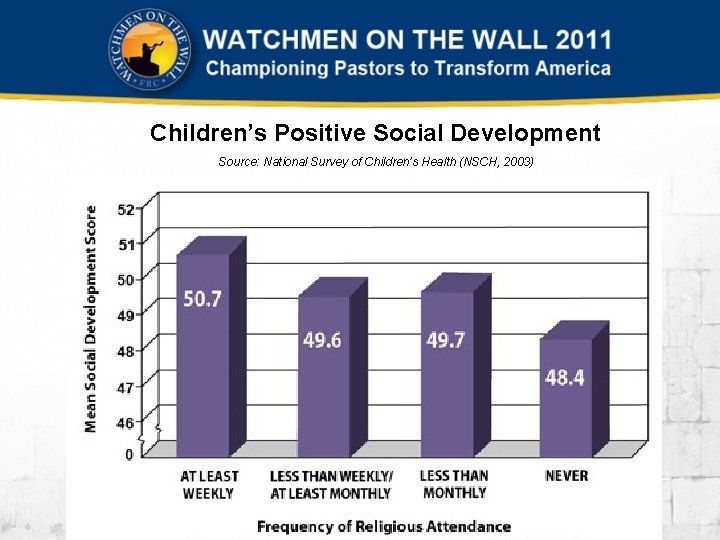
Children’s Positive Social Development Source: National Survey of Children’s Health (NSCH, 2003)

Sexuality
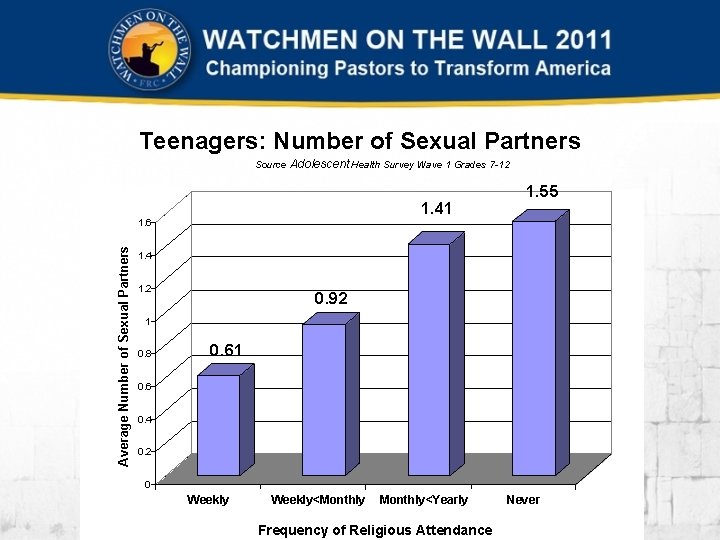
Teenagers: Number of Sexual Partners Source Adolescent Health Survey Wave 1 Grades 7 -12 1. 41 1. 55 Average Number of Sexual Partners 1. 6 1. 4 1. 2 0. 92 1 0. 8 0. 61 0. 6 0. 4 0. 2 0 Weekly<Monthly<Yearly Frequency of Religious Attendance Never
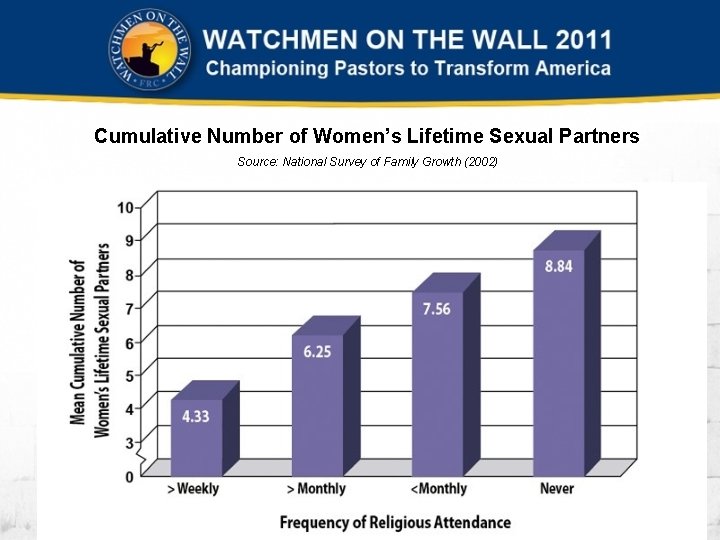
Cumulative Number of Women’s Lifetime Sexual Partners Source: National Survey of Family Growth (2002)
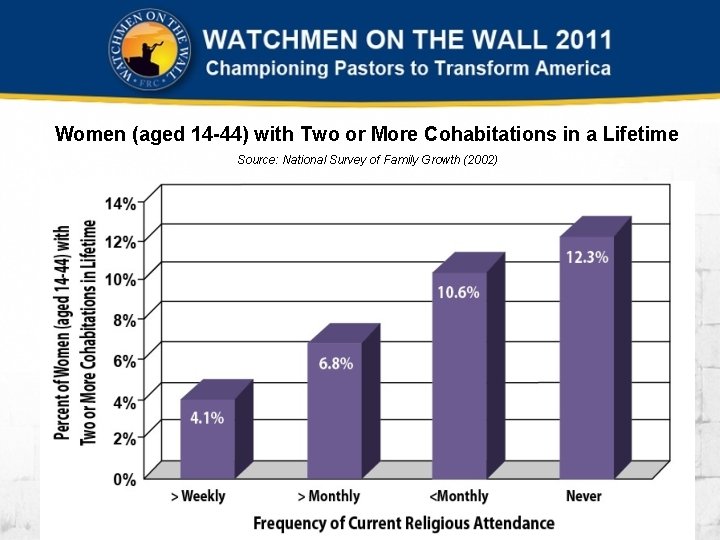
Women (aged 14 -44) with Two or More Cohabitations in a Lifetime Source: National Survey of Family Growth (2002)

Community
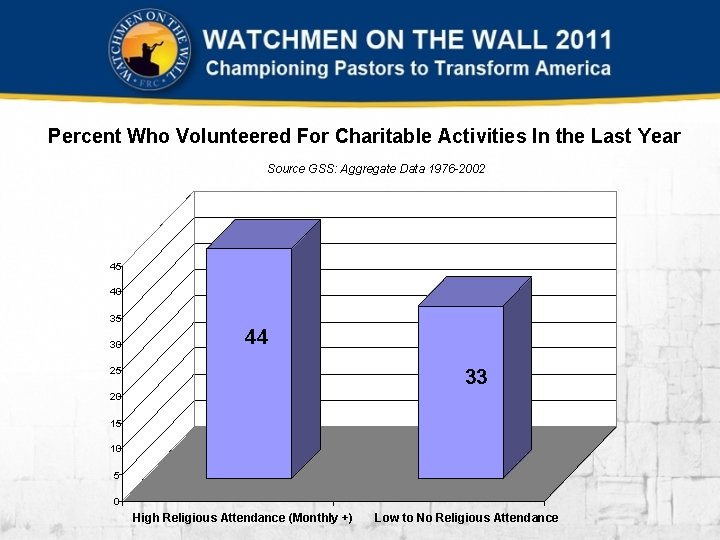
Percent Who Volunteered For Charitable Activities In the Last Year Source GSS: Aggregate Data 1976 -2002 45 40 35 30 44 33 25 20 15 10 5 0 High Religious Attendance (Monthly +) Low to No Religious Attendance
- Slides: 27