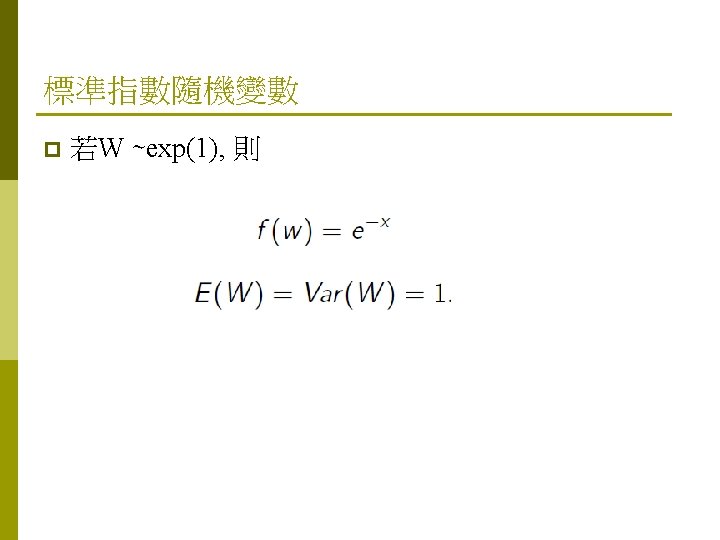
invariance under positive scaling W exp1 p X





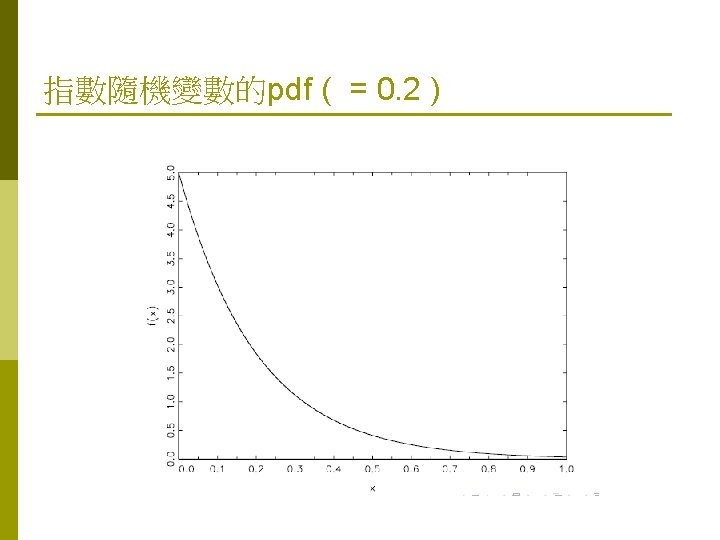






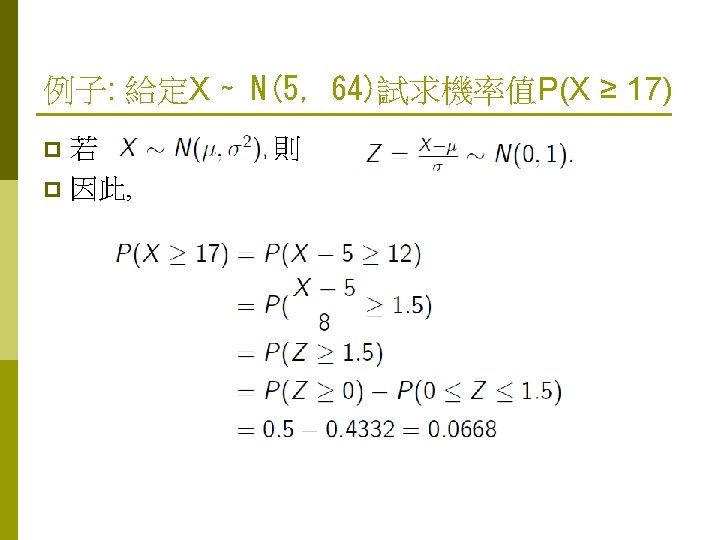
- Slides: 63
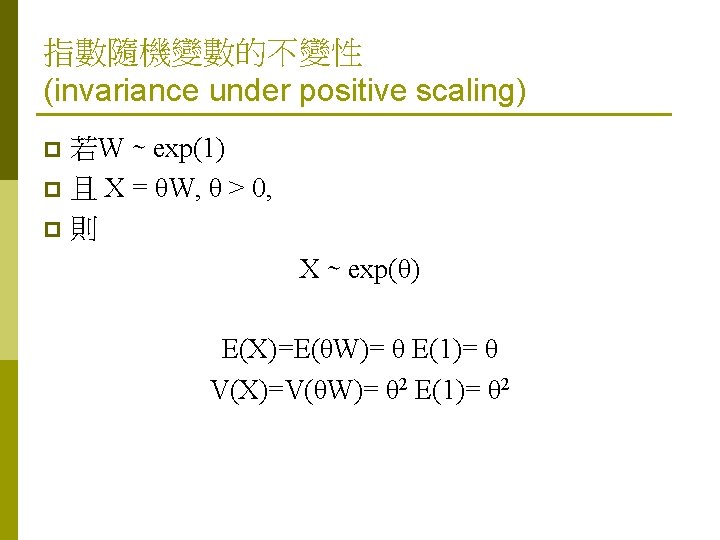
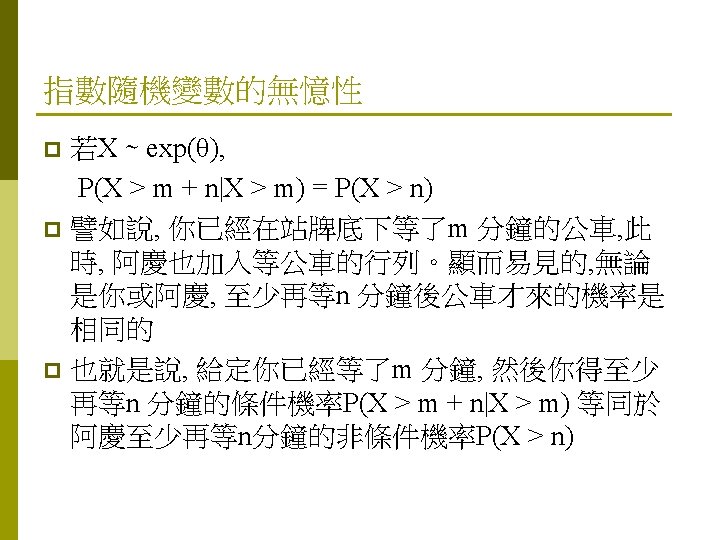
指數隨機變數的不變性 (invariance under positive scaling) 若W ∼ exp(1) p 且 X = θW, θ > 0, p則 p X ∼ exp(θ) E(X)=E(θW)= θ E(1)= θ V(X)=V(θW)= θ 2 E(1)= θ 2
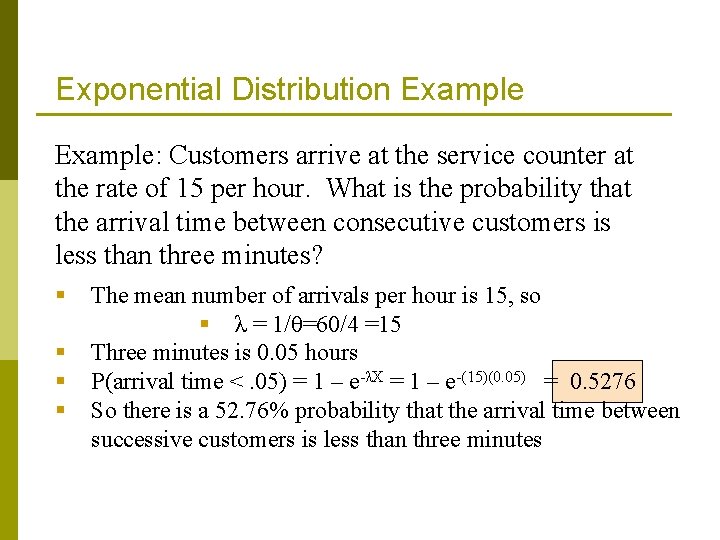
Exponential Distribution Example: Customers arrive at the service counter at the rate of 15 per hour. What is the probability that the arrival time between consecutive customers is less than three minutes? § § The mean number of arrivals per hour is 15, so § λ = 1/θ=60/4 =15 Three minutes is 0. 05 hours P(arrival time <. 05) = 1 – e-λX = 1 – e-(15)(0. 05) = 0. 5276 So there is a 52. 76% probability that the arrival time between successive customers is less than three minutes
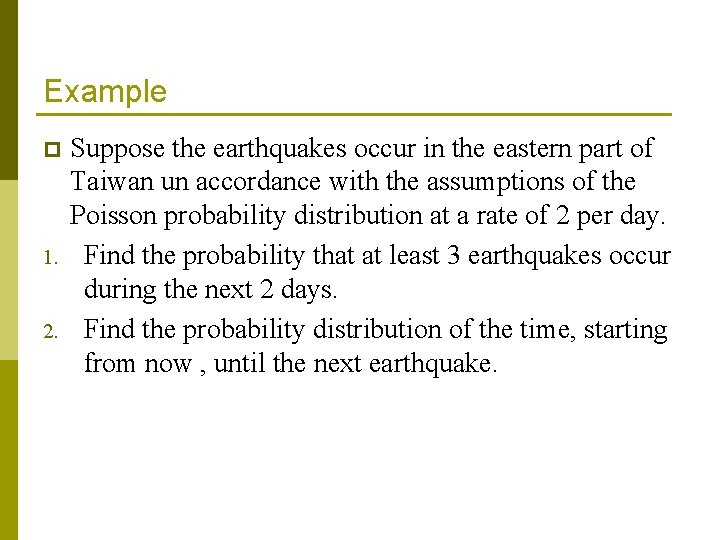
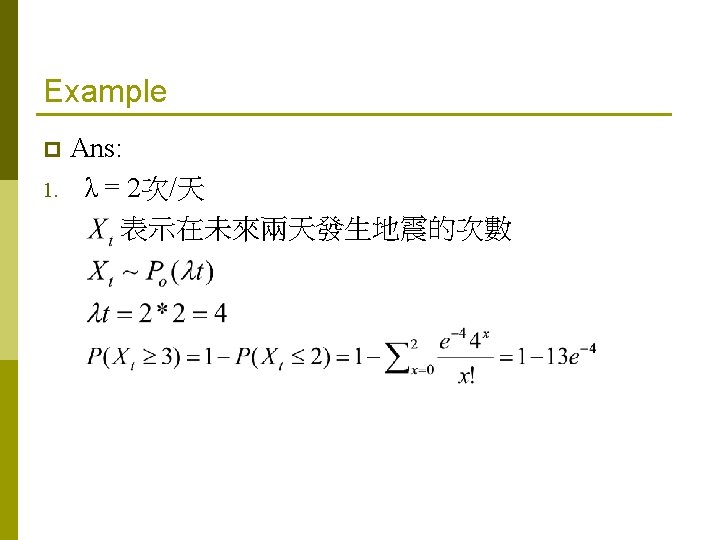
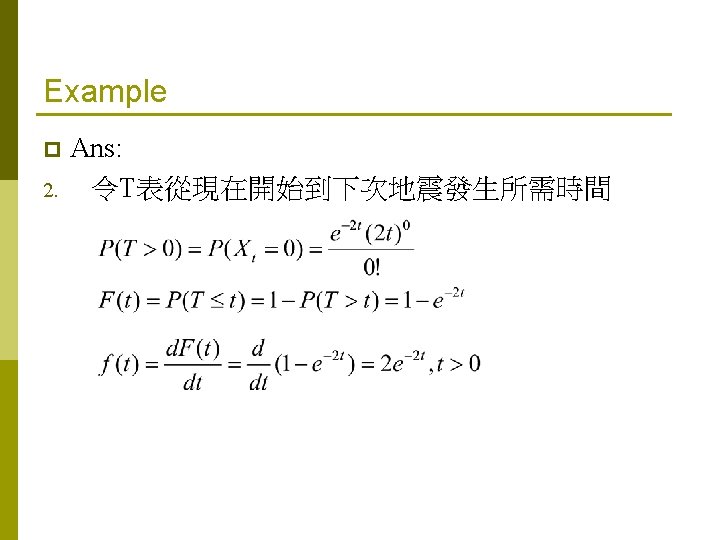
Example p 1. 2. Suppose the earthquakes occur in the eastern part of Taiwan un accordance with the assumptions of the Poisson probability distribution at a rate of 2 per day. Find the probability that at least 3 earthquakes occur during the next 2 days. Find the probability distribution of the time, starting from now , until the next earthquake.
Johann Carl Friedrich Gauss (1777– 1855)
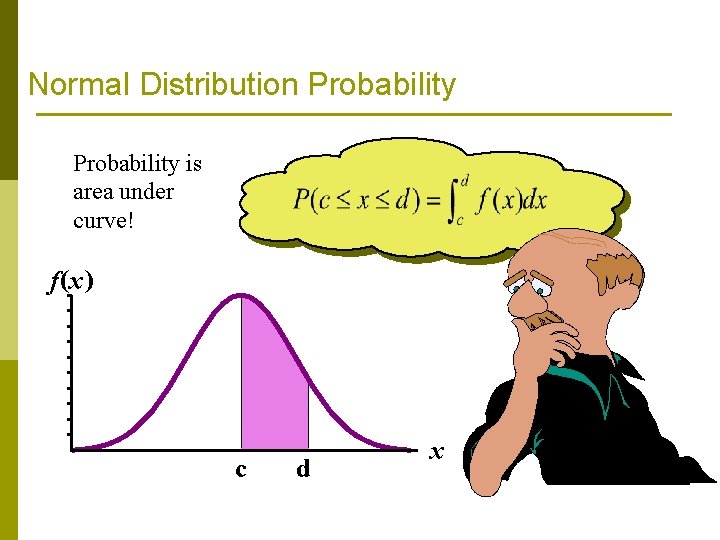
Normal Distribution Probability is area under curve! f(x) c d x
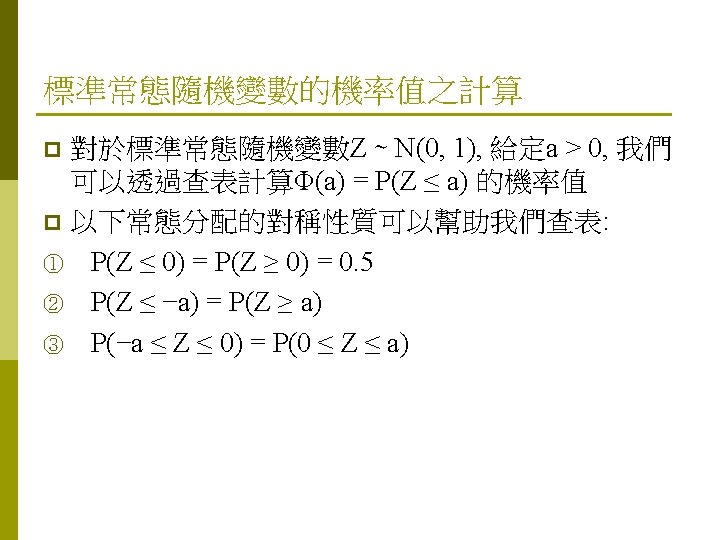
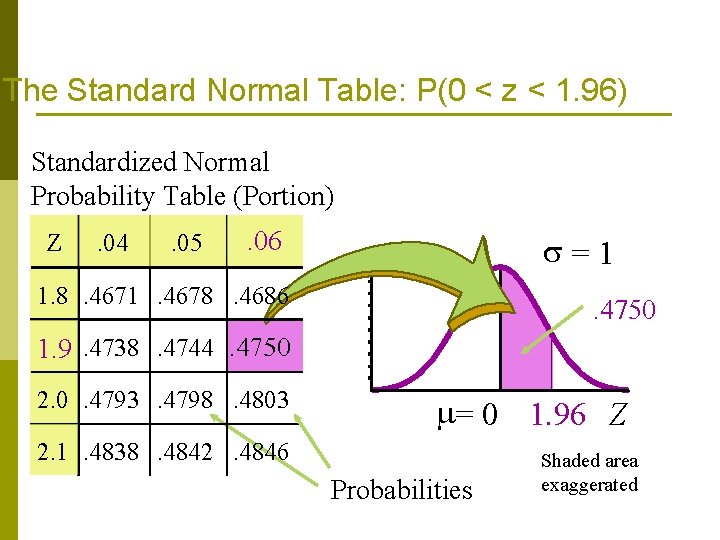
The Standard Normal Table: P(0 < z < 1. 96) Standardized Normal Probability Table (Portion) Z . 04 . 05 . 06 =1 1. 8. 4671. 4678. 4686 . 4750 1. 9. 4738. 4744. 4750 2. 0. 4793. 4798. 4803 = 0 1. 96 Z 2. 1. 4838. 4842. 4846 Probabilities Shaded area exaggerated
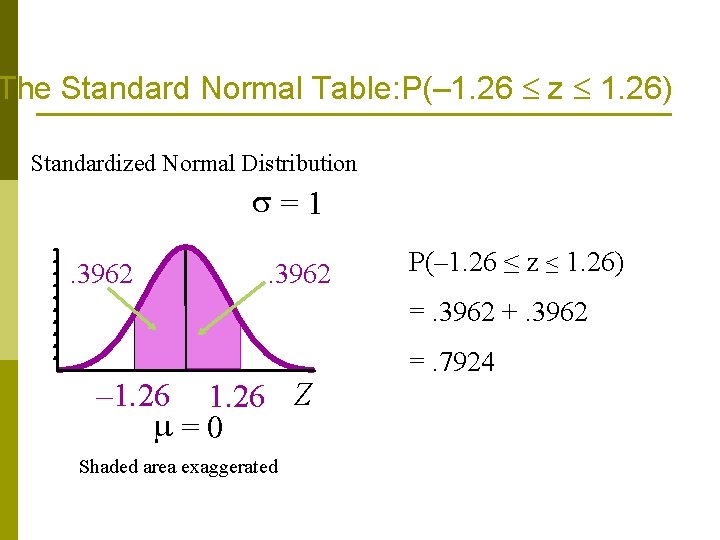
The Standard Normal Table: P(– 1. 26 z 1. 26) Standardized Normal Distribution =1. 3962 P(– 1. 26 ≤ z ≤ 1. 26) =. 3962 +. 3962 – 1. 26 Z =0 Shaded area exaggerated =. 7924
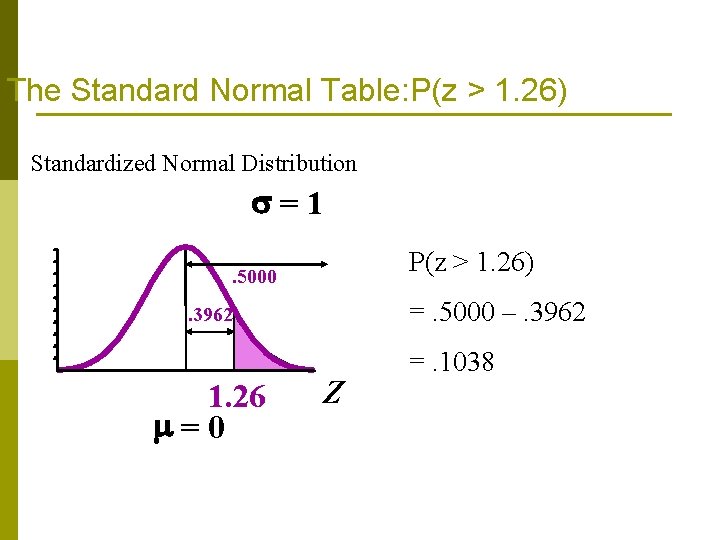
The Standard Normal Table: P(z > 1. 26) Standardized Normal Distribution s=1 P(z > 1. 26) . 5000 =. 5000 –. 3962 1. 26 m=0 Z =. 1038
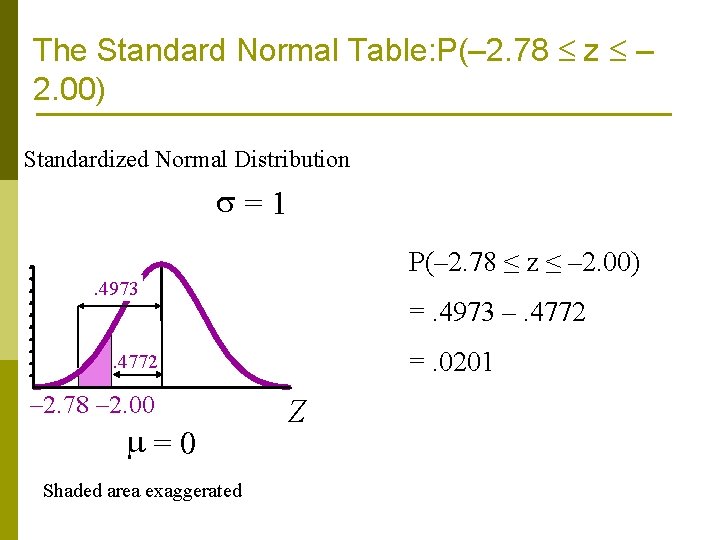
The Standard Normal Table: P(– 2. 78 z – 2. 00) Standardized Normal Distribution =1 P(– 2. 78 ≤ z ≤ – 2. 00). 4973 =. 4973 –. 4772 =. 0201 . 4772 – 2. 78 – 2. 00 =0 Shaded area exaggerated Z
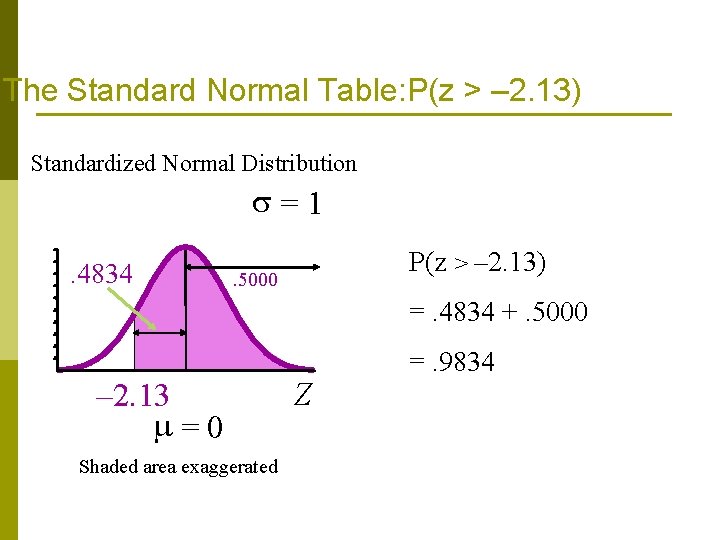
The Standard Normal Table: P(z > – 2. 13) Standardized Normal Distribution =1. 4834 P(z > – 2. 13) . 5000 =. 4834 +. 5000 – 2. 13 =0 Shaded area exaggerated Z =. 9834
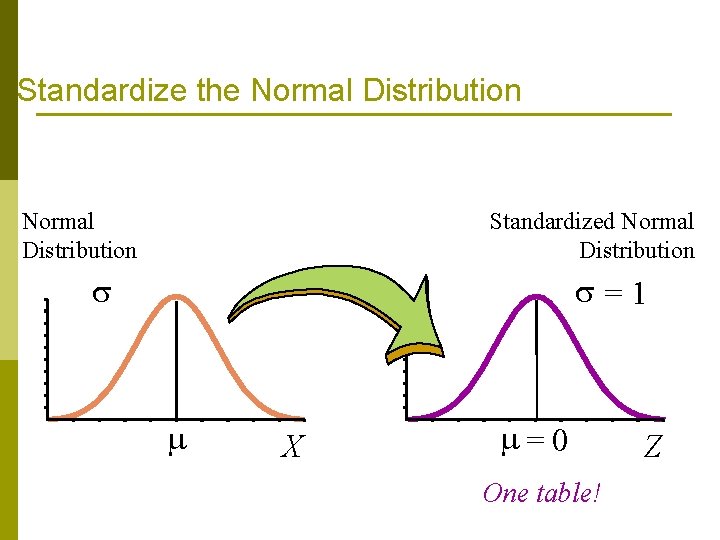
Standardize the Normal Distribution Standardized Normal Distribution = 1 X = 0 One table! Z
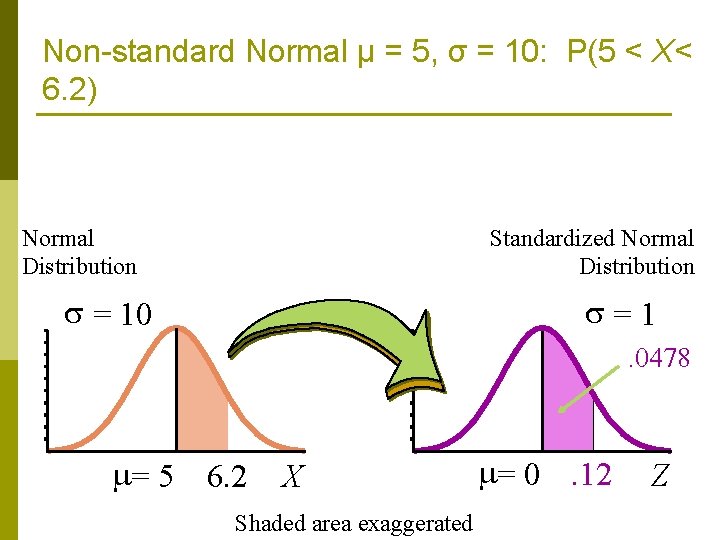
Non-standard Normal μ = 5, σ = 10: P(5 < X< 6. 2) Normal Distribution Standardized Normal Distribution = 10 =1. 0478 = 5 6. 2 X Shaded area exaggerated = 0. 12 Z
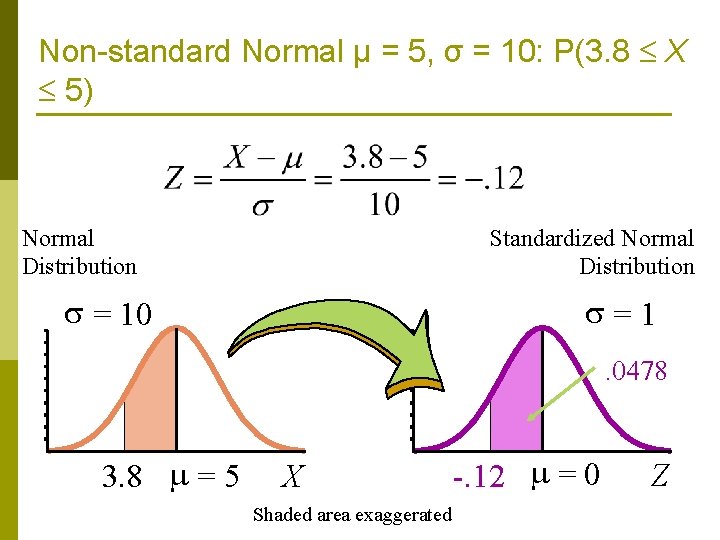
Non-standard Normal μ = 5, σ = 10: P(3. 8 X 5) Normal Distribution Standardized Normal Distribution =1 = 10 . 0478 3. 8 = 5 X Shaded area exaggerated -. 12 = 0 Z
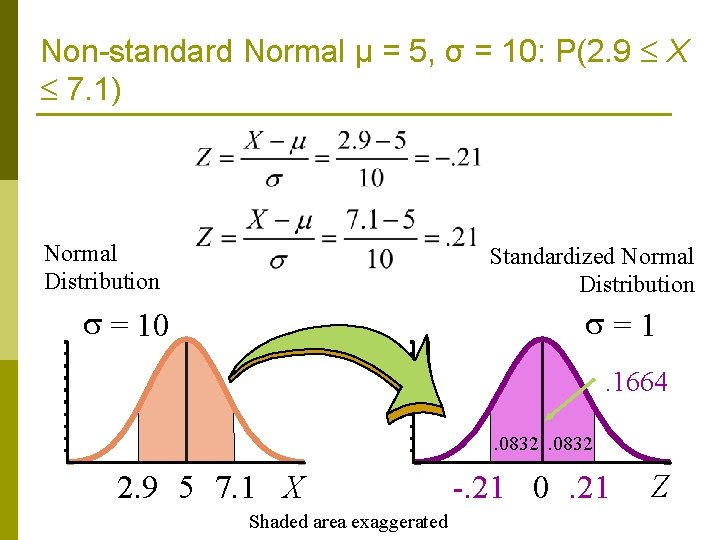
Non-standard Normal μ = 5, σ = 10: P(2. 9 X 7. 1) Normal Distribution Standardized Normal Distribution = 10 =1. 1664. 0832 2. 9 5 7. 1 X Shaded area exaggerated -. 21 0. 21 Z
Non-standard Normal μ = 5, σ = 10: P(X 8) Normal Distribution Standardized Normal Distribution = 10 =1. 5000. 1179 =5 8 X Shaded area exaggerated =0 . 3821 . 30 Z
Non-standard Normal μ = 5, σ = 10: P(7. 1 X 8) Normal Distribution Standardized Normal Distribution = 10 =1. 1179. 0832 =5 7. 1 8 X =0 . 21. 30 . 0347 Z
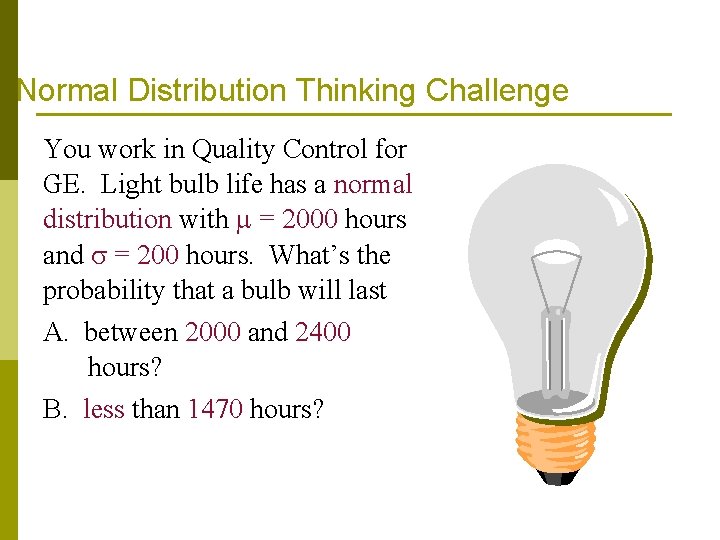
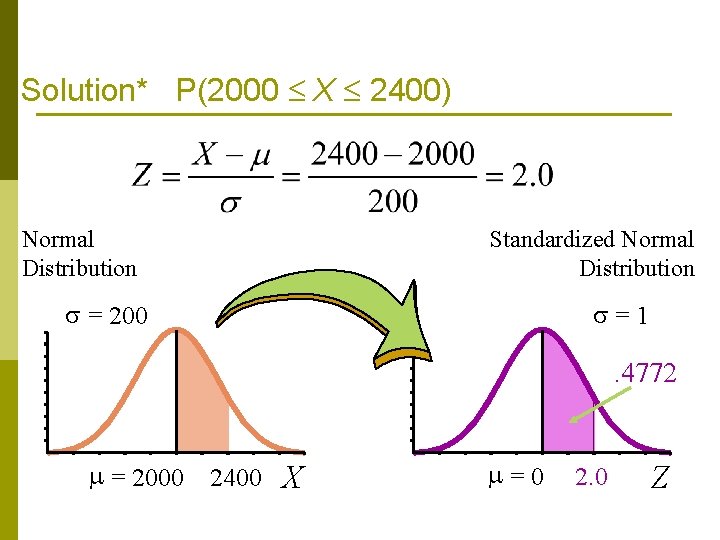
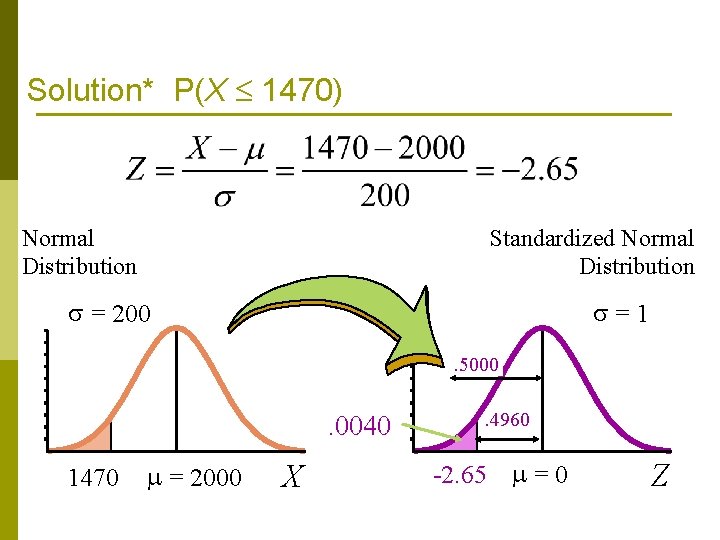
Normal Distribution Thinking Challenge You work in Quality Control for GE. Light bulb life has a normal distribution with = 2000 hours and = 200 hours. What’s the probability that a bulb will last A. between 2000 and 2400 hours? B. less than 1470 hours?
Solution* P(2000 X 2400) Normal Distribution Standardized Normal Distribution = 200 =1 . 4772 = 2000 2400 X =0 2. 0 Z
Solution* P(X 1470) Normal Distribution Standardized Normal Distribution = 200 =1. 5000 . 0040 1470 = 2000 X . 4960 -2. 65 = 0 Z
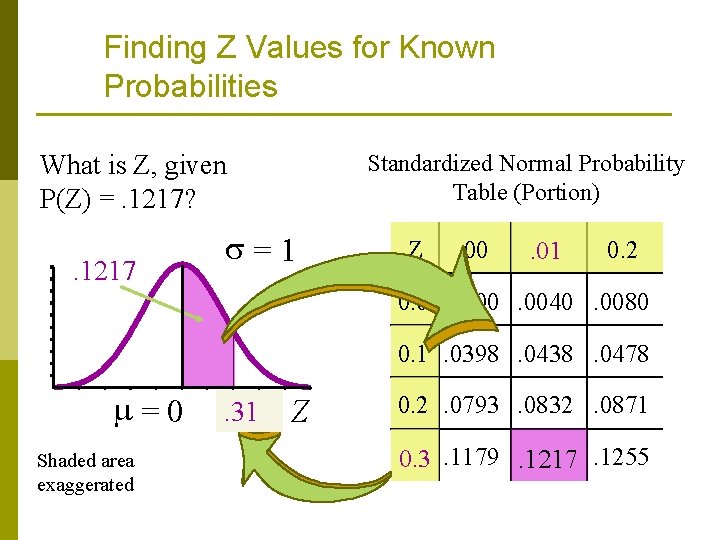
Finding Z Values for Known Probabilities Standardized Normal Probability Table (Portion) What is Z, given P(Z) =. 1217? . 1217 =1 Z . 00 . 01 0. 2 0. 0. 0000. 0040. 0080 0. 1. 0398. 0438. 0478 =0 Shaded area exaggerated . 31 ? Z 0. 2. 0793. 0832. 0871 0. 3. 1179. 1217. 1255
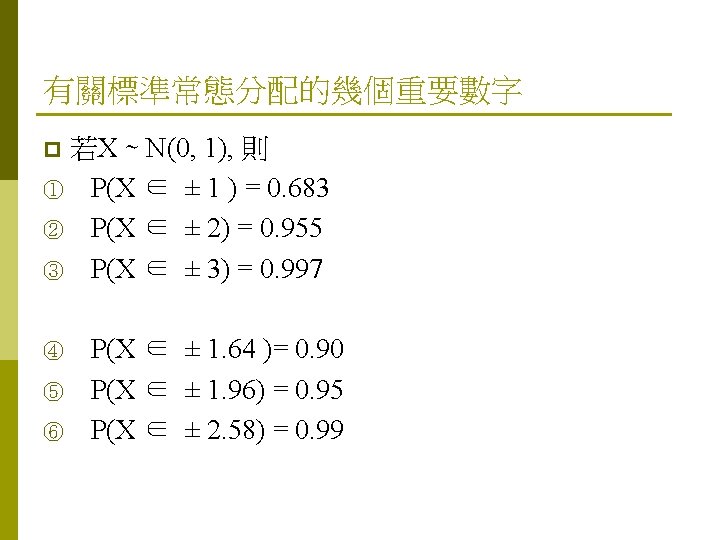
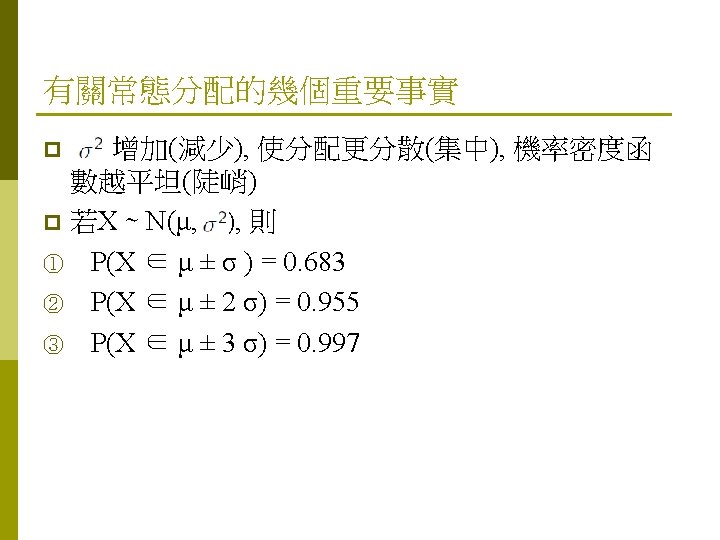
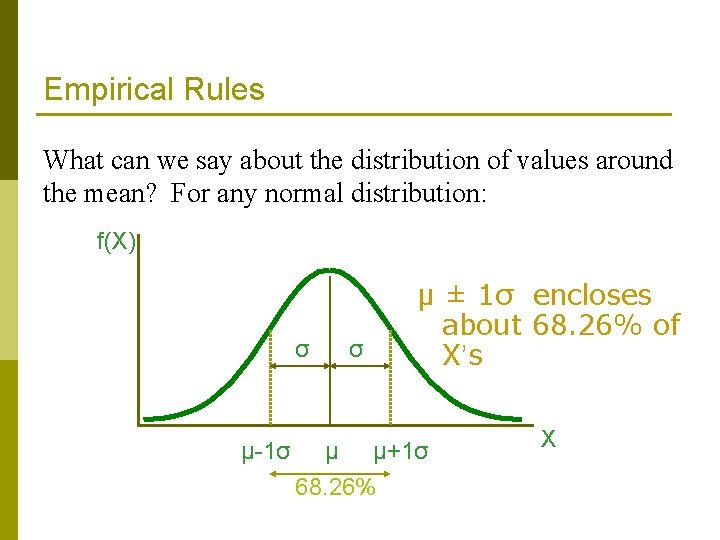
Empirical Rules What can we say about the distribution of values around the mean? For any normal distribution: f(X) σ μ-1σ μ ± 1σ encloses about 68. 26% of X’s σ μ μ+1σ 68. 26% X
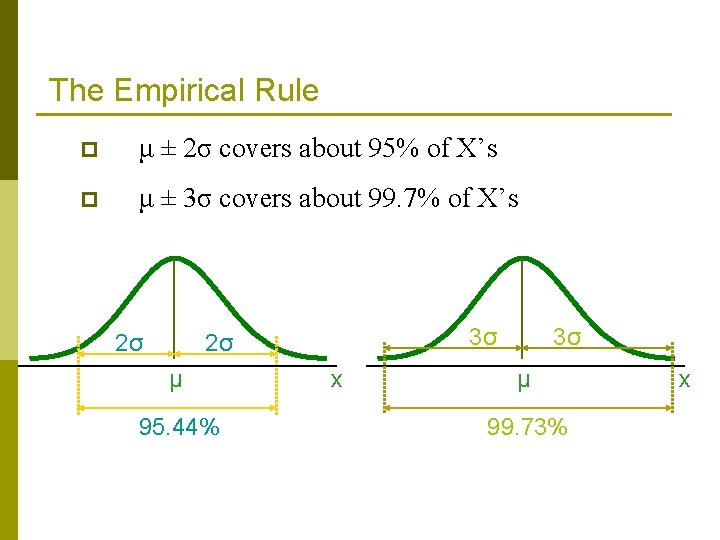
The Empirical Rule p μ ± 2σ covers about 95% of X’s p μ ± 3σ covers about 99. 7% of X’s 2σ 3σ 2σ μ 95. 44% x 3σ μ 99. 73% x