
Allometric exponents support a 34 power scaling law










- Slides: 55
Allometric exponents support a 3/4 power scaling law Catherine C. Farrell Nicholas J. Gotelli Department of Biology University of Vermont Burlington, VT 05405
Gotelli lab, May 2005
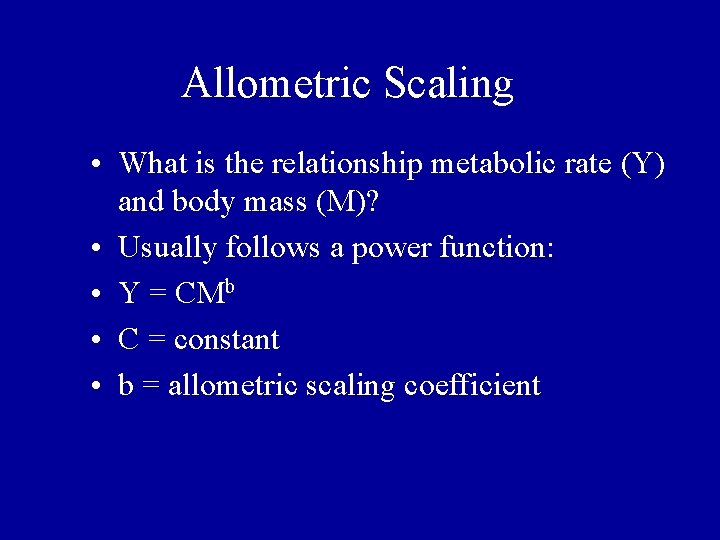
Allometric Scaling • What is the relationship metabolic rate (Y) and body mass (M)?
Allometric Scaling • What is the relationship metabolic rate (Y) and body mass (M)? • Mass units: grams, kilograms • Metabolic units: calories, joules, O 2 consumption, CO 2 production
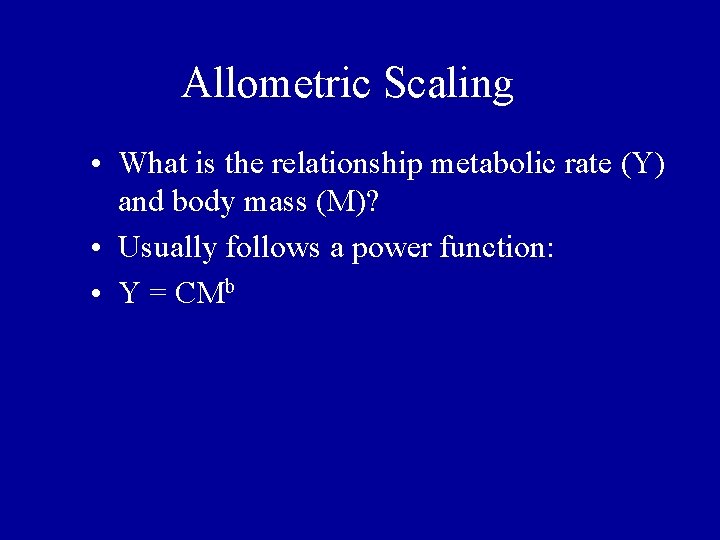
Allometric Scaling • What is the relationship metabolic rate (Y) and body mass (M)? • Usually follows a power function: • Y = CMb
Allometric Scaling • What is the relationship metabolic rate (Y) and body mass (M)? • Usually follows a power function: • Y = CMb • C = constant • b = allometric scaling coefficient
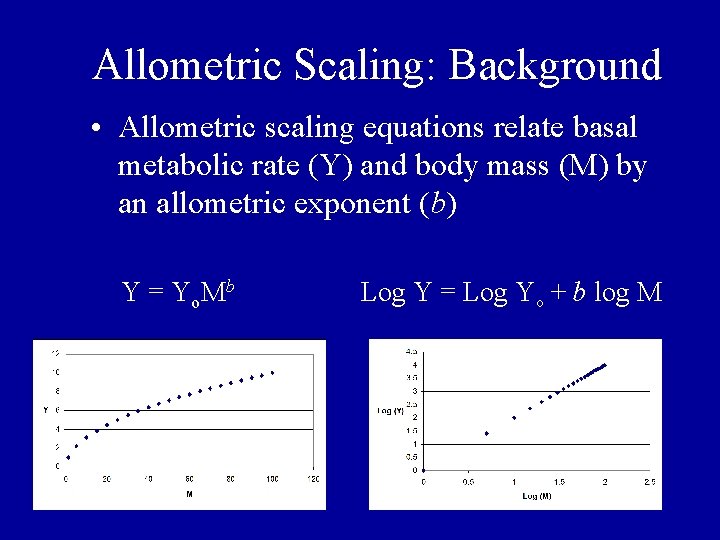
Allometric Scaling: Background • Allometric scaling equations relate basal metabolic rate (Y) and body mass (M) by an allometric exponent (b) Y = Yo. Mb Log Y = Log Yo + b log M
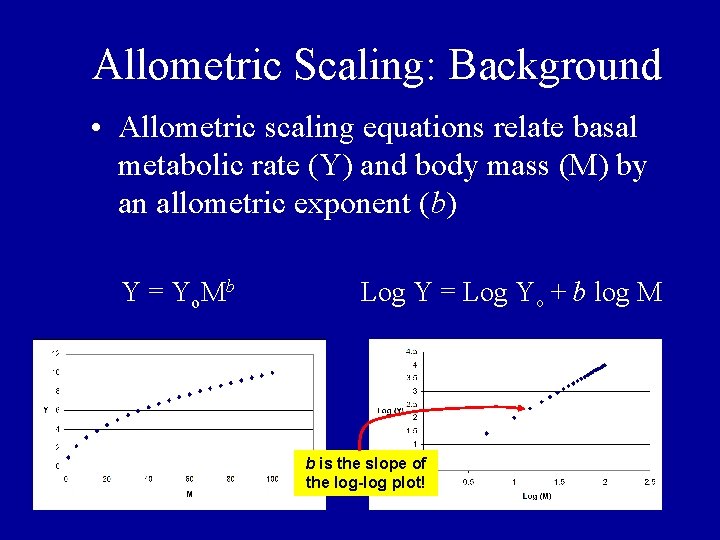
Allometric Scaling: Background • Allometric scaling equations relate basal metabolic rate (Y) and body mass (M) by an allometric exponent (b) Y = Yo. Mb Log Y = Log Yo + b log M b is the slope of the log-log plot!
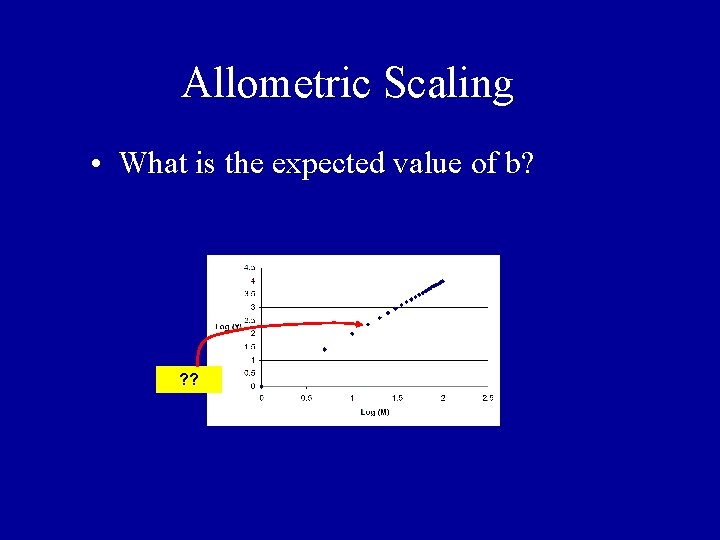
Allometric Scaling • What is the expected value of b? ? ?
Hollywood Studies Allometry Godzilla (1954) A scaled-up dinosaur
Hollywood Studies Allometry The Incredible Shrinking Man (1953) A scaled-down human
Miss Allometry Raquel Welch Movies spanning > 15 orders of magnitude of body mass!
1 Million B. C. (1970)
Fantastic Voyage (1964)
Hollywood (Finally) Learns Some Biology Alien (1979) Antz (1998)
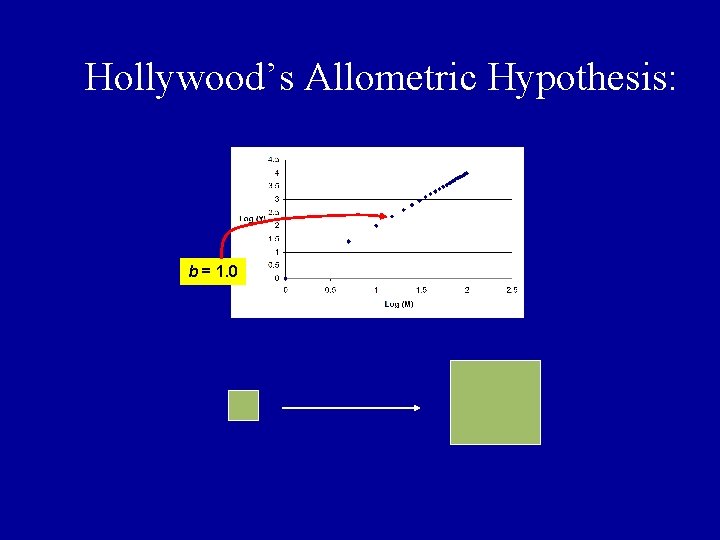
Hollywood’s Allometric Hypothesis: b = 1. 0
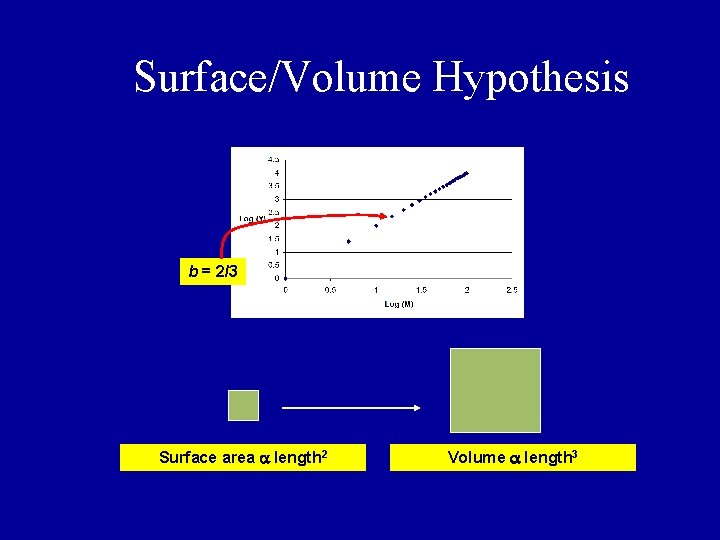
Surface/Volume Hypothesis b = 2/3 Surface area length 2 Volume length 3
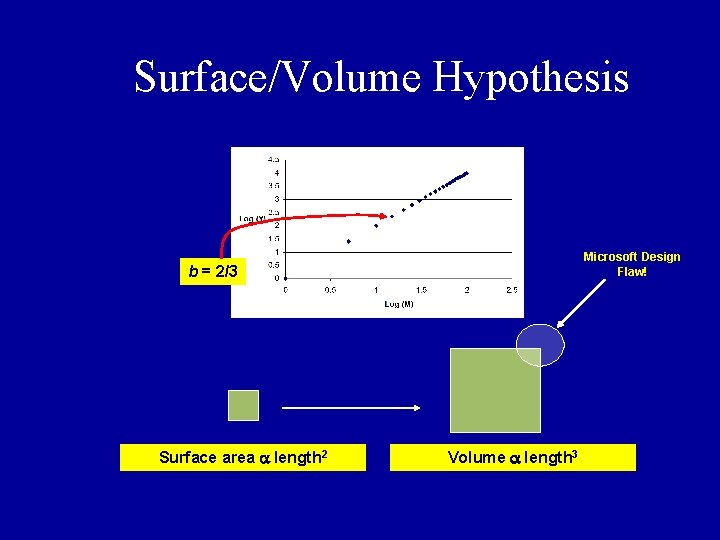
Surface/Volume Hypothesis Microsoft Design Flaw! b = 2/3 Surface area length 2 Volume length 3
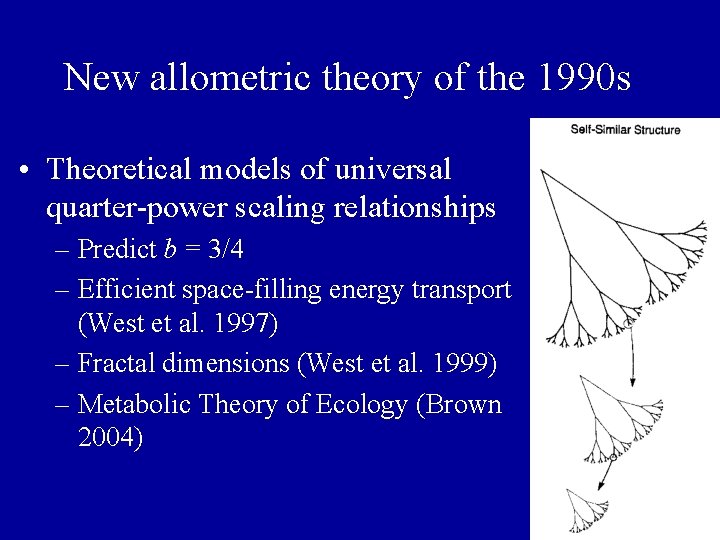
New allometric theory of the 1990 s • Theoretical models of universal quarter-power scaling relationships – Predict b = 3/4 – Efficient space-filling energy transport (West et al. 1997) – Fractal dimensions (West et al. 1999) – Metabolic Theory of Ecology (Brown 2004)
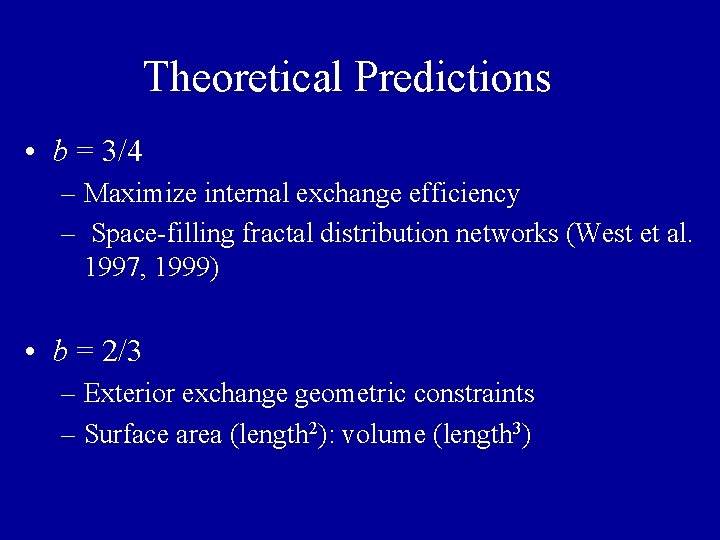
Theoretical Predictions • b = 3/4 – Maximize internal exchange efficiency – Space-filling fractal distribution networks (West et al. 1997, 1999) • b = 2/3 – Exterior exchange geometric constraints – Surface area (length 2): volume (length 3)
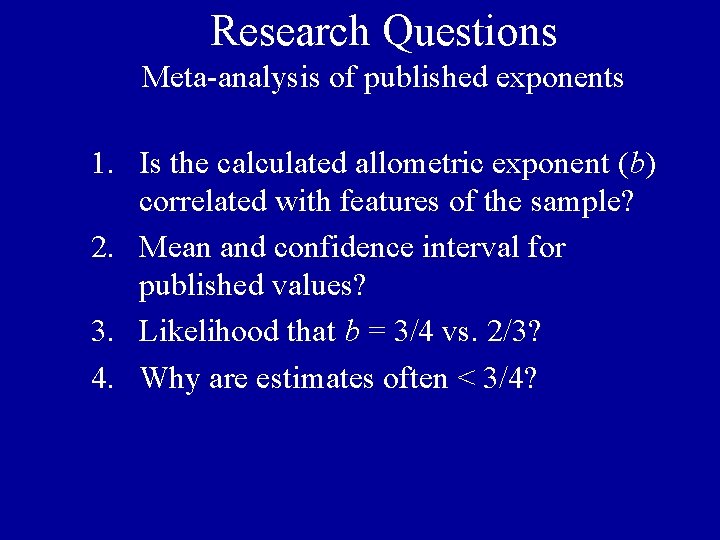
Research Questions Meta-analysis of published exponents 1. Is the calculated allometric exponent (b) correlated with features of the sample? 2. Mean and confidence interval for published values? 3. Likelihood that b = 3/4 vs. 2/3? 4. Why are estimates often < 3/4?
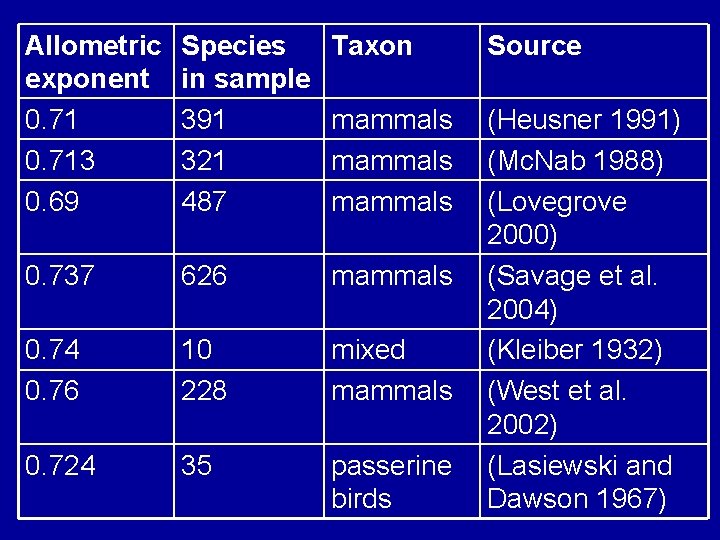
Allometric exponent 0. 713 0. 69 Species in sample 391 321 487 Taxon Source mammals 0. 737 626 mammals 0. 74 0. 76 10 228 mixed mammals 0. 724 35 passerine birds (Heusner 1991) (Mc. Nab 1988) (Lovegrove 2000) (Savage et al. 2004) (Kleiber 1932) (West et al. 2002) (Lasiewski and Dawson 1967)
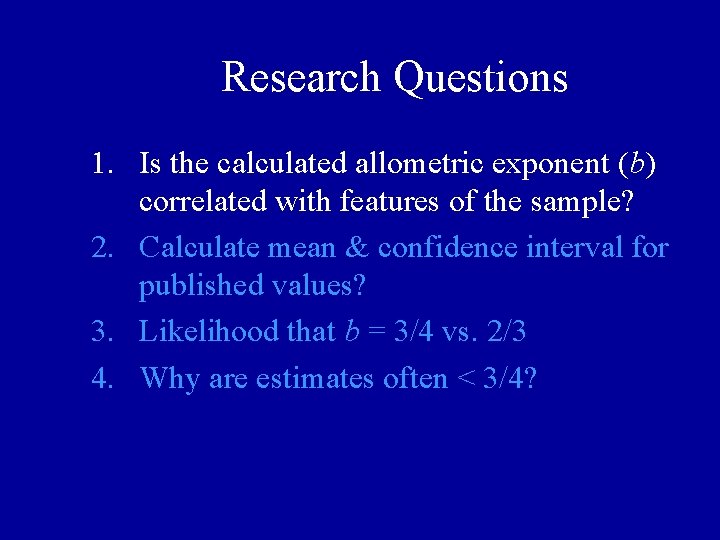
Research Questions 1. Is the calculated allometric exponent (b) correlated with features of the sample? 2. Calculate mean & confidence interval for published values? 3. Likelihood that b = 3/4 vs. 2/3 4. Why are estimates often < 3/4?
Question 1 • Can variation in published allometric exponents be attributed to variation in – sample size – average body size – range of body sizes measured
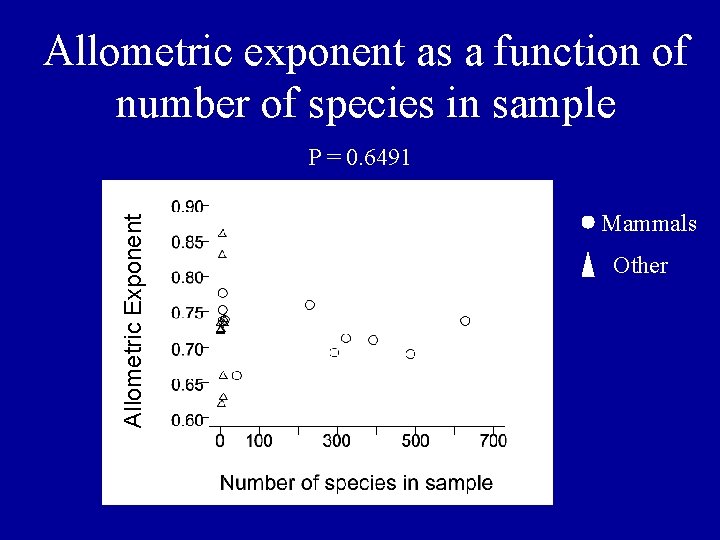
Allometric exponent as a function of number of species in sample Allometric Exponent P = 0. 6491 Mammals Other
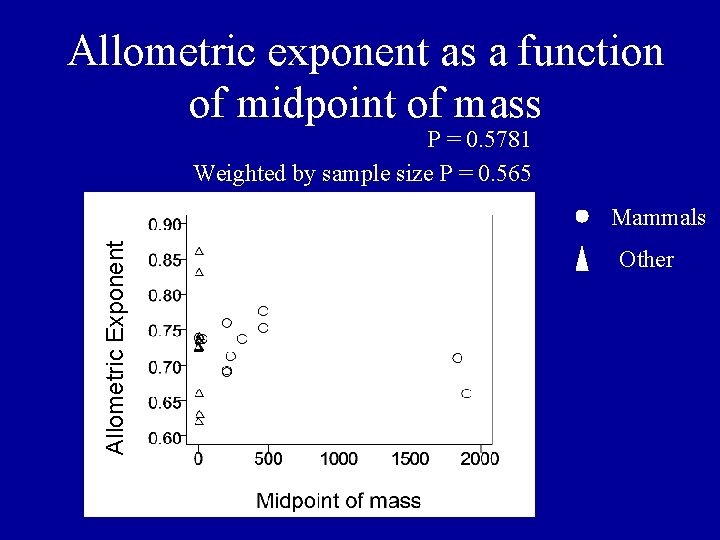
Allometric exponent as a function of midpoint of mass P = 0. 5781 Weighted by sample size P = 0. 565 Allometric Exponent Mammals Other
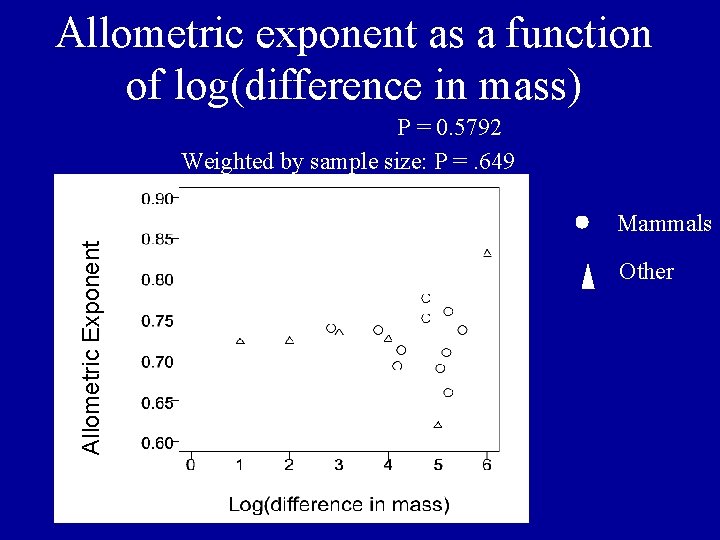
Allometric exponent as a function of log(difference in mass) P = 0. 5792 Weighted by sample size: P =. 649 Allometric Exponent Mammals Other
Non-independence in Published Allometric Exponents • phylogenetic non-independence – species within a study exhibit varying levels of phylogenetic relatedness Bokma 2004, White and Seymour 2003 • data on the same species are sometimes used in multiple studies
Independent Contrast Analysis • Paired studies analyzing related taxa (Harvey and Pagel 1991) – e. g. , marsupials and other mammals • Each study was included in only one pair • No correlation (P > 0. 05) between difference in the allometric exponent and – difference in sample size, – midpoint of mass – range of mass
Question 1: Conclusions • Allometric exponent was not correlated with – sample size – midpoint of mass – range of body size • Reported values not statistical artifacts
Research Questions 1. Is the calculated allometric exponent (b) correlated with features of the sample? 2. Calculate mean & confidence interval for published values? 3. Likelihood that b = 3/4 vs. 2/3 4. Why are estimates often < 3/4?
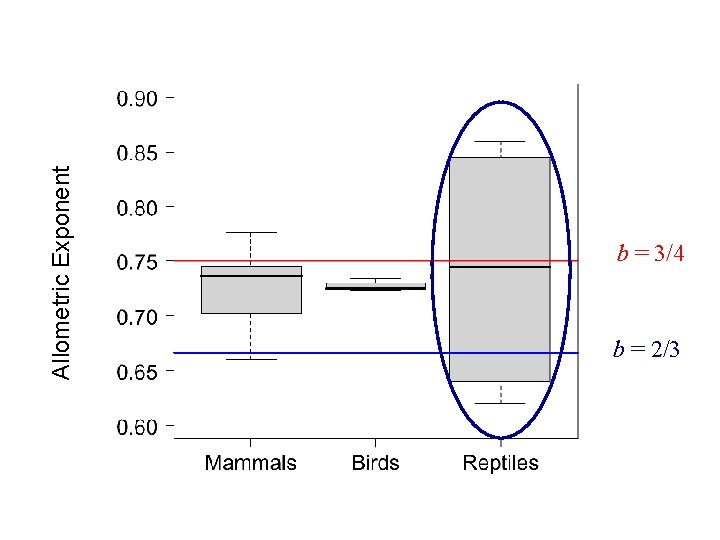
Question 2: What is the best estimate of the allometric exponent? Mammals Birds Reptiles
Allometric Exponent b = 3/4 b = 2/3
Allometric Exponent b = 3/4 b = 2/3
Allometric Exponent b = 3/4 b = 2/3
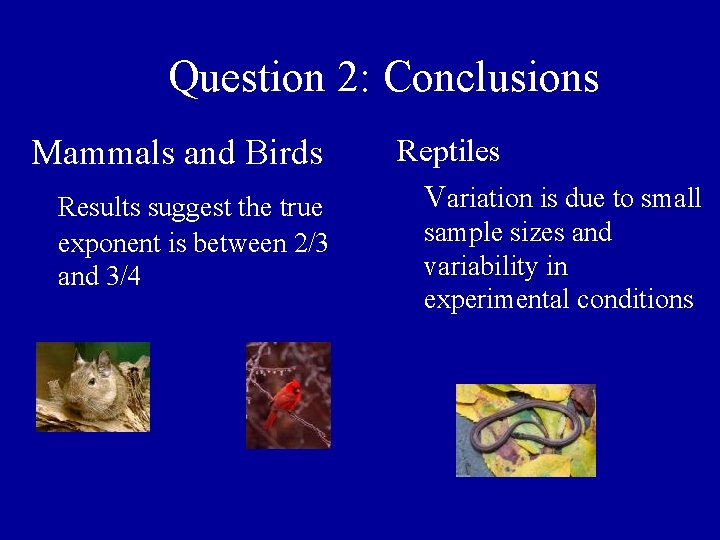
Question 2: Conclusions Mammals and Birds Results suggest the true exponent is between 2/3 and 3/4 Reptiles Variation is due to small sample sizes and variability in experimental conditions
Research Questions 1. Is the calculated allometric exponent (b) correlated with features of the sample? 2. Calculate mean & confidence interval for published values? 3. Likelihood that b = 3/4 vs. 2/3? 4. Why are estimates often < 3/4?
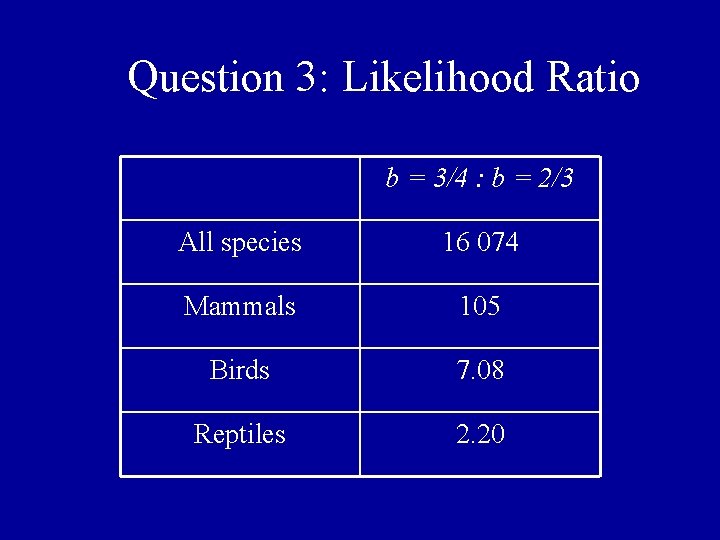
Question 3: Likelihood Ratio b = 3/4 : b = 2/3 All species 16 074 Mammals 105 Birds 7. 08 Reptiles 2. 20
Research Questions 1. Is the calculated allometric exponent (b) correlated with features of the sample? 2. Calculate mean & confidence interval for published values? 3. Likelihood that b = 3/4 vs. 2/3? 4. Why are estimates often < 3/4?
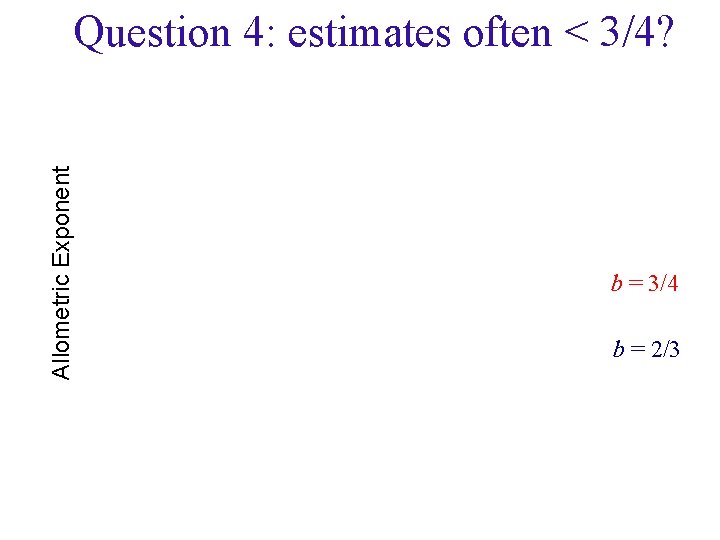
Allometric Exponent Question 4: estimates often < 3/4? b = 3/4 b = 2/3
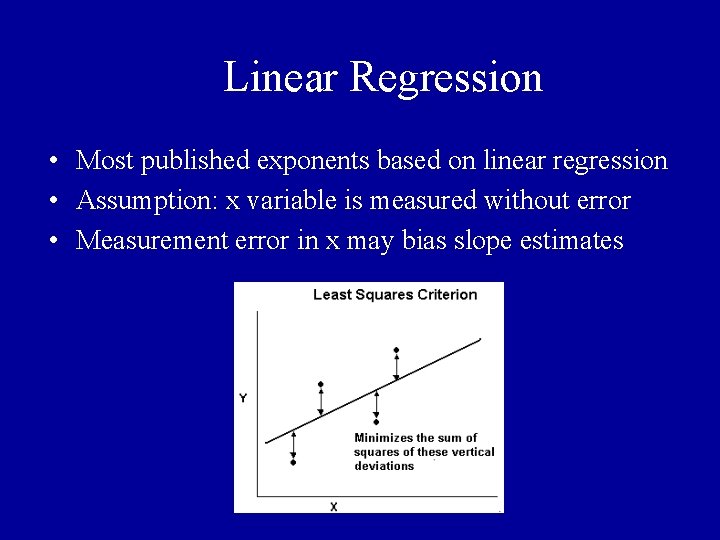
Linear Regression • Most published exponents based on linear regression • Assumption: x variable is measured without error • Measurement error in x may bias slope estimates
Measurement Error • • Limits measurement of true species mean mass Includes seasonal variation Systematic variation “Classic” measurement errors
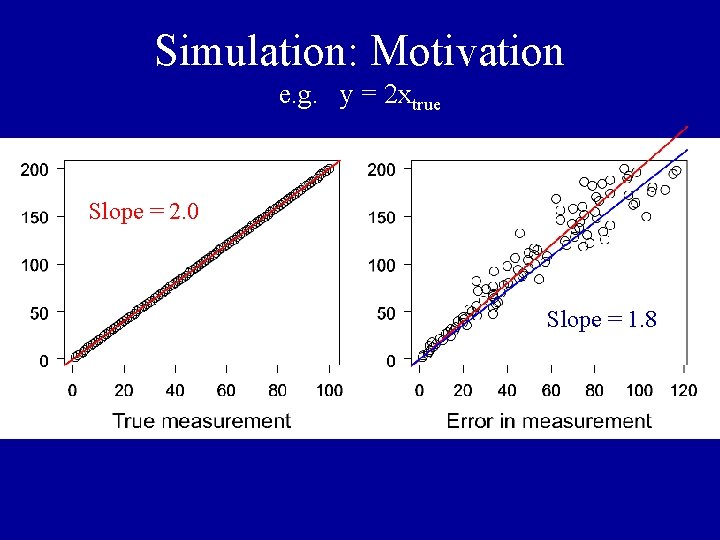
Simulation: Motivation e. g. y = 2 xtrue Slope = 2. 0 Slope = 1. 8
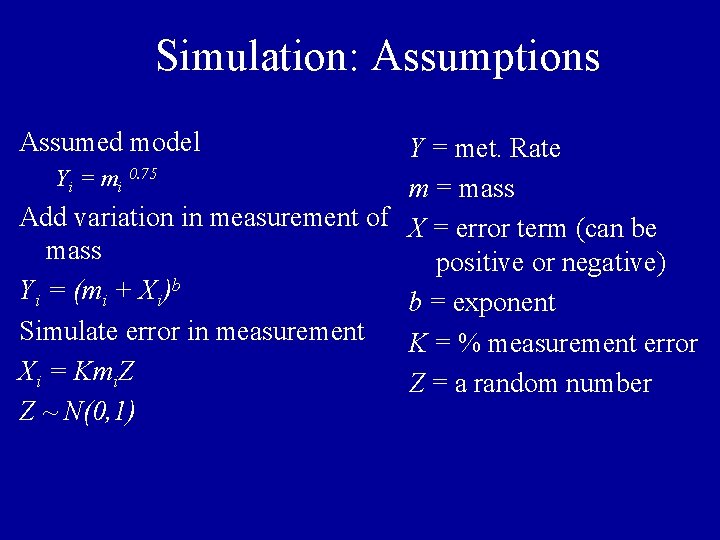
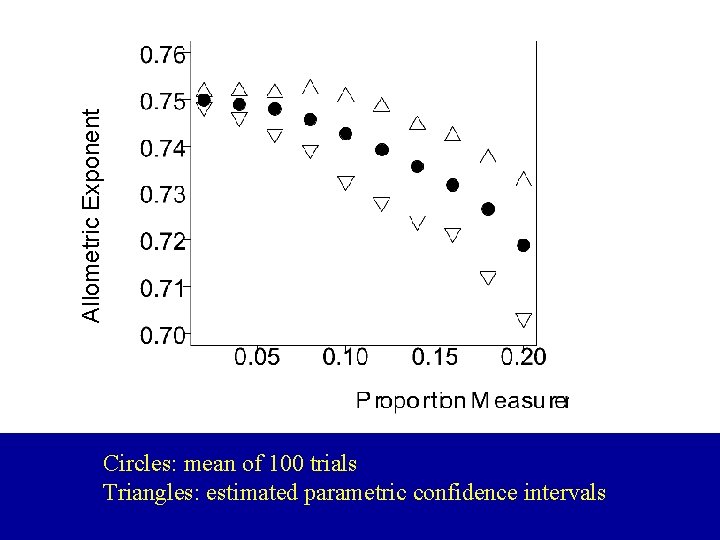
Simulation: Assumptions Assumed model Y = met. Rate Yi = mi 0. 75 m = mass Add variation in measurement of X = error term (can be mass positive or negative) Yi = (mi + Xi)b b = exponent Simulate error in measurement K = % measurement error Xi = Kmi. Z Z = a random number Z ~ N(0, 1)
Allometric Exponent Circles: mean of 100 trials Triangles: estimated parametric confidence intervals
Question 4: Conclusions • Biases slope estimates down • Never biases slope estimates up • Parsimonious explanation for discrepancy between observed and predicted allometric exponents for homeotherms.
Slope Estimates Revisited • Other methods than least-squares can be used to fit slopes to regression data • “Model II Regression” does not assume that error is only in the y variable • Equivalent to fitting principal components
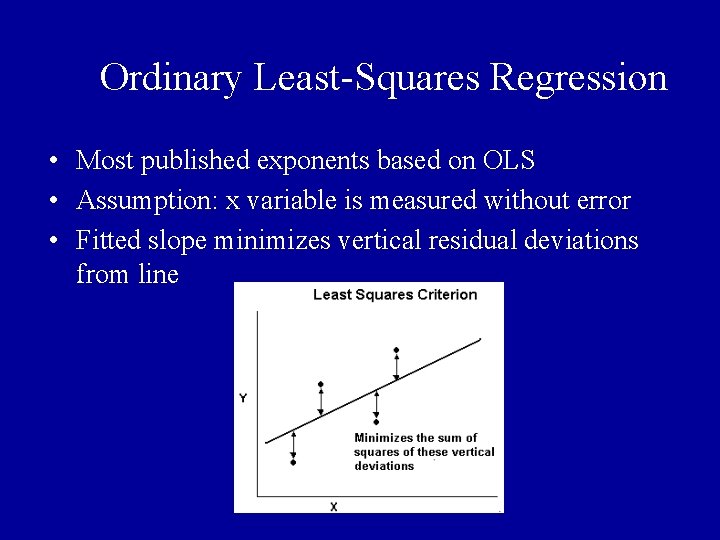
Ordinary Least-Squares Regression • Most published exponents based on OLS • Assumption: x variable is measured without error • Fitted slope minimizes vertical residual deviations from line
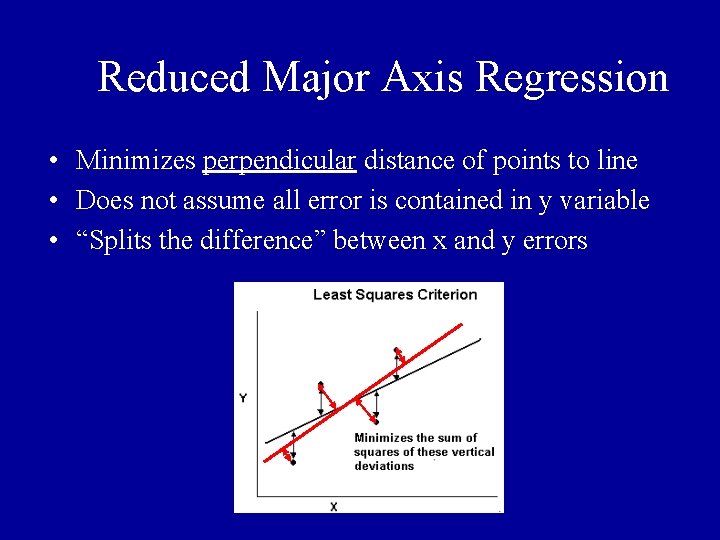
Reduced Major Axis Regression • Minimizes perpendicular distance of points to line • Does not assume all error is contained in y variable • “Splits the difference” between x and y errors
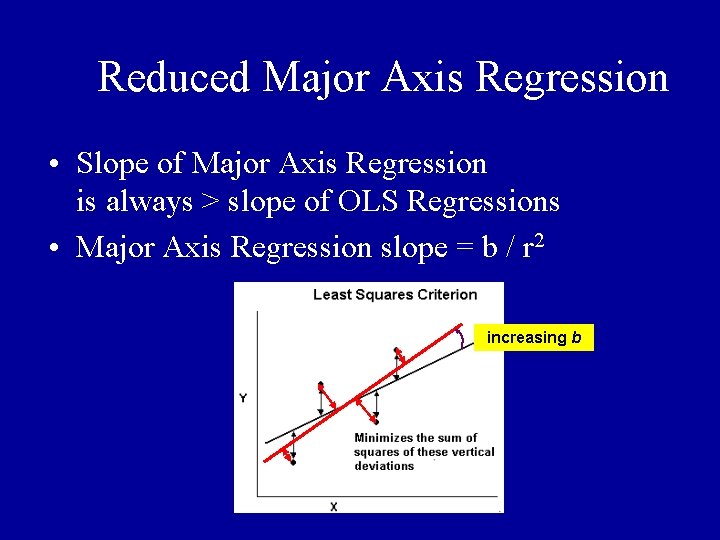
Reduced Major Axis Regression • Slope of Major Axis Regression is always > slope of OLS Regressions • Major Axis Regression slope = b / r 2 increasing b
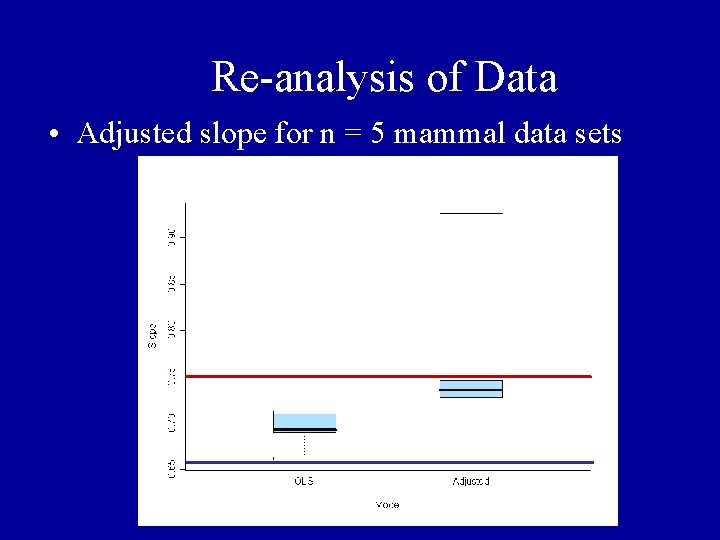
Re-analysis of Data • Adjusted slope for n = 5 mammal data sets
Conclusions • Measured allometric exponents not correlated with features of sample • Published exponents cluster tightly for homeotherms – values slightly lower than the predicted b = 3/4. • Published exponents highly variable for poikilotherm studies
Conclusions • Body mass measurement error always biases least-squares slope estimates downward • Observed allometric exponents closer to 3/4 than 2/3
Acknowledgements Gordon Research Conference Committee Metabolic Basis of Ecology Bates College July 4 -9, 2004