Classification of scaling technique ORDINAL SCALEs NOMINAL SCALE


 18")


- Slides: 23
Classification of scaling technique
ORDINAL SCALEs NOMINAL SCALE ndicates difference in categories east powerful level of measurement oes not measure Magnitude and Interval ategorizing people on the basis of their political ffiliation is an example of Nominal Scale an be split into mutually exclusive and collectively xhaustive sub-sets Ø Ø scale points Identifies not just the difference between two categories but also by “how much? ” Ranks of a student in a class is an exampl Ordinal Scale Do not make any attempt to make equal intervals § Possess an Absolute Zero Point § Most precise level of measurement § Does not possess Absolute Zero Point Example: Difference of height of 5 people: Provide additional information about magnitude only i. e. size and direction Ratio SCALEs interval SCALEs Possess the characteristic of equal intervals between Also known as RANKING SCALES § Physical measures such as height, weight c measured on a Ratio Scale Example: Ratio of Wheat and Rice= 1: 5
Primary Scales of Measurement Scale Basic characteristics Table Common examples Marketing example Permissible statistics Descriptive 3 Nominal Numbers identify and classify objects Student registration numbers, numbers on football players’ shirts Gender classification, bank types Ordinal Numbers indicate Rankings of the top the relative positions of the 4 teams in the objects but football World Cup not the magnitude of differences between them Interval Differences between objects can be compared; zero point is arbitrary Attitudes, opinions, Temperature (Fahrenheit, Celsius) index numbers Ratio Zero point is fixed; ratios of scale values can be computed Length, weight Inferential Percentages, mode Chi-square, binomial test Ranking of service Percentile, median Rank-order quality delivered by a correlation, number of Friedman ANOVA banks. Rank order of favourite television programmes Age, income, costs, sales, market shares Range, mean, standard deviation Product-moment correlations, t-tests, ANOVA, regression, factor analysis Geometric mean, harmonic mean Coefficient of variation
Classification of Scales Single item vs multiple item scale: §In the single item scale, there is only one item to measure a given construct. §In multiple item scale, there are many items that play a role in forming the underlying construct that the researcher is trying to measure. This is because each of the item forms some part of the construct which the researcher is trying to measure. 4
Scaling technique Non comparative scale Comparative scale Paired comparison Q-sort Continuous Rating Stapel Rasch Model Guttman Likert Thurstone Rank ordering Construct Sum Phrase completion Mathematical derived Bogardus social Distance Magnitude estimation scale Semantic differential
Classification of Scales Comparative vs non-comparative scales 6
Classification of Scales � Comparative scales – In comparative scales it is assumed that respondents make use of a standard frame of reference before answering the question. Example: - 7
Classification of Scales • Rank order scales • A ranking is a relationship between a set of items such that , for any two items , the first is either ‘ranked higher than’, ‘ranked lower than.
Classification of Scales Formats of Comparative Scales – � Paired comparison scales � Rank order scale � Constant sum rating scale B. Rank-Order Rating Scales Thinking about the different types of music, please rank your top three preferences of types of music you enjoy listening to by writing in your first choice, second choice, and third choice on the lines provided below. First Preference: Second Preference: Third Preference: 9
Classification of Scales • Constant Sum Scale • Constant Sum scaling is a scaling method used to organise and sort a variety of options. The respondent is presented with a few options and give a number of points to allocate to each option. • Aside from being used on survey and questionnaires constant sum scaling can also be used in more qualitative setting such as focus groups or in-depth interview.
Classification of Scales Formats of Comparative Scales – � Paired comparison scales � Rank order scale � Constant sum rating scale C. Constant Sums Rating Scales Below is a list of seven banking features. Please allocate 100 points among those features such that the allocation represents the importance each feature was to you in your selecting “your” bank. The more points you assign to a feature, the more important that feature was to your selection process. If the feature was “not at all important” in your process, you should not assign it any points. When you have finished, please double-check to make sure your total adds to 100. Banking Features Number of Points Convenience/location _______11______ Banking hours ____9_____ Good service charges ____5_____ The interest rates on loans ____ _20____ The bank’s reputation _____ _8_______ The interest rates on savings ______ 40_______ Bank’s promotional advertising ______ _7______ 100 points 11
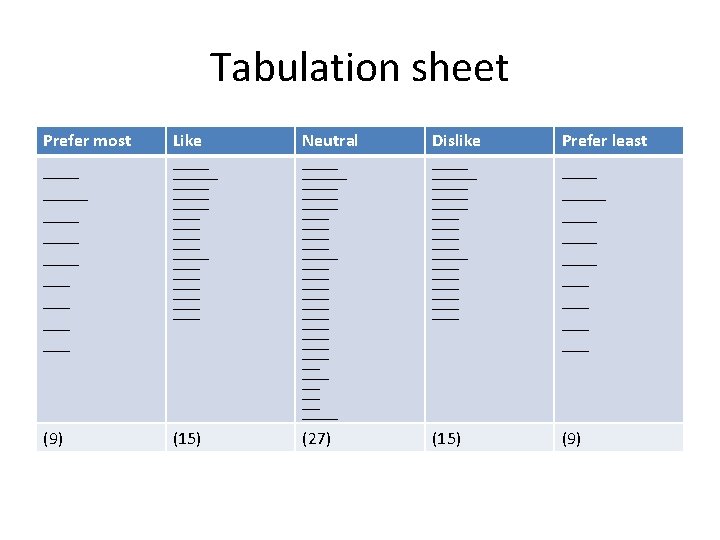
Q-sort • It is used to discriminate among large number of objectives quickly. • It uses a rank order procedure and the objectives are sorted into piles based on similarities with respect to some criteria. • Where respondents are asked to sort a given number of items or statements and classify them into a predetermined number of sets according to some criterion such as preference, attitude or behavior intent, this is the most popular and simplest method to use in the sorting process.
Example: • Classify the given 75 magzines in such a way that choose 9 magzines you most prefer, and list them in the same way choose 9 magzines you least prefer, and list them. of the remaining magzines, choose 15 you like most, 15 like the least and place these names under the column like most and like least and remaining 27 magzines, list them in neutral.
Guttman scale • Described by Louis Guttman in 1944. • It allows progressive investigation in the nature of interview probing , such that you can find out to what degree respondents agree with a concept or principle. • The group of questions seek to investigate just one factor or trait. • It’s disadvantage is this respondents some time committed by earlier questions and seeks consistency, thus they agree with more than they believe. • This can be mitigated through using the concealed form, interleaving the questions which may or may not related with survey.
Classification of Scales Example of Semantic Differential Scale: 16
Classification of Scales Semantic Differential Scale �This scale is widely used to compare the images of competing brands, companies or services. �Here the respondent is required to rate each attitude or object on a number of five-or seven-point rating scales. �This scale is bounded at each end by bipolar adjectives or phrases. �The difference between Likert and Semantic differential scale is that in Likert scale, a number of statements (items) are presented to the respondents to express their degree of agreement/disagreement. However, in the semantic differential scale, bipolar adjectives or phrases are used. 17
Classification of Scales Example of Semantic Differential Scale: (Pictorial Profile) 18
Stapel scale • Each item has only one word/phrase indicating the dimension it represent. • Each item has ten response categories. • Each item has even number categories • The response categories have numerical levels but no verbal levels. • Stapel scale similar to semantic differential scale except 1) Points on the scale are identified by numbers 2) Only one statement is used and if the respondents disagrees a negative number should be marked 3) There are 10 positions instead of 7. 4) It does not require the bipolar adjective.
Classification of Scales Stapel Scale 20
Likert scale • Developed by Rensis Likert • The respondents are asked to indicate a degree of agreement and disagreement with each of a series of statement. • Each scale item has 5 response categories ranging from strongly agree to strongly disagree. Strongly agree Agree Indifferent Disagree Strongly Disagree +2 +1 0 -2 -1
Likert scale • Each degree of agreement is given a numerical score and the respondent’s total score is computed by summing these scores. • This total scores of respondent reveals the particular opinion of a person. • Likert scale are of ordinal type, they enable one to rank the attitude, but not to measure difference between attitudes.
Likert scale Advantages Disadvantages • It is relatively easy to • It takes longer time to construct and administer. complete as compared to semantic Differential scale. • Instructions that accompany the scale are easily • Care needs to be taken understood, hence it can be using Likert scales in cross used for mail surveys and cultural research, as there interviews with children. may be cultural variations in willingness to express disagreement.