Health Inequity in Californias Heartland Exploring the Role


 not caused by")


 Avoidable Hospitalizations (per 10, 000)")
 Median Household")
 Median Household")
 = 23. 9** Model")
 = 35. 8** Model")


- Slides: 36
Health Inequity in California's Heartland: Exploring the Role of Poverty John Capitman* Nickerson Professor of Public Health Executive Director, Central Valley Health Policy Institute California State University, Fresno CSU Stanislaus Social Work Department Annual Conference Poverty Reduction Strategies in the Central Valley – Voices from the Field Thursday, February 24 *With assistance from: Armando Cortez, Mathilda Ruwe, Marlene Bengiamin, Diana Traje, and Kudzai Nyandoro, Central Valley Health Policy Institute, Cal State University Fresno, and Steve Sedlock, Kenneth Studer, and Rexford Anson -Dwamena, Virginia Network for Geospatial Health Research, Inc.
Overview �Definitions and Theoretical Explanation for Health Inequity �Evidence for Health Inequity in the San Joaquin Valley �Exploring the role of concentrated poverty in explaining Valley health outcomes �Key Valley issues in health reform �Questions and Discussion
DEFINITIONS: Health Outcome Inequities, Health Care Inequities Health Inequity: unfair ((a) not caused by underlying biology or exclusively individual choices, AND (b) caused by policy-related systemic differences in exposure) differences between socially-defined groups in health outcomes (length and quality of life, satisfaction with health, clinical measures of health status). Health Care Inequity: unfair ((a) not caused by underlying health differences or exclusively individual choices AND (b) caused by policyrelated systemic factors) differences between socially-defined use in the access to quality health
Summary of Findings: Social Factors and Health—Evidence for Disparities Ø Health disparities occur worldwide—groups with more economic and political power have better health Ø In US, target groups (remember from last time? —people of color, working class, women, kids and elders, persons with disabilities, sexual minorities etc. ) have unfair, worse health and health care. Ø For example: African Americans, Latinos, American-Indian/Alaska Native and some Asian American groups experience: Higher Mortality At All Ages (Kids to Elders) Higher Acute and Chronic Condition Prevalence Higher Rates and Earlier Onset of Disability Less access to appropriate Health Care Lower Quality Health care Less Satisfaction with Health and Health Care Ø Patterns of group differences are complex---for example, (1) women live longer, but more time with disability and caregiving, (2) some racial/ethnic sub-groups have lower mortality than whites in some age groups but data biased by population age or immigration status.
What causes racial/ethnic or other health disparities? Multi-Causal Web Framework: vpatient, provider, care system, and community factors Krieger (2003) “eco-social” framework vdeprivation, toxic physical environments, social traumas, targeted marketing of toxic products, inadequate or degrading medical care Kawachi and others (Harvard) social capital framework vsocial relations and psychosocial stress Marmot and others (British) materialist
What Causes Health Inequities? Unequal Social/Economic Environment Health Care Disparities Health Inequities Unequal Access to Health Care
Inequities in Health and Well-being: Why Place Matters � Mounting evidence: people of color, rural and inner-city residents, and less affluent have worse life outcomes (survival, chronic disease, well-being, appropriate care). � Traditional Approach: Cause genetics, individual behavior. Solutions---Help individuals adopt better behavior � Mounting evidence: social, environmental, economic development, and infrastructure factors---social determinants—explain group differences in life outcomes � New Approach: Cause places, policies, and environments in addition to individual differences. Solutions-- Help communities have better living
Health and Well-being Disparities: San Joaquin Valley Findings � A decade of reports: Valley has worse health and well-being outcomes than California and nation. � Bengiamin et al Healthy People 2010 shows worse outcomes than state, failed national standard for 9 out of 10 health indicators, little progress over last decade. � Multiple reports highlight barriers to health
Poverty and Health in the San Joaquin Selected CHIS findings Median Income Condition <$15 k $15 -$30 k-$60 k >$60 k Fair or Poor Health % 37 31 20 10 Psychologica 13 l Distress % 10 9 8 Diabetes – ever dx % 16 12 8 5 Heart Disease— ever dx % 9 10 5 4 Usual care MD office % 39 47 70 80 Insured all last year % 68 70 83 94
Place-Based Approach 1. How do Valley places differ on health and well- being outcomes? 2. What explains these differences? � CVHPI Data Warehouse: � birth, death by zip code over 7 years � hospitalization by zip code over 9 years � race/ethnicity, median income, density by zip code � economic, education, environmental � Analysis by place –traditional epidemiology methods � Analysis by place- spatial analysis methods STABLE Multi-year MEASURES, BEFORE the RECESSION
Years of Potential Life Lost by Place Overall mean=42. 47 Range=17 -75 years lost/1, 000
Community Features and YPLL �More years of life lost in segregated Latino communities (15 years/10, 000) �More years of life lost in segregated African American and Asian communities (6 years/10, 000) �More years of life lost in poor communities (26 years/10, 000) �Complex multivariate relationships *significant at p=. 05
Top 15 Highest YPLL RED 95202 / 95203 San Joaquin 95205 San Joaquin 93728 Fresno 93706 Fresno 93301 Kern 93307 Kern 93721 / 93701 Fresno 93268 Kern 93619 Fresno 93205 / 93240 Kern 93283 / 93255 95354 93244 / 93286 Top 15 Lowest YPLL GREE N 95304 San Joaquin 95242 San Joaquin 93239 / 93204 Kings 95377 San Joaquin 93611 Fresno 95368 Stanislaus 93311 Kern 93730 / 93711 Fresno 95348 Merced 93720 Fresno 93234 / 93210 Fresno 95219 San Joaquin 95366 San Joaquin 95382 Stanislaus Tulare 95351 Stanislaus 93223 Tulare 93263 Kern
Avoidable Hospitalizations Mean=154. 28 Range-48 -480 avoidable admissions /10, 000 *significant at p=. 05
Community Features and Avoidable Hospitalizations �More ACSC admits in segregated African American and Asian communities (11 admits/10, 000) �More ACSC admits in high poverty communities (75 admits/10, 000) �More ACSC admits in elder communities (39 admits/10, 000) �Complex multivariate relationships
Top 15 Highest AH Top 15 Lowest AH GREE N 95304 San Joaquin 95377 San Joaquin 93239 / 93204 Kings 93608 / 93668 93660 / 93640 Fresno 93206 / 93224 93249 / 93251 93280 Kern 93203 Kern 93234 / 93210 Fresno 95363 Stanislaus 95368 Stanislaus 93241 Kern 93648 Fresno 93314 Kern 93646 Tulare 95348 Merced RED 93205 / 93240 93283 / 93255 Kern 93301 Kern 93308 Kern 93268 Kern 95202 / 95203 San Joaquin 95205 San Joaquin 95212 San Joaquin 95204 San Joaquin 93505 Kern 95350 Stanislaus 93706 Fresno 95336 San Joaquin 93243 / 93560 Kern 93257 Tulare 93274 Tulare
Equity in Health and Well-being Before the Recession 1. 2. 3. 4. 5. 6. Huge differences in health outcomes between Valley communities, and patterns vary by condition. Lower income communities have more premature death and more avoidable hospitalizations Communities with more Latinos are not at greater risk for premature death and more avoidable hospitalizations, but communities that are more immigrant are. While premature death is more common in poorer community, racial/ethnic disparities are more pronounced in more affluent communities. While premature death increases in lower income communities, premature death disparities are lower in poorer communities. While avoidable admissions are higher in poorer communities, Latinos are at relatively greater risk in more segregated Community features are complexly inter-related, making models relatively unstable
Explaining Community Differences in Health Outcomes � Multivariate analyses of place differences: Inconclusive because of place-based correlations Don’t say much about the process • Social theory suggests that at least some place effects on health are: • psychologically mediated (stress), • complexly linked to social relations (social capital) • complexly linked to living context (materialist) Two Hypotheses: 1) Social Composition/Policies produce low income/segregated communities with lower perceived neighborhood quality, 2) Perceived neighborhood quality is associated with negative health outcomes, controlling for other factors
Explaining Community Differences in Health Outcomes �Created 105 zip clusters/communities �Cluster analysis of all 105 communities using YPPL, ACSC Admissions, % Latino, Density, and Median Income �Selected 1 community from each cluster/spread across 8 counties �Systematic social observation (“drive-by survey”) �Conducted random digit dialing telephone survey of community residents…. about 150/community �Survey questions addressed: neighborhood quality, life satisfaction, health status, civic engagement, perceived discrimination
Summary of Findings �In communities with higher poverty and worse health outcomes, there was more objective disorder, even though urban neighborhoods had more assets. �In communities with higher poverty, worse health outcomes, and more objective disorder, people perceived their neighborhoods as having poorer quality. �People who perceived their neighborhoods as worse had lower life satisfaction, poorer self-rated health, less civic engagement, more perceived discrimination for their group, and more experiences of personal discrimination
AFFORDABLE CARE ACT Key Components 2010 Persons 23 -26 remain on parents’ plan Federally funded high risk Tax credit for small employers to purchase coverage Private insurance reforms New requirements on non-profit hospitals Federal support to states for exchange, Medicaid changes, insurance regulation changes New investments in safety net infrastructure, public health and health
AFFORDABLE CARE ACT Key Components 2014 and Beyond Uninsured/Low Income Medicaid expanded to 133% of FPL with 100% match Subsidized coverage for 133 -400% of FPL State exchange for legal residents, 133 -400% of FPL and others Safety net improvements Medicare Reduced subsidy for Medicare Advantage plans Phased in elimination of the Part D “donut hole” Benefit improvements Reimbursement reform demonstrations Comparative effectiveness, payment , and quality initiatives Privately Insured States implement individual mandate to hold qualifying insurance. Employer mandate to provide qualifying insurance or pay tax Insurance improvements implemented by states
ACA Implementation: San Joaquín Valley Concerns v Finance care for undocumented v Address SJV needs in Medi-Cal expansion v Develop Patient-Center Medical Homes and network care coordination programs v Expand health care work force--specialty care, self-care supports v Insurance regulation/exchange operations
Discussion �Individual and community level poverty are powerful influences on health and well-being in the California’s heartland. �Poverty, racial/ethnic composition, immigrant concentration and poverty are linked in complex ways across the region’s diverse communities. �Quality of life---infrastructure, development, housing etc. —is lower in less affluent communities…. people know it…and they report acting and feeling worse.
Discussion �Affordable Care Act offers enormous opportunities---to improve access and quality of care AND to invest in primary prevention �Bringing needed care to concentrated immigrant and low-income communities will remain a central challenge for the region �Behavioral health as a key factor in community health--and a key shortage area �Opportunity for social work in addressing a) prevention and self-care, b) improving behavioral health access and quality c) promoting culturally appropriate care--FOCUS on inter-disciplinary training and mulit-level approach
For more information, �Please visit our website: cvhpi. org �Participate in the Health Policy Leadership Program--- Information/ Applications at website �Or contact me: jcapitman@csufresno. edu tel: 559228 -2157
Race/Ethnicity and Health Outcomes SJV YPLL (per 1, 000) Avoidable Hospitalizations (per 10, 000) All 42. 47 154. 28 Latino 43. 39 317. 50 Non-Latino 41. 39 57. 69 White 61. 47 207. 35 African American/Asian 70. 60 210. 30^ ^Avoidable hospitalizations for African American only
Community Features and YPLL San Joaquin Valley (8 counties – 117 clusters) Median Household Income Low (16661 – 27270) (27271 – 39125) N=7 N = 41 Years of Potential Life Lost (per 1, 000) 57. 79* 46. 33 Medium (39126 – 48739) N = 31 40. 82 (48740 – 60033) 37. 72 N = 26 High (60034 – 85691) N = 12 31. 31 % Births by Immigrant Parent(s) Low ( <= 30% ) N = 39 39. 92 Mid ( 30% - 48% ) N = 39 41. 80 High ( > 48% ) N = 39 44. 59 *significant at p=. 05
Community Features and ACSC San Joaquin Valley (8 counties – 117 clusters) Median Household Income Low (16661 – 27270) (27271 – 39125) N=7 N = 41 Medium (39126 – 48739) (48740 – 60033) 204. 14* 149. 22 N = 31 N = 26 High (60034 – 85691) Avoidable Hospitalizations (per 10, 000) N = 12 154. 89 153. 18 126. 47 % Births by Immigrant Parent(s) Low ( <= 30% ) n = 39 Mid ( 30% - 48% ) High ( > 48% ) *significant at p=. 05 n = 39 171. 42* 152. 27 133. 98
Multivariate Findings– Premature Death r 2=. 37 F (3, 112) = 23. 9** Model (beta, p) Median Income -. 656** % Hispanic -. 117 ns % Immigrant Moms. 300** Premature Death Ethnic Difference r 2=. 13 F (3, 112) = 14. 4* Model (beta, p) Median Income. 293* % Hispanic. 661** % < age 25 -. 315*
Multivariate Findings– ACSC Admissions r 2=. 561 F (3, 112) = 35. 8** Model (beta, p) Median Income -. 570** % Hispanic. 570 ns % Immigrant Moms. 262 * % > age 65 ACSC Admissions Ethnic Difference r 2=. 783 F (3, 112) = 132. 6** Model (beta, p) Median Income -. 123+ % Hispanic. 816** % > age 65. 239**
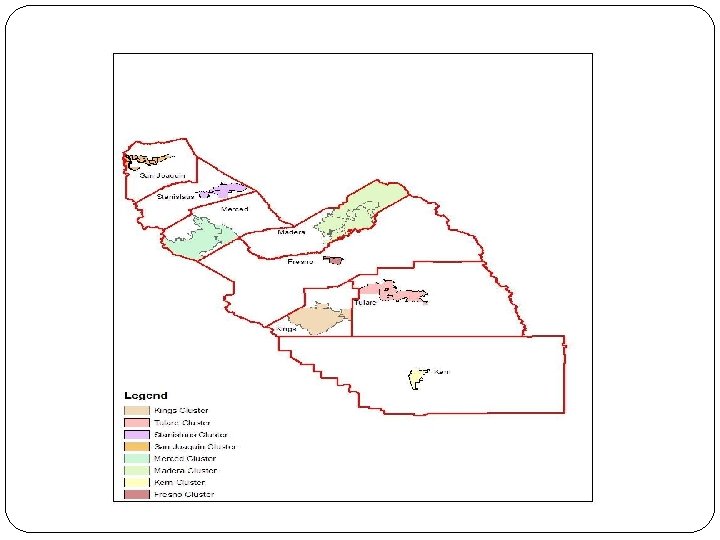
Description of Selected Community Clusters
Community Clusters: Disorder and Asset Scores
Community Cluster Survey Neighborhood Disadvantage Community Cluster N Neighborhood Disadvantage Low Density Rural High Density Urban Mean [SD] North Stockton 121 2. 989 [3. 377] South Fresno Core 146 3. 961 [3. 359] E. Bakersfield/Lamont 144 4. 194 [3. 384] N. Visalia/Exeter 125 2. 632 [3. 388] Waterford/Hughson 121 2. 719 [3. 366] Corcoran 140 4. 411 [3. 408] Los Baños/Dos Palos 156 2. 165 [3. 372] The Mountains 126 2. 396 [3. 367]
Multivariate Findings: Neighborhood Quality and Life Outcomes