Earths Climate Past Present and Future Concerns and




- Slides: 87
Earth’s Climate: Past, Present and Future; Concerns and Solutions Week 4: Thursday, April 13, 2017 Paul Belanger Concerns: Rates of change, Ocean acidification, modeling 1. 2. 3. 4. 5. Recap of climate variables and past records Rates of change Proxies that tell us of climate records Ocean Acidification Climate Modeling
1. Recap of climate variables and past records
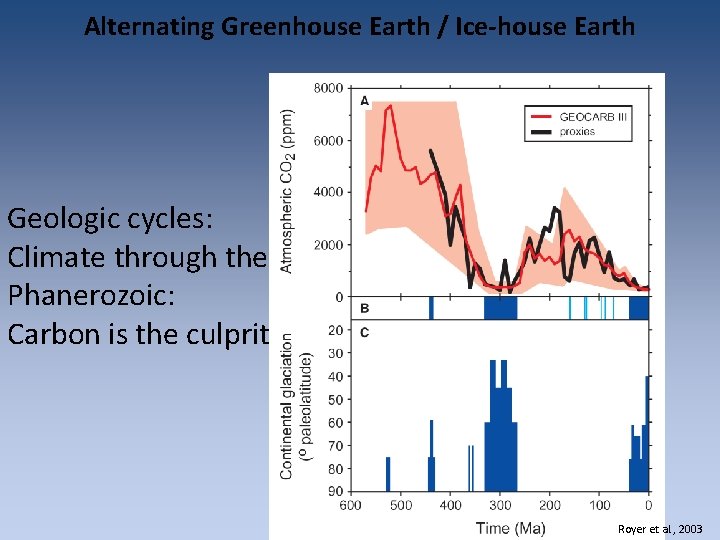
Alternating Greenhouse Earth / Ice-house Earth Geologic cycles: Climate through the Phanerozoic: Carbon is the culprit Royer et al. , 2003
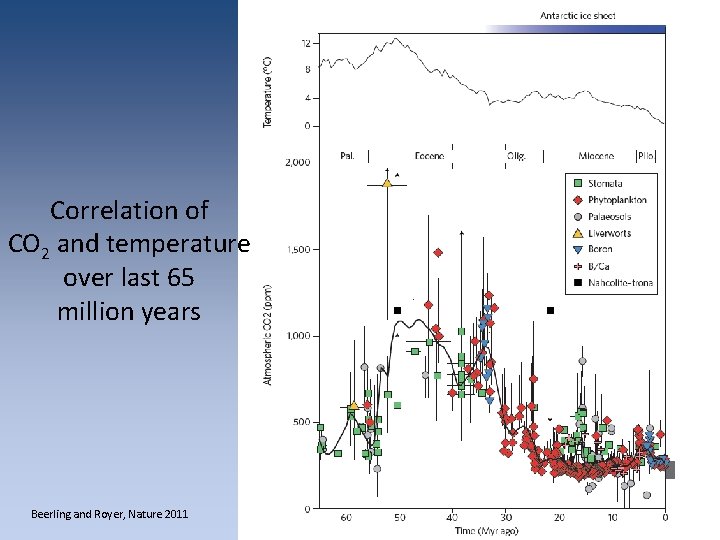
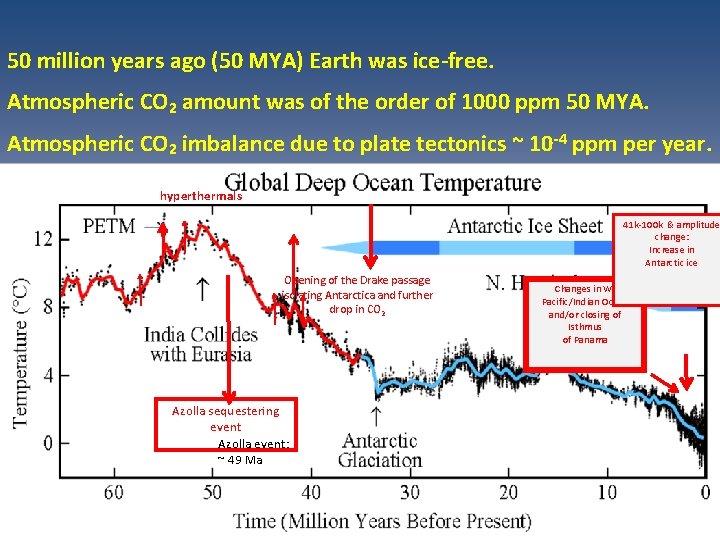
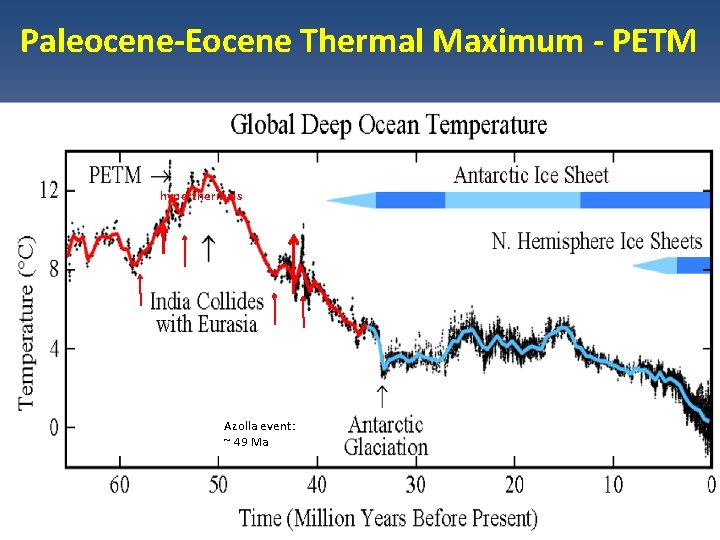
Correlation of CO 2 and temperature over last 65 million years Beerling and Royer, Nature 2011
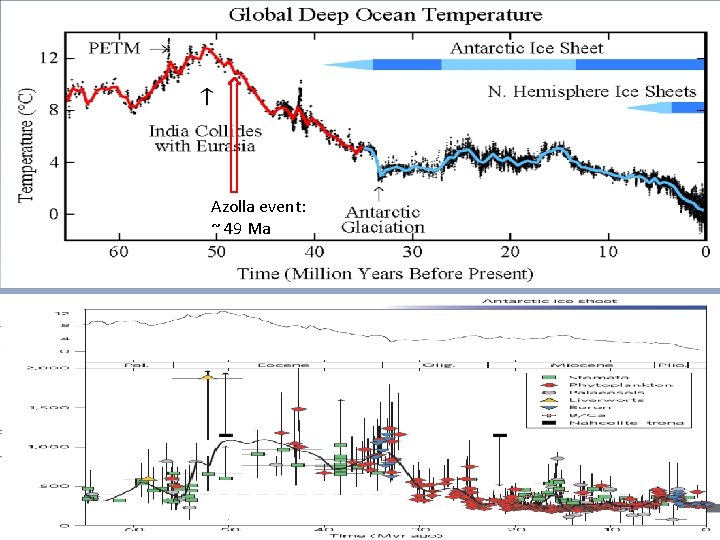
Azolla event: ~ 49 Ma
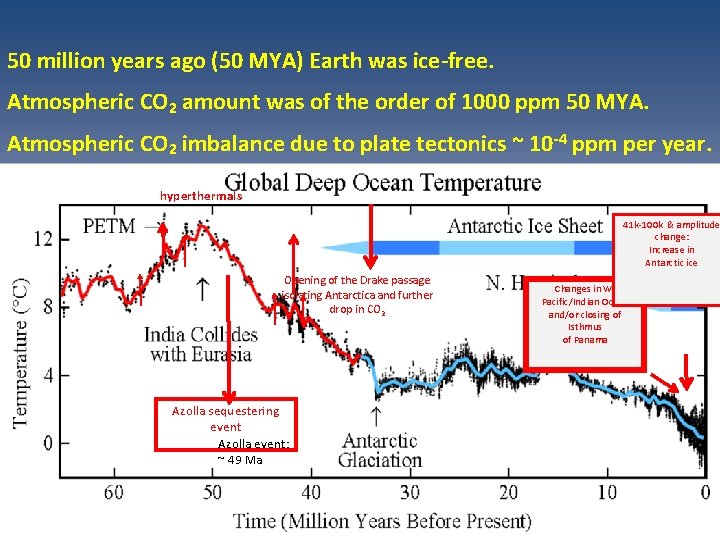
50 million years ago (50 MYA) Earth was ice-free. Atmospheric CO 2 amount was of the order of 1000 ppm 50 MYA. Atmospheric CO 2 imbalance due to plate tectonics ~ 10 -4 ppm per year. hyperthermals 41 k-100 k & amplitude change: Increase in Antarctic ice Opening of the Drake passage isolating Antarctica and further drop in CO 2 Azolla sequestering event Azolla event: ~ 49 Ma Changes in W. Pacific/Indian Ocean and/or closing of Isthmus of Panama
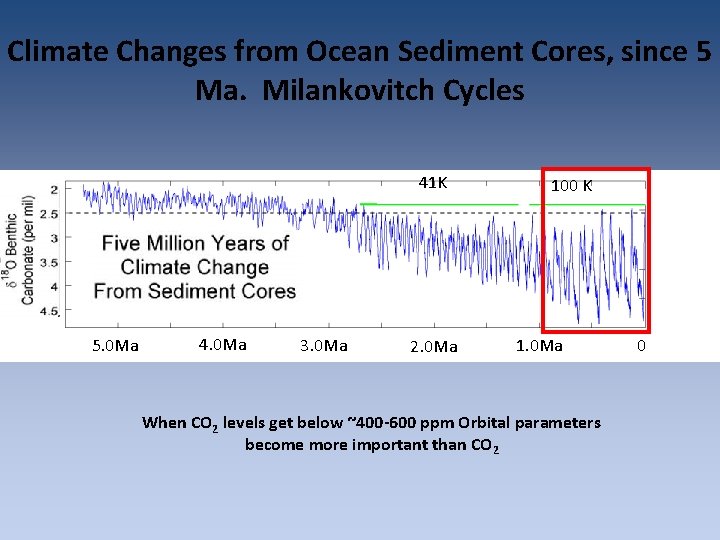
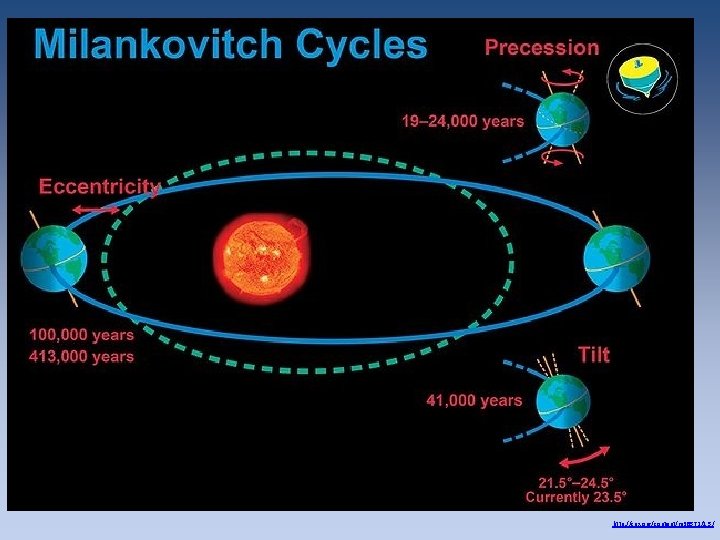
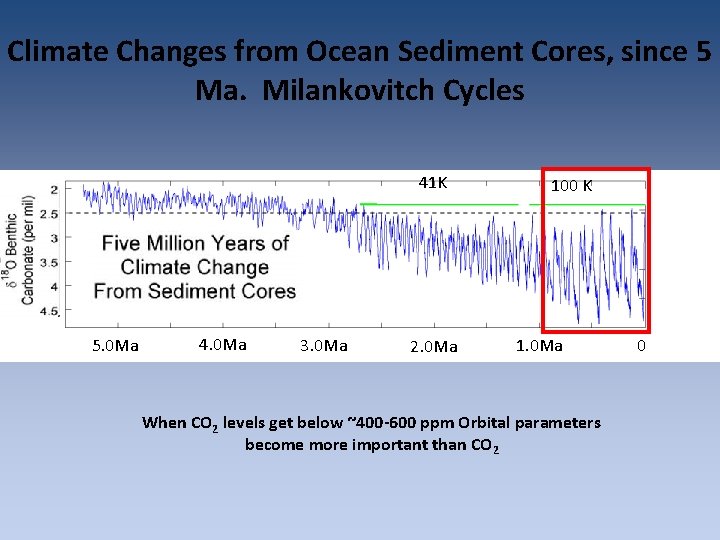
Climate Changes from Ocean Sediment Cores, since 5 Ma. Milankovitch Cycles 41 K 5. 0 Ma 4. 0 Ma 3. 0 Ma 2. 0 Ma 100 K 1. 0 Ma When CO 2 levels get below ~400 -600 ppm Orbital parameters become more important than CO 2 0
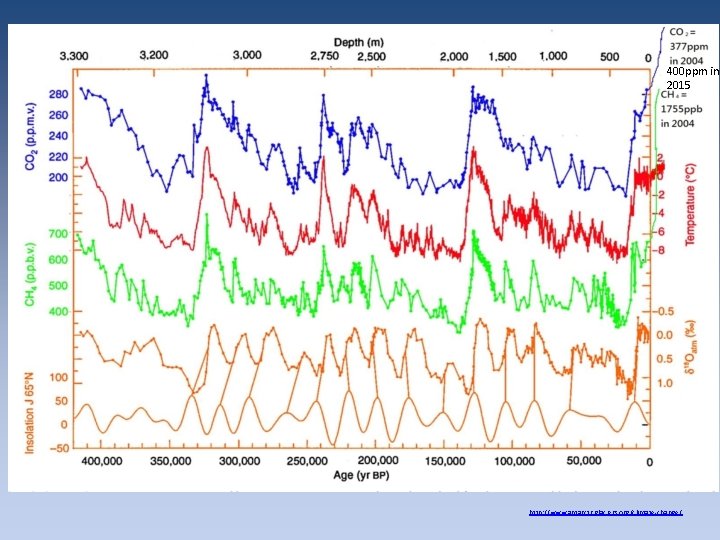
400 ppm in 2015 http: //www. antarcticglaciers. org/climate-change/
http: //cnx. org/content/m 38572/1. 5/
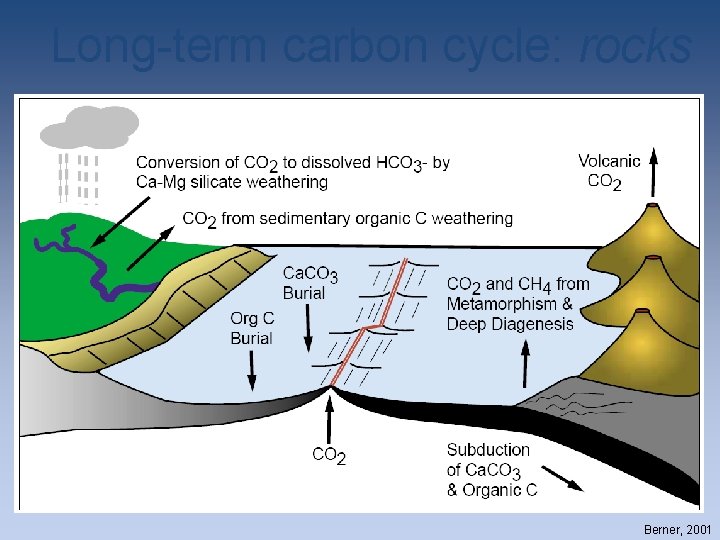
Long-term carbon cycle: rocks Berner, 2001
50 million years ago (50 MYA) Earth was ice-free. Atmospheric CO 2 amount was of the order of 1000 ppm 50 MYA. Atmospheric CO 2 imbalance due to plate tectonics ~ 10 -4 ppm per year. hyperthermals 41 k-100 k & amplitude change: Increase in Antarctic ice Opening of the Drake passage isolating Antarctica and further drop in CO 2 Azolla sequestering event Azolla event: ~ 49 Ma Changes in W. Pacific/Indian Ocean and/or closing of Isthmus of Panama
So – what changed?
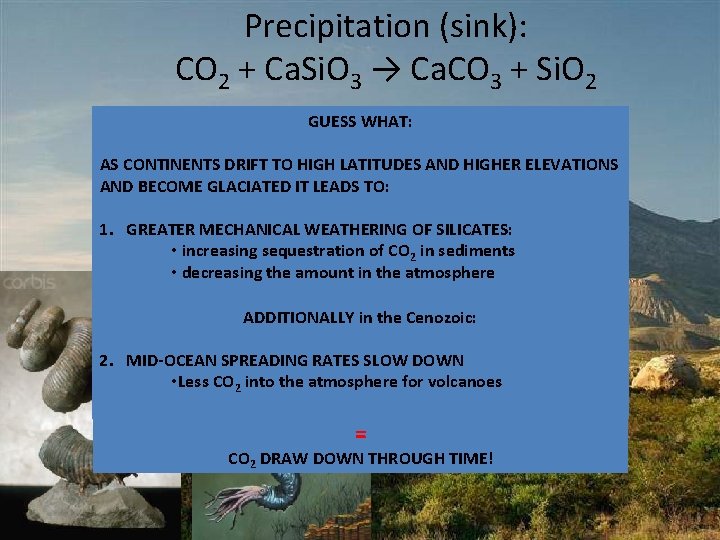
Precipitation (sink): CO 2 + Ca. Si. O 3 → Ca. CO 3 + Si. O 2 GUESS WHAT: AS CONTINENTS DRIFT TO HIGH LATITUDES AND HIGHER ELEVATIONS AND BECOME GLACIATED IT LEADS TO: 1. GREATER MECHANICAL WEATHERING OF SILICATES: • increasing sequestration of CO 2 in sediments • decreasing the amount in the atmosphere ADDITIONALLY in the Cenozoic: 2. MID-OCEAN SPREADING RATES SLOW DOWN • Less CO 2 into the atmosphere for volcanoes = CO 2 DRAW DOWN THROUGH TIME!
2. Rates of change
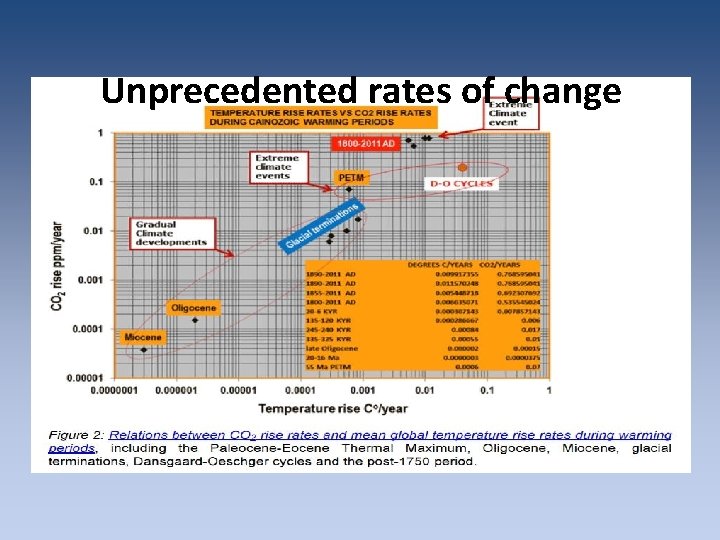
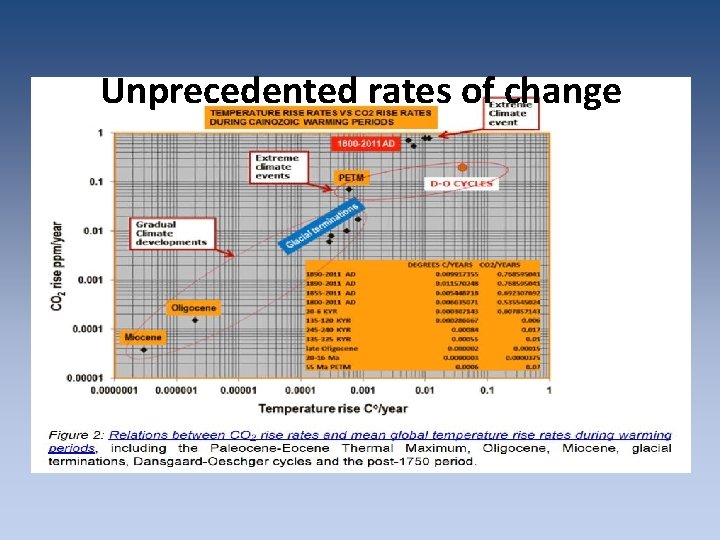
Unprecedented rates of change
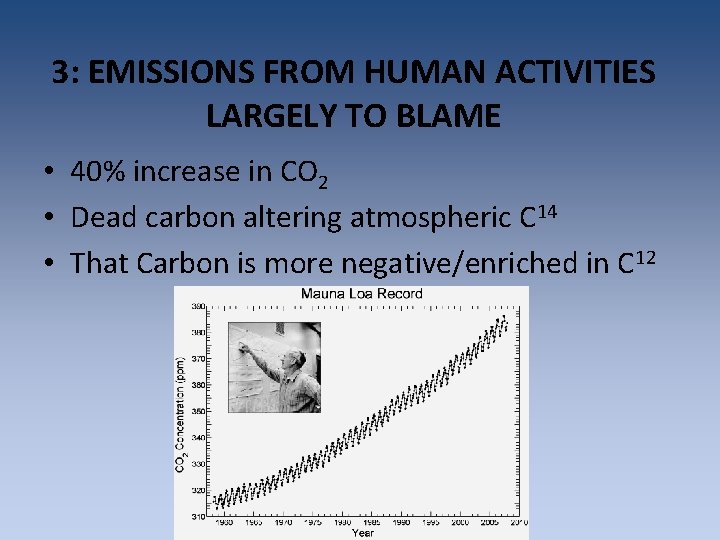
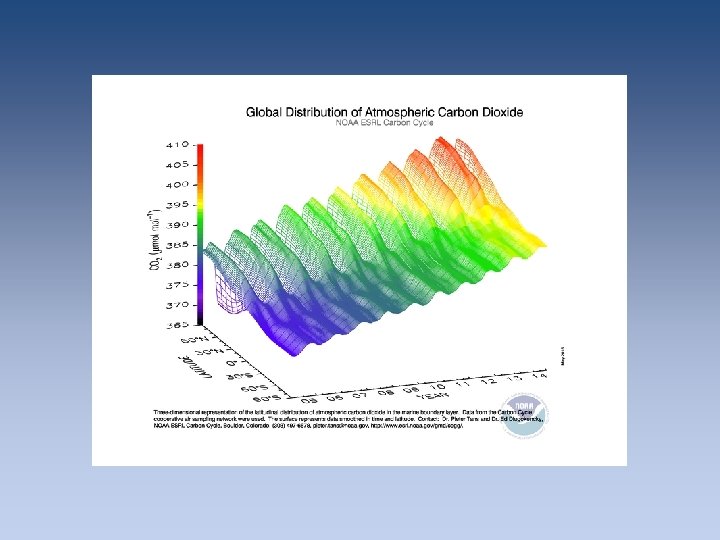
3: EMISSIONS FROM HUMAN ACTIVITIES LARGELY TO BLAME • 40% increase in CO 2 • Dead carbon altering atmospheric C 14 • That Carbon is more negative/enriched in C 12
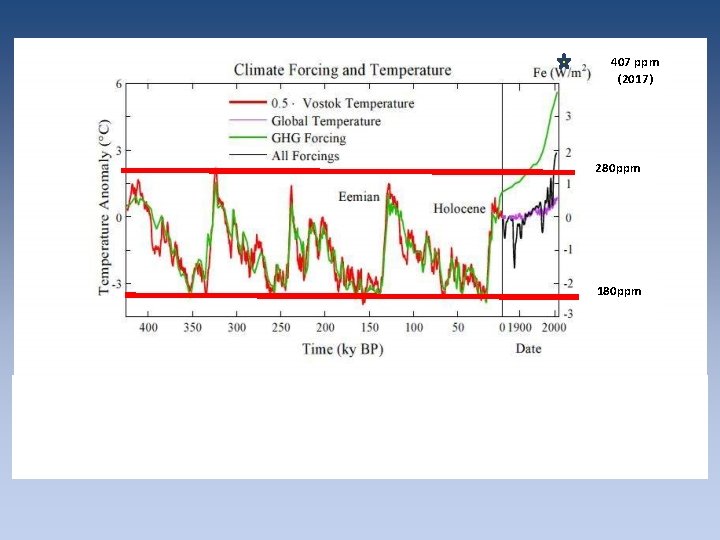
407 ppm (2017) 280 ppm 180 ppm
Climate Changes from Ocean Sediment Cores, since 5 Ma. Milankovitch Cycles 41 K 5. 0 Ma 4. 0 Ma 3. 0 Ma 2. 0 Ma 100 K 1. 0 Ma When CO 2 levels get below ~400 -600 ppm Orbital parameters become more important than CO 2 0
Paleocene/Eocene Thermal Maximum PETM • AN OCEAN ACIDIFICATION EVENT
Paleocene-Eocene Thermal Maximum - PETM hyperthermals Azolla event: ~ 49 Ma
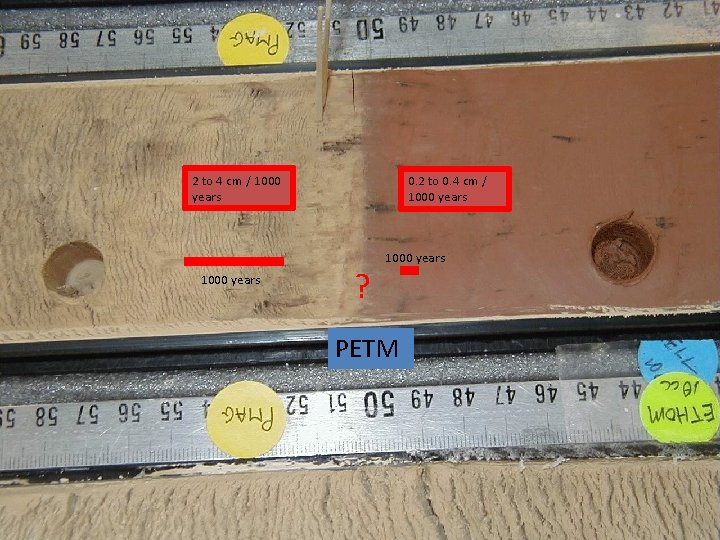
2 to 4 cm / 1000 years 0. 2 to 0. 4 cm / 1000 years ? 1000 years PETM
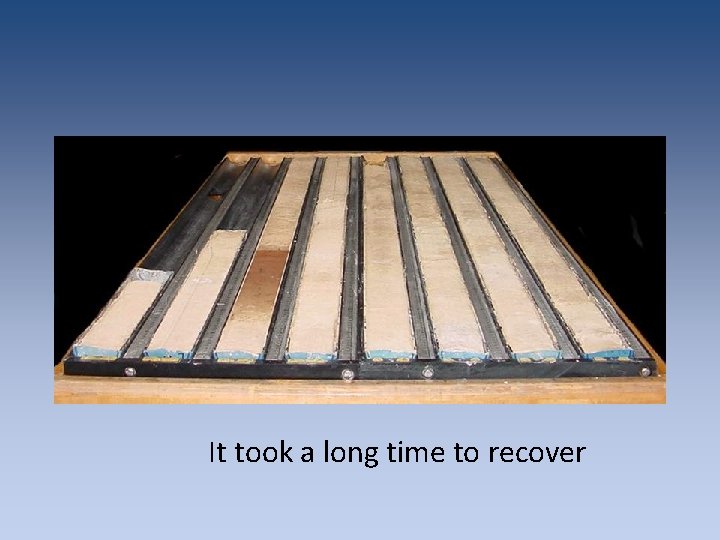
It took a long time to recover
The Azolla event • AN OCEAN SEQUESTRATION EVENT
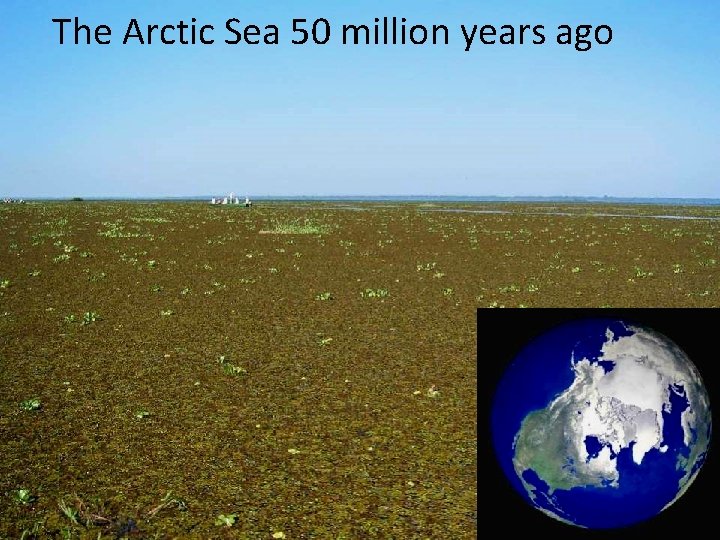
The Arctic Sea 50 million years ago
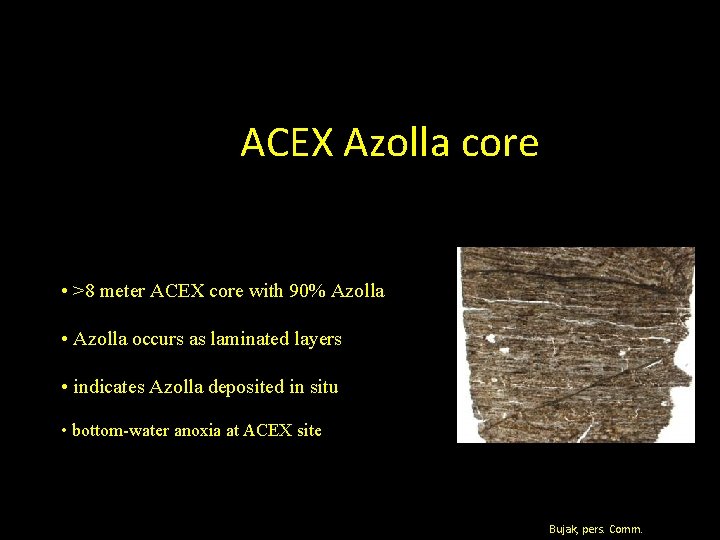
ACEX Azolla core • >8 meter ACEX core with 90% Azolla • Azolla occurs as laminated layers • indicates Azolla deposited in situ • bottom-water anoxia at ACEX site Bujak, pers. Comm.
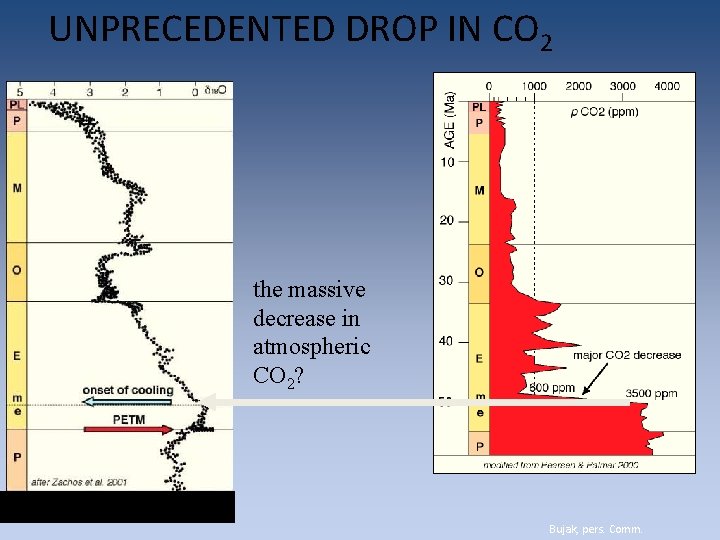
UNPRECEDENTED DROP IN CO 2 the massive decrease in atmospheric CO 2? Bujak, pers. Comm.
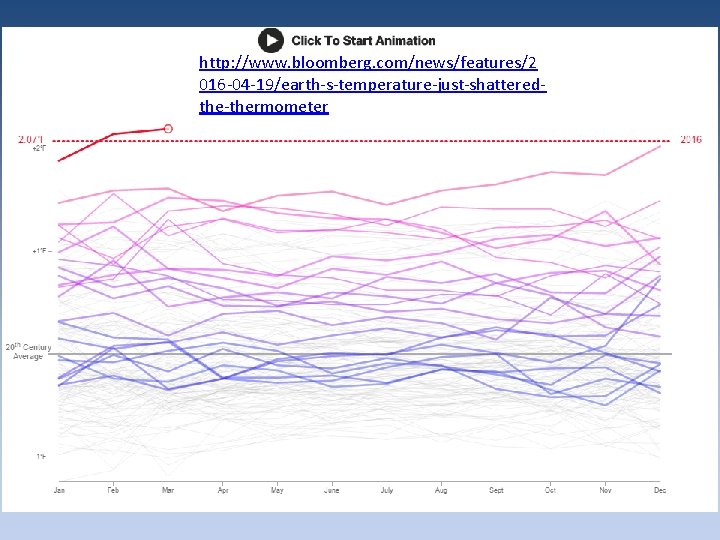
http: //www. bloomberg. com/news/features/2 016 -04 -19/earth-s-temperature-just-shatteredthe-thermometer
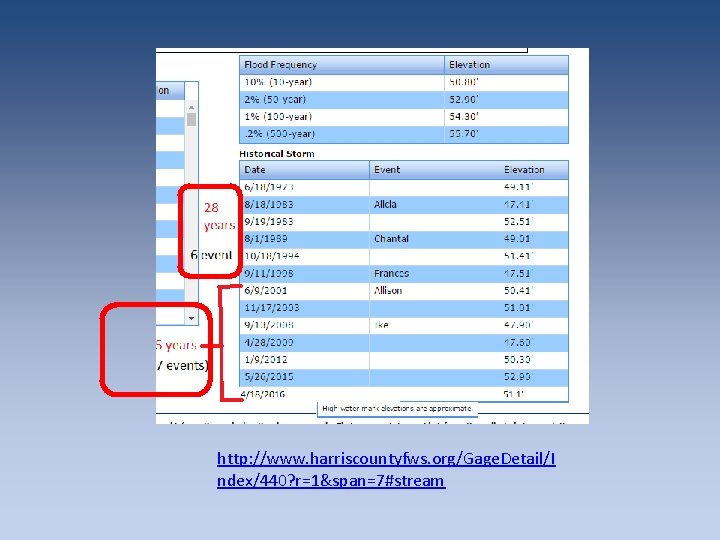
http: //www. harriscountyfws. org/Gage. Detail/I ndex/440? r=1&span=7#stream
3. Proxies that tell us of climate records
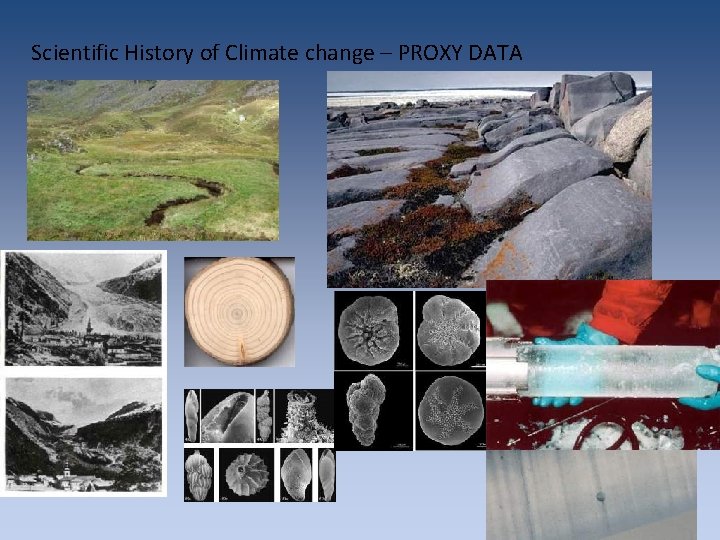
Scientific History of Climate change – PROXY DATA
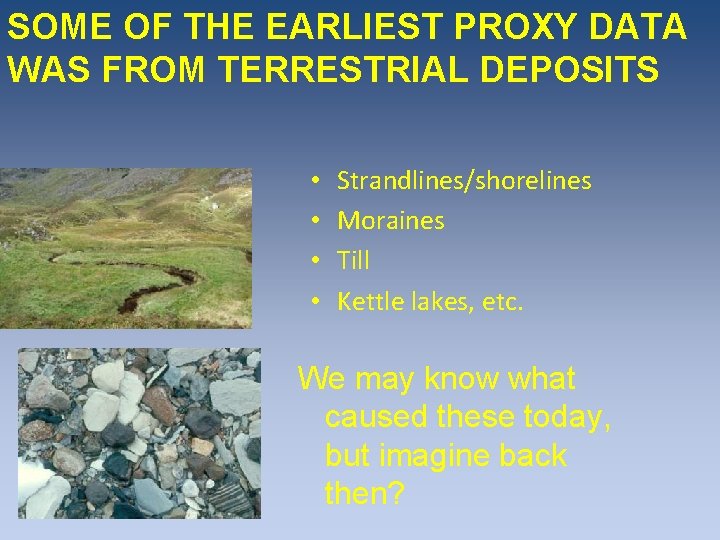
SOME OF THE EARLIEST PROXY DATA WAS FROM TERRESTRIAL DEPOSITS • • Strandlines/shorelines Moraines Till Kettle lakes, etc. We may know what caused these today, but imagine back then?
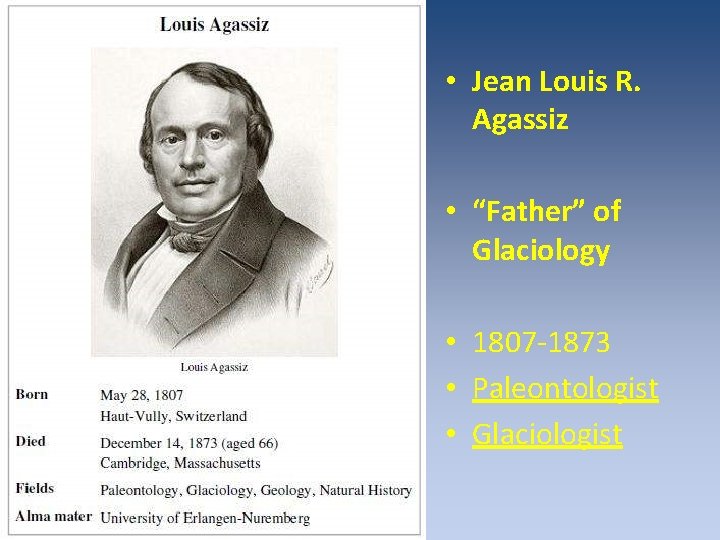
IT’S THE INTERPRETATION THAT’S NOT ALWAYS CORRECT Darwin observed ancient Alpine shorelines: interpreted as ocean shoreline Agassiz – later correctly interpreted as ice- dammed lake-shore strandlines/shoreline
• Jean Louis R. Agassiz • “Father” of Glaciology • 1807 -1873 • Paleontologist • Glaciologist
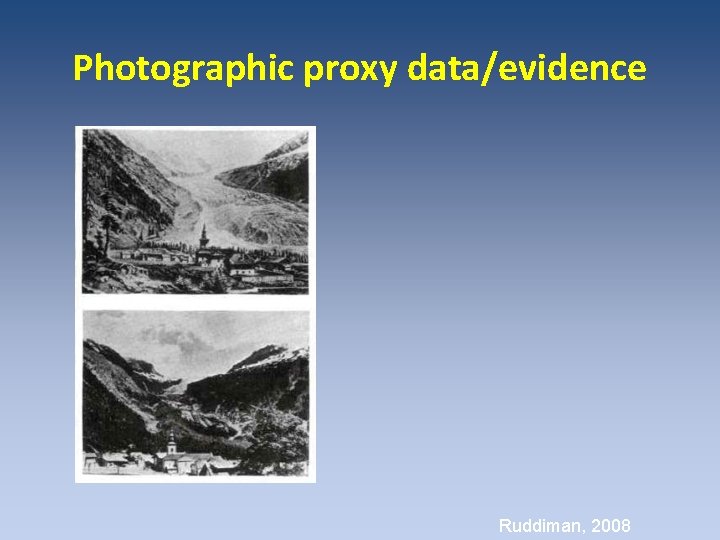
Photographic proxy data/evidence Ruddiman, 2008
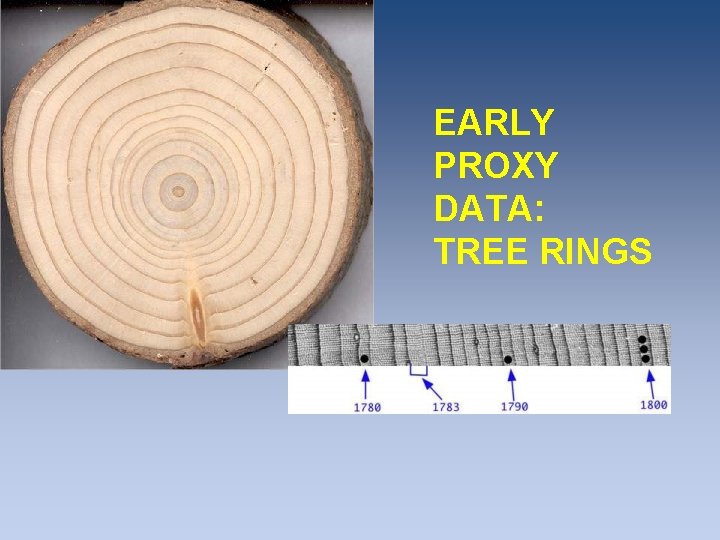
EARLY PROXY DATA: TREE RINGS
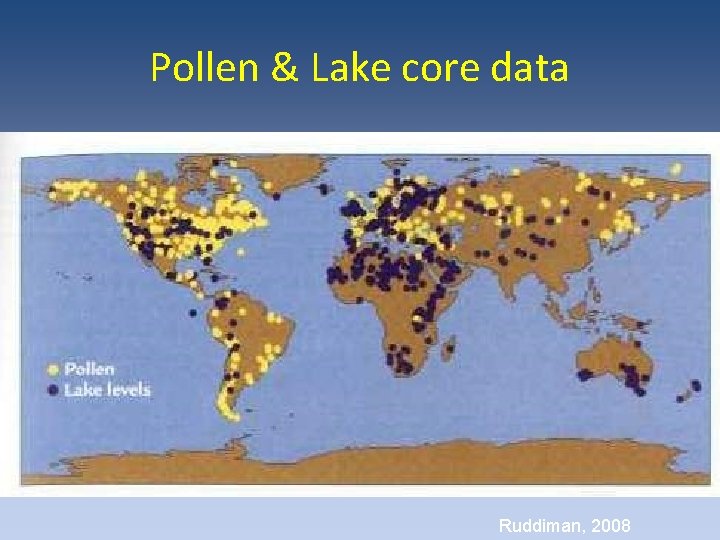
Pollen & Lake core data Ruddiman, 2008
PROXY DATA: POLLEN DATA
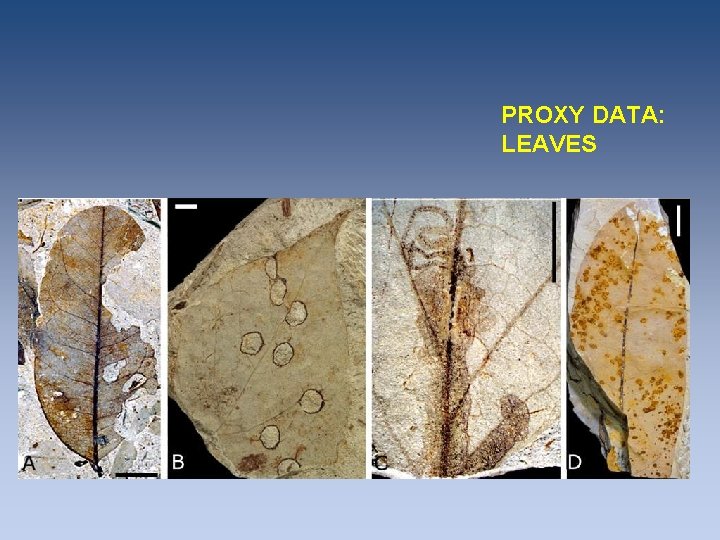
PROXY DATA: LEAVES
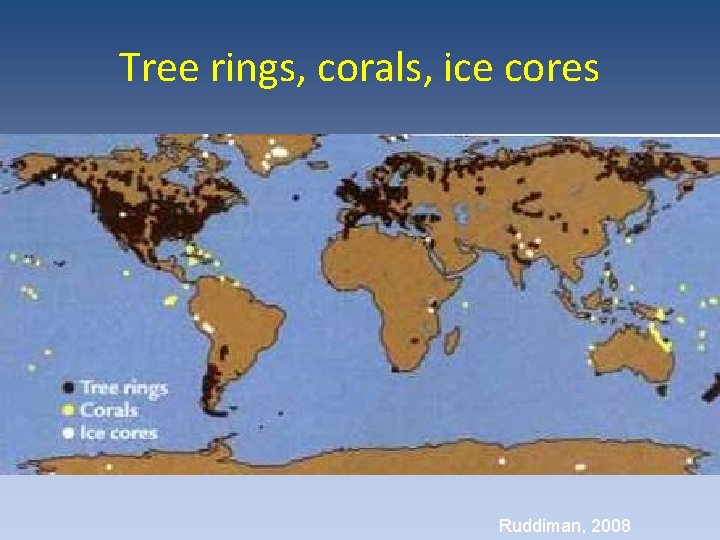
Tree rings, corals, ice cores Ruddiman, 2008
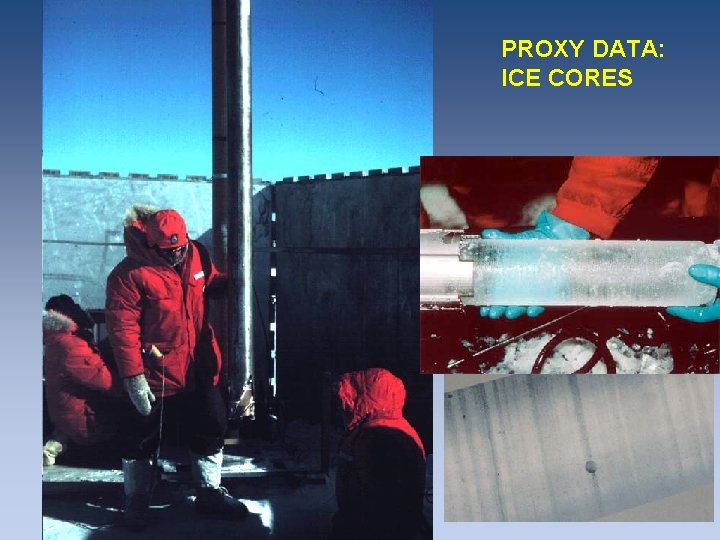
PROXY DATA: ICE CORES
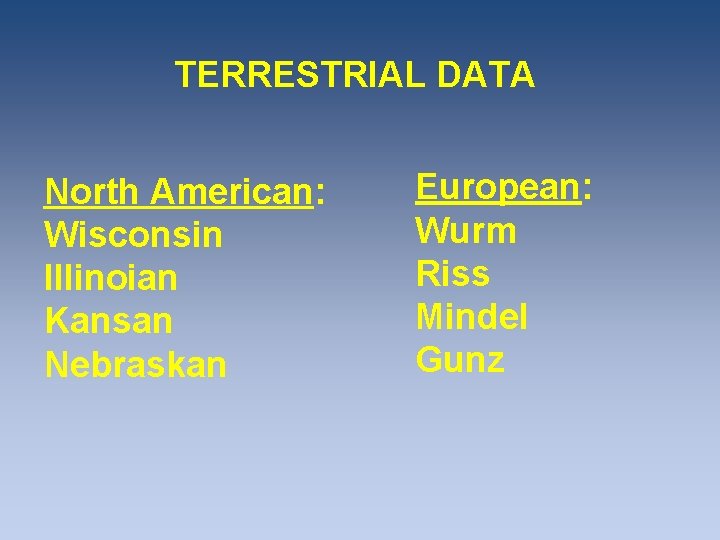
TERRESTRIAL DATA North American: Wisconsin Illinoian Kansan Nebraskan European: Wurm Riss Mindel Gunz
LATER EVIDENCE CAME FROM THE MARINE RECORD NOT WITHOUT IT’S PROBLEMS, BUT MORE COMPLETE
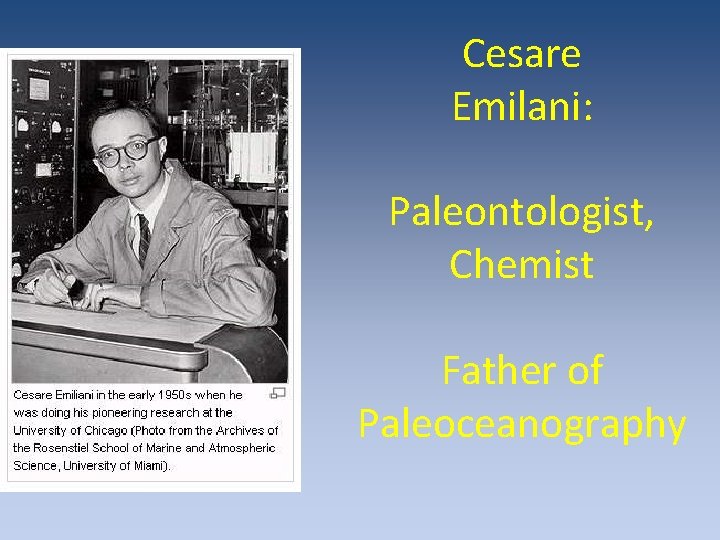
Cesare Emilani: Paleontologist, Chemist Father of Paleoceanography
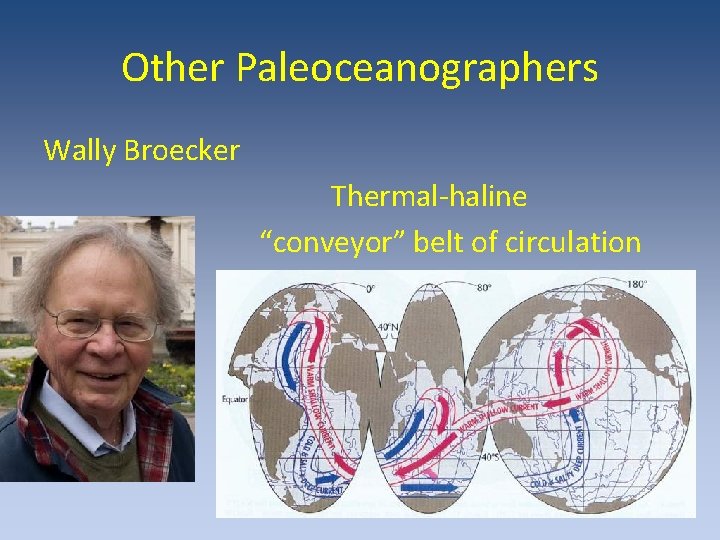
Other Paleoceanographers Wally Broecker Thermal-haline “conveyor” belt of circulation
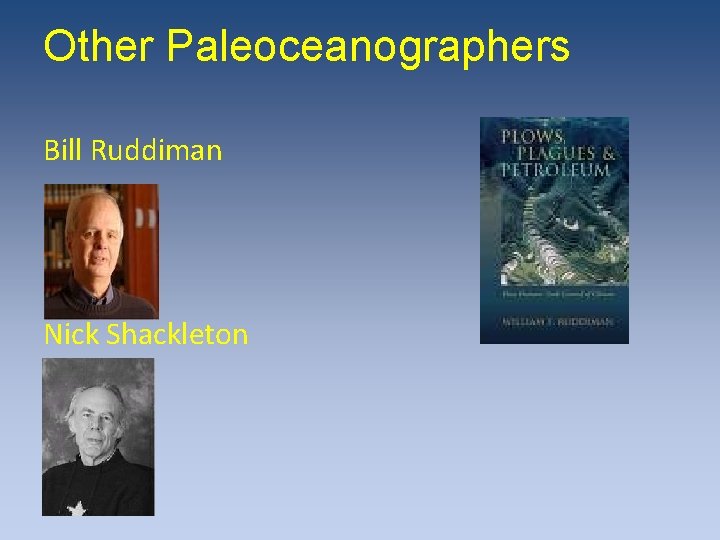
Other Paleoceanographers Bill Ruddiman Nick Shackleton
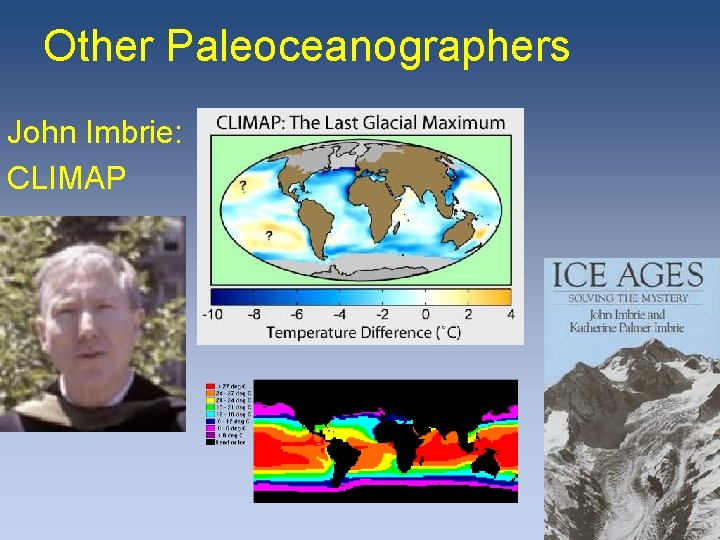
Other Paleoceanographers John Imbrie: CLIMAP
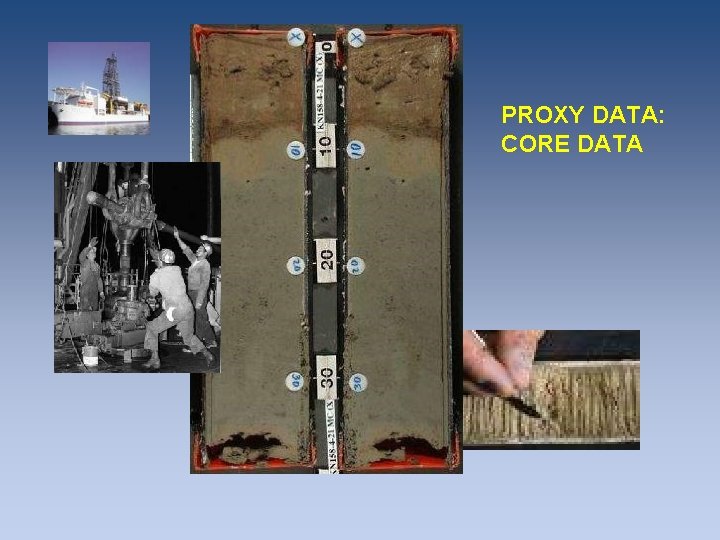
PROXY DATA: CORE DATA
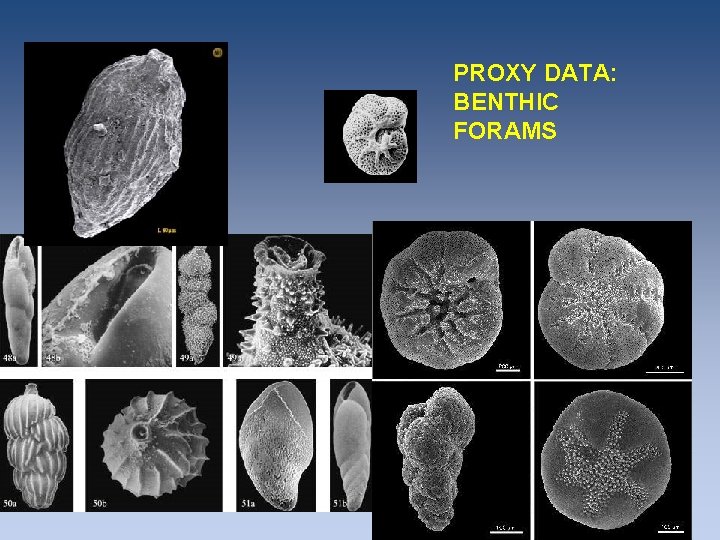
PROXY DATA: BENTHIC FORAMS
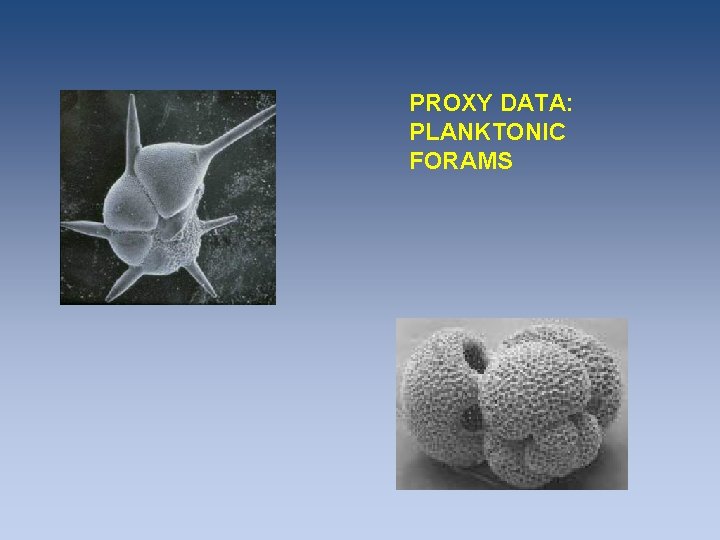
PROXY DATA: PLANKTONIC FORAMS
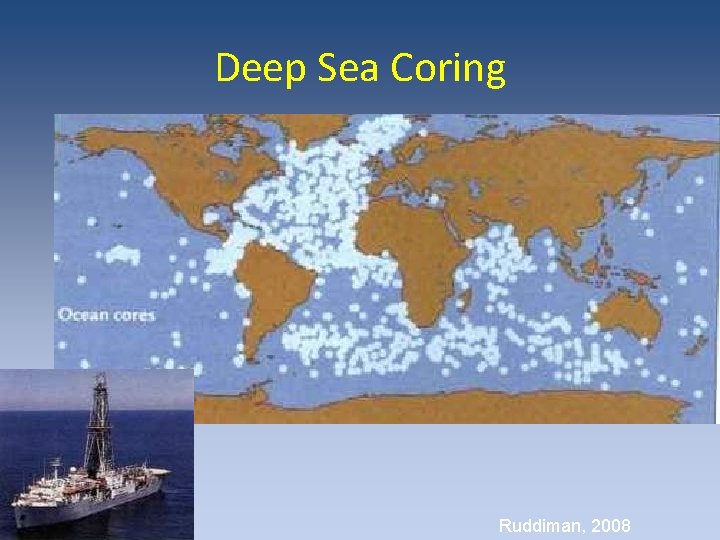
Deep Sea Coring Ruddiman, 2008
Empirical: real measured data in the modern day
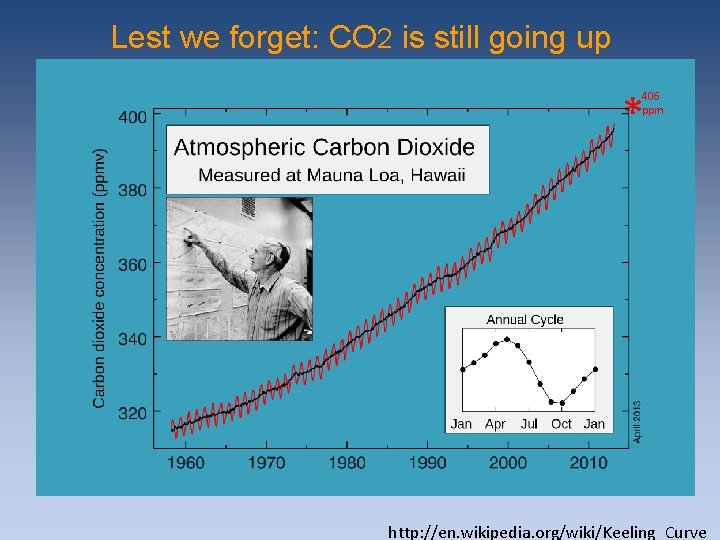
Lest we forget: CO 2 is still going up * 406 ppm http: //en. wikipedia. org/wiki/Keeling_Curve
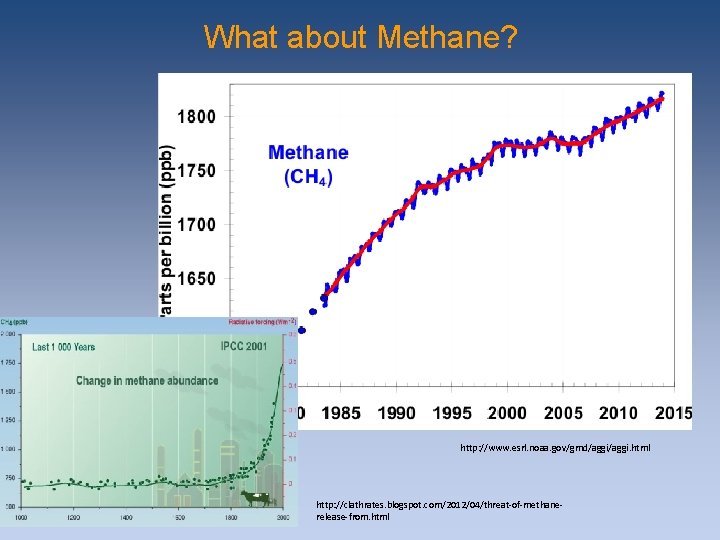
What about Methane? http: //www. esrl. noaa. gov/gmd/aggi. html http: //clathrates. blogspot. com/2012/04/threat-of-methanerelease-from. html
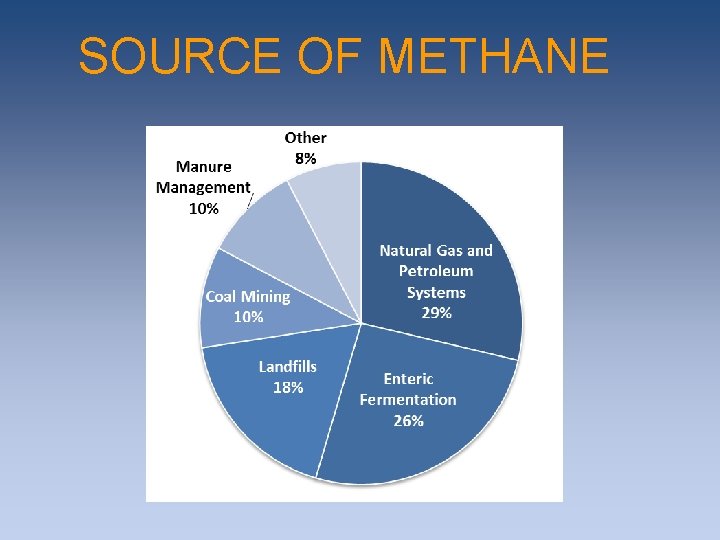
SOURCE OF METHANE
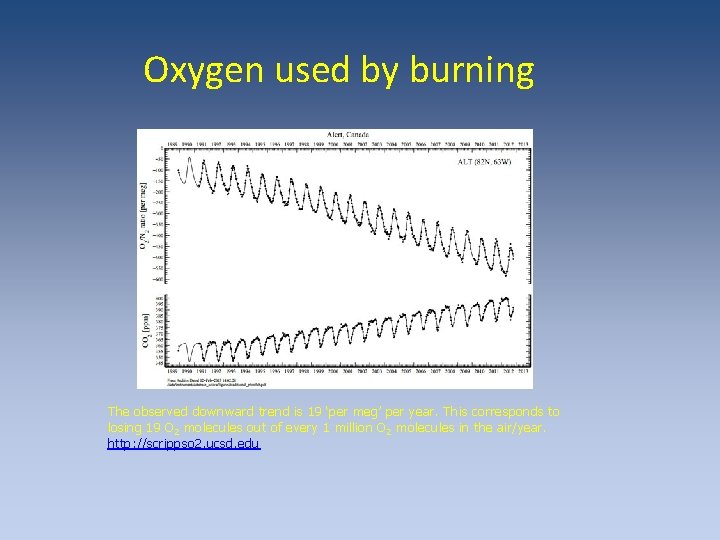
Oxygen used by burning The observed downward trend is 19 ‘per meg’ per year. This corresponds to losing 19 O 2 molecules out of every 1 million O 2 molecules in the air/year. http: //scrippso 2. ucsd. edu
WE WILL RESUME HERE 4/27
4. Ocean Acidification
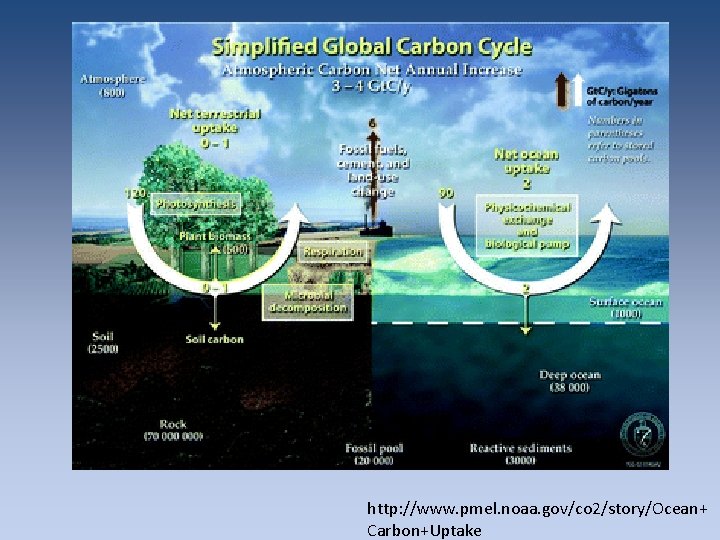
http: //www. pmel. noaa. gov/co 2/story/Ocean+ Carbon+Uptake
Ocean acidification • Web page post Monday October , 2015 (and fb) • Let’s start with a video: – Ocean acidification. BASIC: https: //youtu. be/W 1 TZ 8 g 8 JYVU – AND INTERMEDIATE LEVEL – David Attenborough and others https: //youtu. be/a. Yr. LSrg. Wu 0 Y from: – Ocean acidification: global warming's evil twin: • http: //www. skepticalscience. com/ocean-acidificationglobal-warming. htm choose basic or intermediate
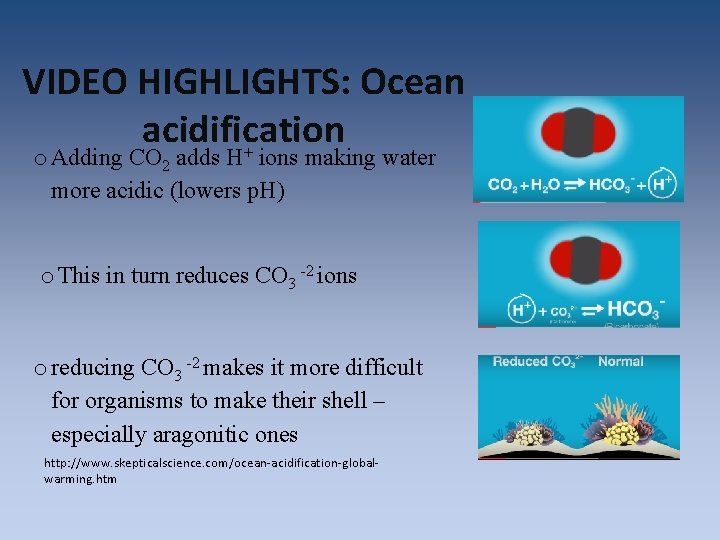
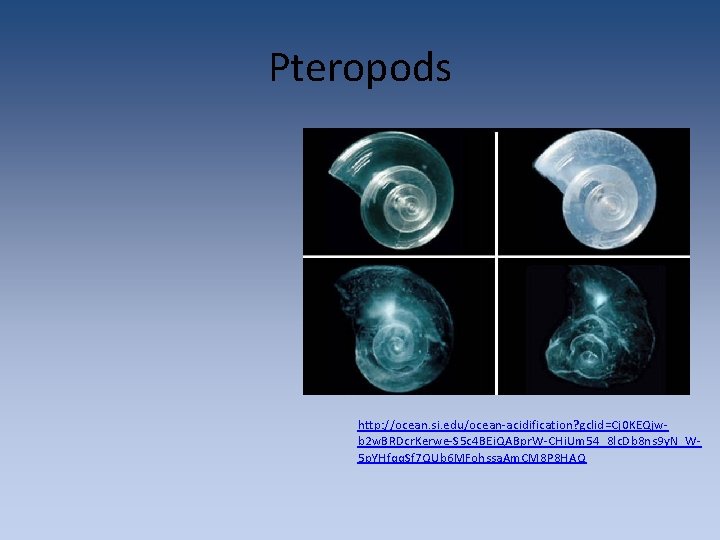
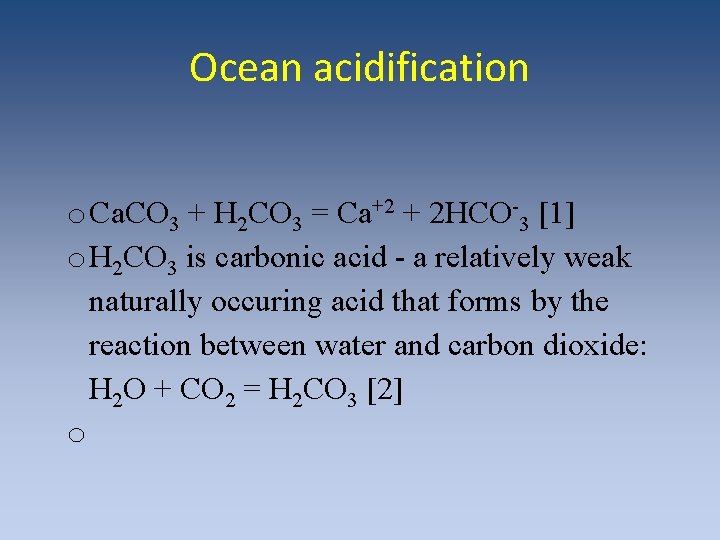
VIDEO HIGHLIGHTS: Ocean acidification o Adding CO 2 adds H+ ions making water more acidic (lowers p. H) o This in turn reduces CO 3 -2 ions o reducing CO 3 -2 makes it more difficult for organisms to make their shell – especially aragonitic ones http: //www. skepticalscience. com/ocean-acidification-globalwarming. htm
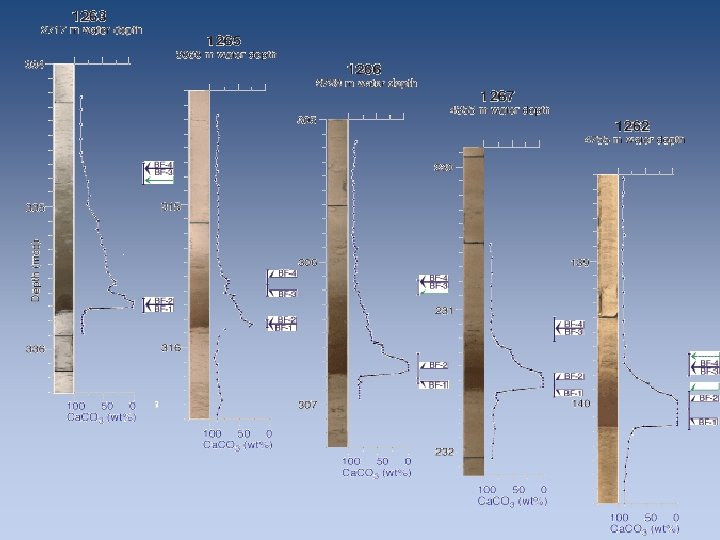
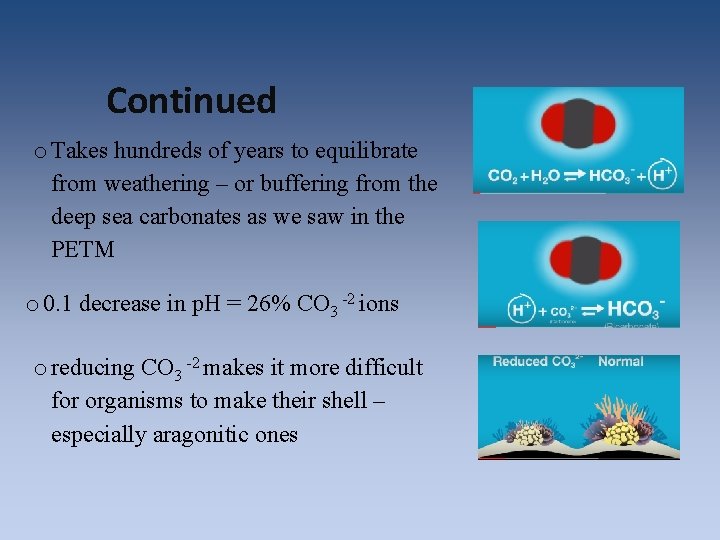
Continued o Takes hundreds of years to equilibrate from weathering – or buffering from the deep sea carbonates as we saw in the PETM o 0. 1 decrease in p. H = 26% CO 3 -2 ions o reducing CO 3 -2 makes it more difficult for organisms to make their shell – especially aragonitic ones
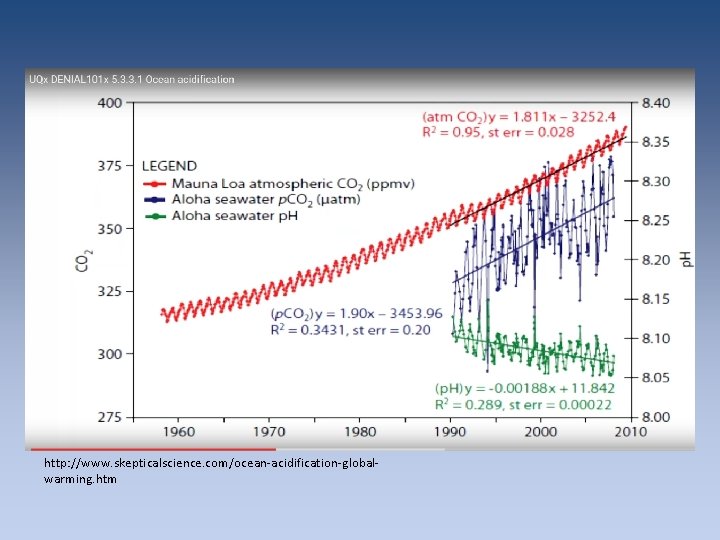
http: //www. skepticalscience. com/ocean-acidification-globalwarming. htm
Pteropods http: //ocean. si. edu/ocean-acidification? gclid=Cj 0 KEQjwb 2 w. BRDcr. Kerwe-S 5 c 4 BEi. QABpr. W-CHi. Um 54_8 lc. Db 8 ns 9 y. N_W 5 p. YHfqq. Sf 7 QUb 6 MFohssa. Am. CM 8 P 8 HAQ
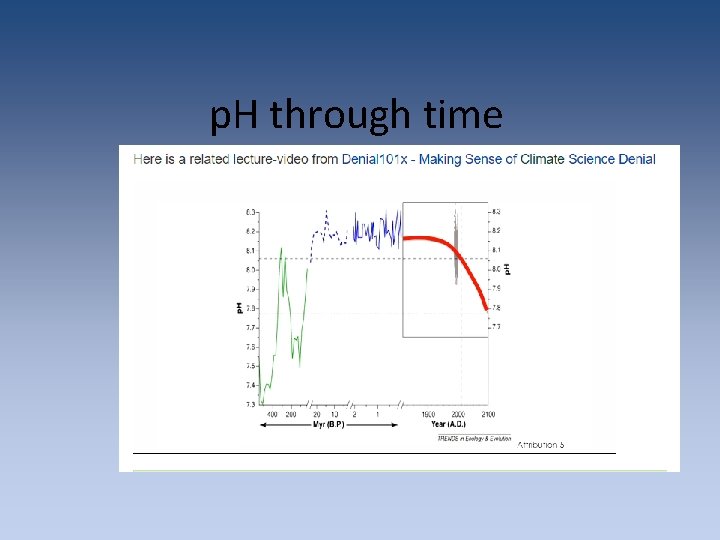
p. H through time
Ocean acidification o Ca. CO 3 + H 2 CO 3 = Ca+2 + 2 HCO-3 [1] o H 2 CO 3 is carbonic acid - a relatively weak naturally occuring acid that forms by the reaction between water and carbon dioxide: H 2 O + CO 2 = H 2 CO 3 [2] o
Unprecedented rates of change
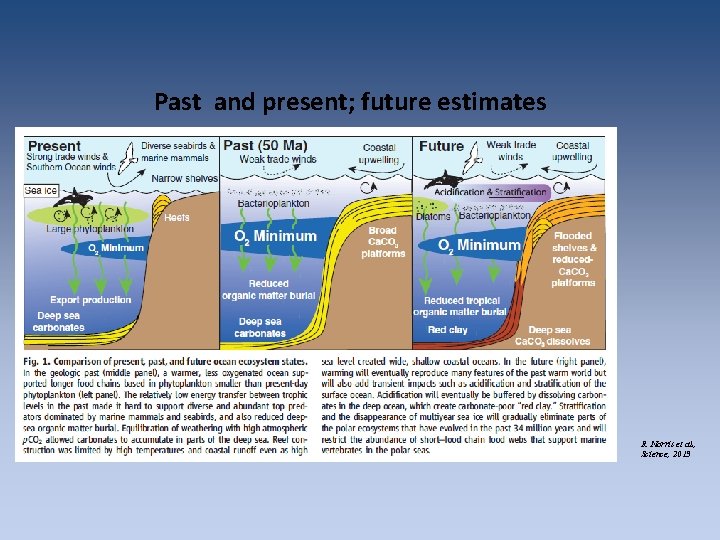
Past and present; future estimates R. Norris et al. , Science, 2013
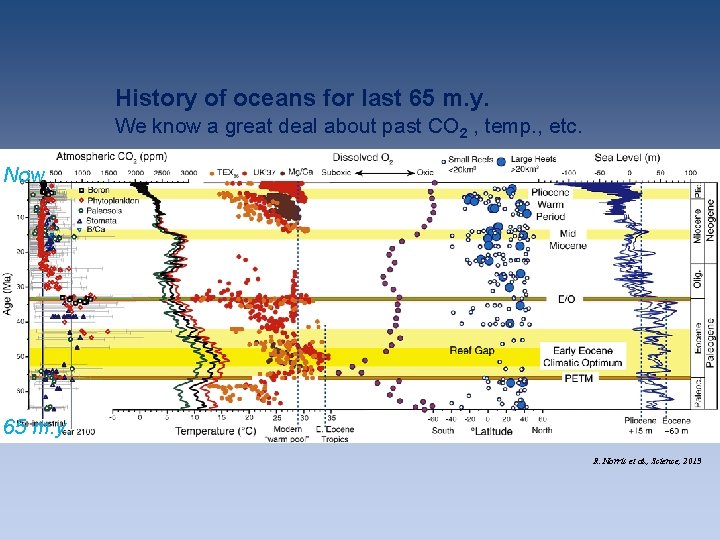
History of oceans for last 65 m. y. We know a great deal about past CO 2 , temp. , etc. Now 65 m. y. R. Norris et al. , Science, 2013
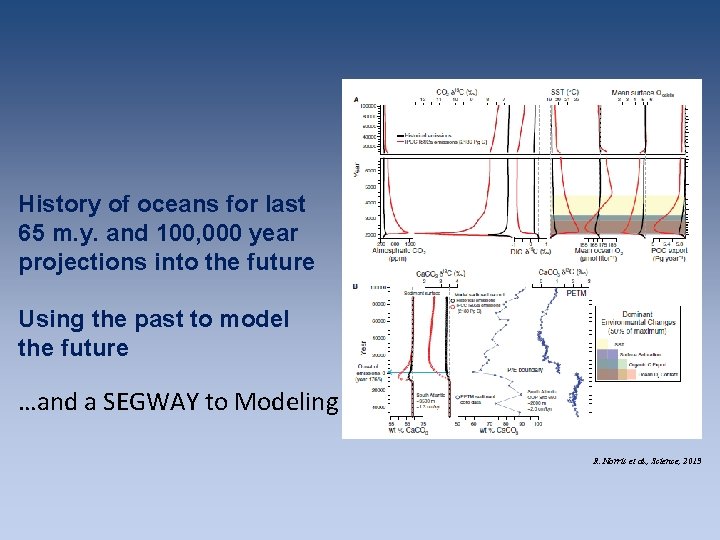
History of oceans for last 65 m. y. and 100, 000 year projections into the future Using the past to model the future …and a SEGWAY to Modeling R. Norris et al. , Science, 2013
Full list of Videos from Skeptical Science http: //www. skepticalscience. com/denial 101 x-videosand-references. html
5. Modeling
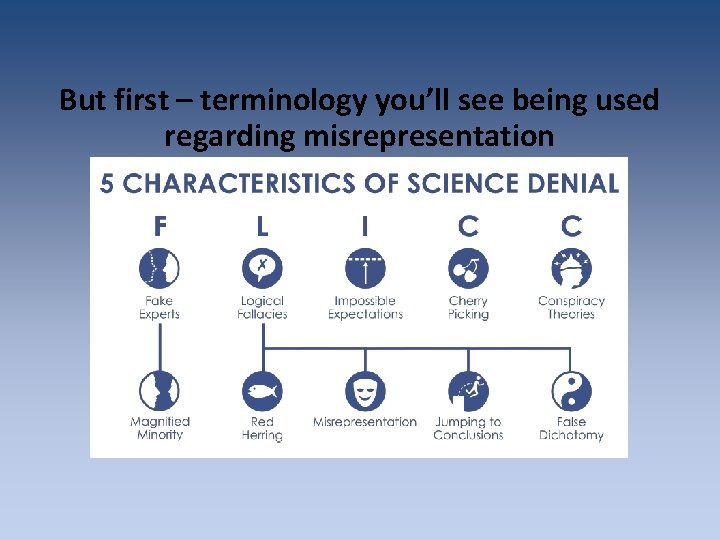
But first – terminology you’ll see being used regarding misrepresentation
Models – 2 videos Principles that models are built on – view today (4: 43 minutes) https: //www. youtube. com/watch? v=m. YU 2 uaw. YPl. E&feature=youtu. b e From the experts: Climate models – leaving it for you to view at your leisure: 10: 30 minutes https: //www. youtube. com/watch? v=PZo 1 TYpsy 2 U&feature=youtu. be NOAA’s Science On a Sphere (SOS) http: //sos. noaa. gov/What_is_SOS/index. html ; used at DMNS where I’ve been co-developing a climate change playlist, soon to be released. In the meantime see http: //spaceodyssey. dmns. org/exhibitsprograms/interactivesexhibits/sos. aspx
Full list of Videos from Skeptical Science http: //www. skepticalscience. com/denial 101 x-videosand-references. html
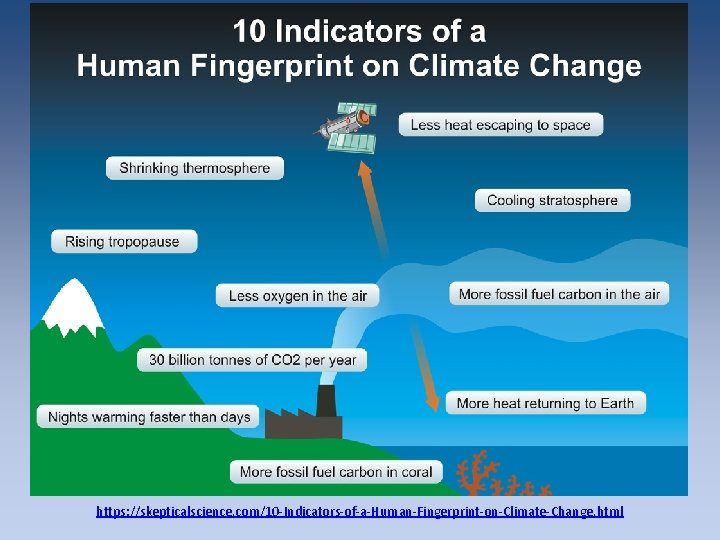
https: //skepticalscience. com/10 -Indicators-of-a-Human-Fingerprint-on-Climate-Change. html
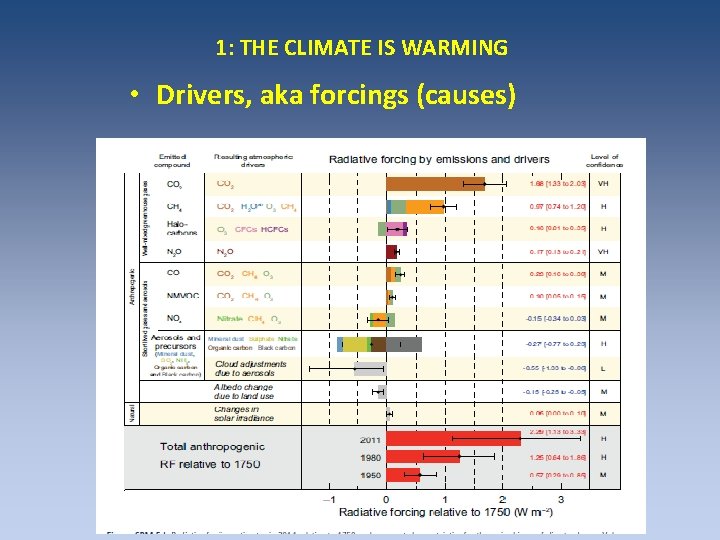
1: THE CLIMATE IS WARMING • Drivers, aka forcings (causes)
Intergovernmental Panel on Climate Change IPCC • http: //www. ipcc. ch/report/ar 5/ - three working groups: 1. WG I: Physical Science Basis – what we’ve been dealing with thusfar • Especially headlines for policy makers and chapters 5 (paleoclimate), 6 (Carbon) and 9 (models) that can be found at http: //denverclimatestudygroup. com/? page_id=63 2. WG II: Impacts, Adaptations and Vulnerability; Part A: Global and Sectoral Aspects 3. WG III: Mitigation of Climate change – in coming weeks • Synthesis report – my other Power. Point based on http: //www. ipcc. ch/report/ar 5/syr/
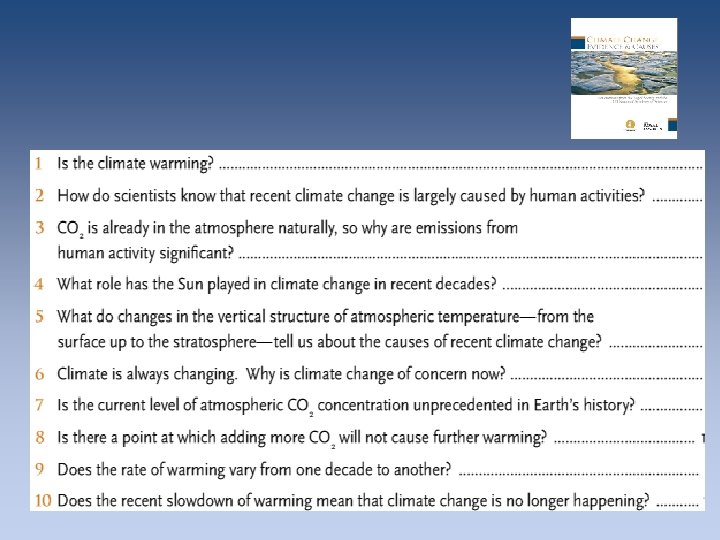
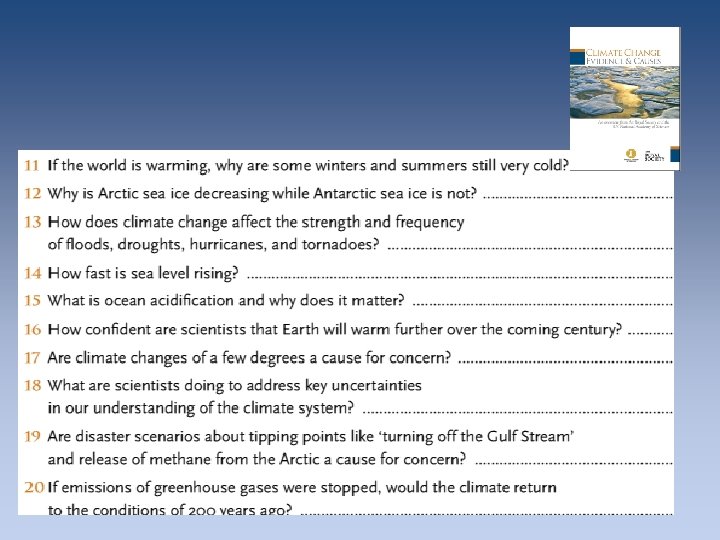
Joint U. S. National Academy of Science and Royal Society 20 -point summary: • OR: Joint U. S. National Academy of Science and Royal Society 20 -point summary: 20 -point Climate-Change Summary (pdf) – summarized in the following 3 slides
Joint U. S. National Academy of Science and Royal Society 20 -point summary: 20 Q/As to follow this slide
Joint U. S. National Academy of Science and Royal Society 20 -point summary: • FOR ANSWERS SEE MY OTHER Power. Point • Here http: //denverclimatestudygroup. com/wpcontent/uploads/2015/10/Belanger-joint-NAS-Royal. Society-answers-to-20 -points. pdf
• If we are so concerned about leaving a national debt to our children and grandchildren, and BTW we should be, shouldn’t we put the costs of climate change as part of that equation? • For those that don’t accept climate change maybe it would be a good thing to limit CO 2 into the atmosphere anyway, especially at the rates we are putting it into the atmosphere – BECAUSE OF OCEAN ACIDIFICATION issues and the law of unintended consequences!
A Climate knowledge quiz: • http: //www. csmonitor. com/Environme nt/2014/0827/Climate-change-Is-youropinion-informed-by-science-Take-ourquiz/Gas