Dry Law and Homicide Evidence from the So


 perfect empirical opportunity n High crime environment: (almost) any policy")
 perfect empirical opportunity n Same metropolitan area, over a “short”")
 perfect empirical opportunity n One little problem though: n Adoption")
, 2 AM-6")


 n Establishment of municipal")


 model for within. Accounts")


- Slides: 42
Dry Law and Homicide: Evidence from the São Paulo Metropolitan Area
The question n Between March-01 and August-04, 16 out of 39 municipalities in the São Paulo Metropolitan Area (SPMA) passed laws restricting the sales of recreational alcohol n Is it an effective policy to fight the ultimate form of violent crime, homicide?
Why is it interesting? Related Literature n Policy: n Large number of cities adopted/plan to adopt such laws n Bogotá, Colombia first prominent example. Many other Brazilian cities followed the example in the SPMA n They are costly in terms of welfare n As Mr. Franklin would probably argue n Surprisingly little evidence that this type of intervention works n Not even benefit side clear so far n Hard to underestimate the costs of violence, though n A simple policy intervention
Why is it interesting? Related literature n Economics of Crime: n Against outright prohibition works (US in the 1920 Miron and Zweibel 1991, 1995) n n n Not even clear whether consumption decreases Outright prohibition may induce substitution towards “heavier stuff” [Thorton, 1998] Not clear whether price oriented interventions (taxation) works (Miron 1998, JDI)
Why is it interesting? n Economics of Crime n SPMA type interventions n Focused on recreational alcohol consumption § Not radical enough to trigger substitution effects? § Not radical enough to produce illegal activities to circumvent prohibition? n Alcohol and social interaction: § Complements in the production of nasty behavior? n May well be economical from a welfare perspective: high crime environments
Why is it interesting? n Criminology literature n Literature 1: direct individual evidence from felons n n Mc. CLelland et alli’s classic The Drinking Man Direct police report data on rates of intoxication among arrestees § Gawryszewski et alli [2005]: toxicological data from murder victims’ corpses
Why is it interesting? n Literature 1 n Problems: n Omitted determining factors § Common factors determining alcohol (ab)use and criminal behavior § Child abuse § Psychological disturbances n Selection § Booking and inmate data: substance abusers more likely to get caught § Then drinking good for enforcement?
Why is it interesting? n Literature 2: is the alcohol-crime nexus amplified by social interaction? n Micro data evidence n n n British Crime Survey 2001/2002: 21% of all night-time violent incidents in or around pubs Stockwell et alli [2003] with Australian data: bars preferred venue of alcohol purchase for felons prior to committing violent crimes Cross-sectional local variation in the presence of bars and crime rates: ambiguous results C Roncek and Maier [1991]: cross-sectional data on Cleveland residential blocks C Scribner et alli [1995], LA counties: assaults associated with presence of bars even after controlling for country demographics D Gorman et alli [1998], New Jersey counties: no effect after controlling for demgraphics
Why is it interesting? n Literature 2: is the alcohol-crime nexus amplified by social interaction? n Problems n Cross-sectional local variation in the presence of bars and crime rates enough? n Crime, alcohol consumption, and bars occur concurrently with factors such as § Poverty? Low education? No other forms of entertainment? § If result arises: not convincing → hard to control § If results does not arise → standard errors should be large
SPMA dry laws: (almost) perfect empirical opportunity n High crime environment: (almost) any policy worth trying n 2002 monthly murder rate: 3. 64 per 100 thd n 2002 US rank: 2 nd. Slightly below DC with 3. 81 per 100 thd. NYC in its peak: 3. 56 per 100 thd n Cross-sectional and time-series variation in legislation on operations of bars n n Bogotá had uniform adoption n Pure time-series inferior Superior to pure cross-section variation used in the criminology literature
SPMA dry laws: (almost) perfect empirical opportunity n Same metropolitan area, over a “short” period of time We start with a minimum level of homogeneity n Subject to approximately the same aggregate economic and social shocks n n Not obvious that it would“work” n Literature not clear n Weak law-and-order environment n Beggar-thy-neighbor effects n The name here for “general equilibrium effects”
SPMA dry laws: (almost) perfect empirical opportunity n One little problem though: n Adoption is a choice of the city n Self-selection § Case and Besley “unnatural” experiments Counterfactual not crystal clear n Few observations on the cross-section dimension n n Propensity score matching procedure to correct for selection suffer from severe micronumerosity (N = 16)
Chronology of events n March-01: Barueri imposes a 11 PM-6 AM (weekdays), 2 AM-6 AM mandatory closing hours for bars n Few exceptions: not located near schools, outside “crime zones” n Most likely to exclude upper-middle class establishments § But in practice almost all were “included”: as of Sep-05, only 50 out of 8000 establishments were exempt
Chronology of events n Several cities followed suit with very similar laws Municipal elections: Out and Nov 2002
Chronology of events
Data n Monthly homicides from Secretaria Estadual de Segurança de SP, Jan-2000/Dec-2004 Includes murders and non-negligent manslaughter in the American classification (no car accidents) n Homicides suffer less from under-reporting n n Cross-reference with hospital (SUS) data confirms very little problem with data (De Mello and Zilberman [2006])
Data n Demographic data from Fundação SEADE and census (2000) n Establishment of municipal secretary of justice, municipal police force from Kahn and Zanetic [2005] n Political data from the state-level electoral authority (TRE-SP)
General strategy n Use the cross-section and time series variation to estimate the effect of implementing the law: Compare the dynamics of homicide in adopting and non-adopting cities n Also use knowledge of the institutions n Argue that counter-factual is not absurd despite adoption being a choice n Argue with empirics and institutions
Adopting cities more violent But were not abnormally violent before adoption No diff in trends Evidence: summary statistics Not sharply distinguishable in terms of No significant population Diff not diff Even then, diff in trends of surprising given not thrilling population adopting more violent Again undistinguishable in levels and trends Diff expected but undistinghuishable No diff in practice Trend if anything goes against
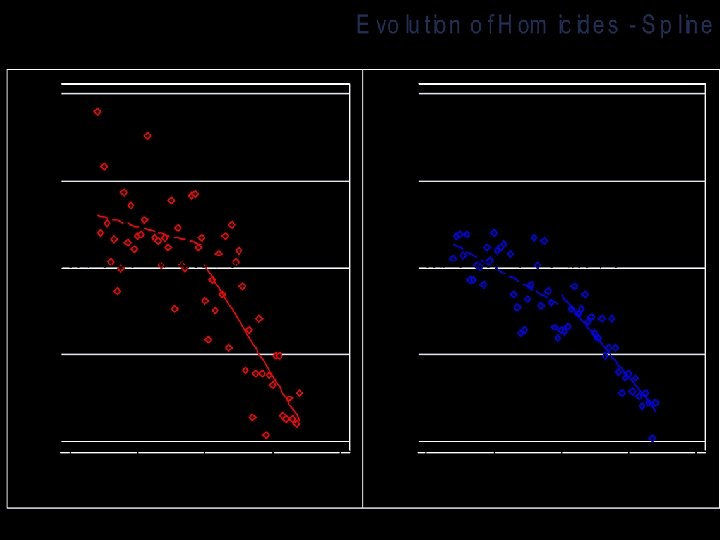
Semi-parametric evidence n Kernel density estimates on residual homicides 18 months before and after adoption in n n Adopting (Red) and non-Adopting (Blue) cities Jul-2002 defines before and after for non-adopting cities n Residuals of regression: Weighted with the average propensity score weight for the city
Evidence: trends Jan-1997 May-2002 Average adoption period
non-Adopting after non-Adopting before Adopting after Adopting before
Controlling for covariates n Difference-in-differences approach n We control for: n Concurrent events such as the establishment of a municipal secretary of justice, and a municipal police force (guarda municipal) n Recent dynamics of homicide n Important since adoption is a choice. Dynamics of homicide can affect both adoption and future crime: § High crime → adoption § High crime today → lower crime tomorrow (mean-reversing process, for instance) n n City fixed effects Period (month) specific effects
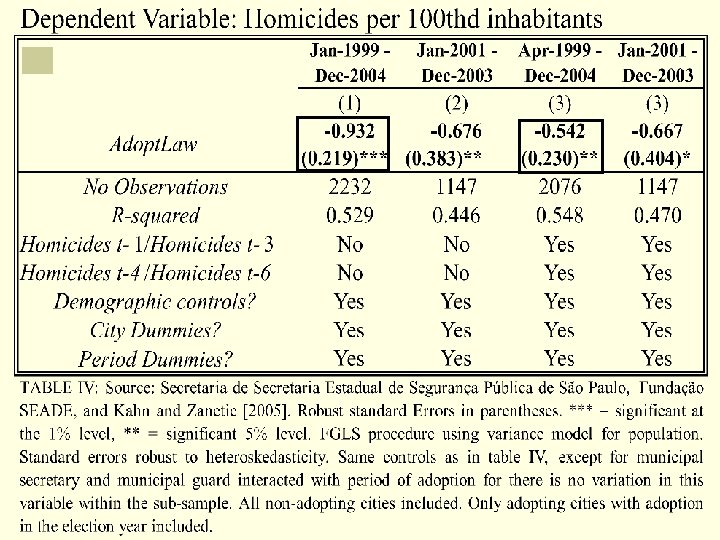
Controlling for covariates n Estimated model: Coefficient of interest Like the interaction term in a Per 100 thd inhabitants normal diff-in-diffs model: assues in adopting cities 2) after Includes: 1) 1 Lags of homicide, Municipal force, 3) adoption municipal secretary of justice; 4) income; 5) population; 6) city specific dummies; 7) month specific dummies
Controlling for covariates n Model for the variance: n Homicide is a relatively rare occurrence. City level data → observations from small cities are very noisy n For more common types of crime, this would not be such a problem
Controlling for covariates n What is in εit that can be dangerous? n Other policy reactions to crime, such as police n n If police indeed responds to crime at the relevant speed then inclusion of lagged homicide will “proxy” for police POLICE DOES NOT RESPOND TO CRIME AT THE RELEVANT SPEED n n City policing is defined by law (no specific periodicity). General goal: maintain an uniform number of policemen per capita Defines battalions size in the short-medium run. Some flexibility between battalions when they cover more than one city, which is the exception § São Paulo has many (more than 30) battalions § A city like Aruja (70 thd inhabitants) has one battalion n Number, however, does not tell all the story § Increase in repression, more street policing less back office? § Probably do not have a short-term impact
Decision to adopt n What determines decision to adopt? n Duration model with the following explanatory variables n Lags of homicide § Do shocks to homicide cause adoption? n n Demographics Data and Data squared § Hazard rates are clearly not constant over time n Base line homicides § Descriptive statistics suggest more violent cities adopted. Earlier as well? n Number of neighbors with law § Imitation? Fear of spillover?
Controlling the But it is stillfor there, Including dynamics of and statistically practically: city level Or 758 ofhomicides =Including 18% homicides in demographics #non. São Caetano and Poá homicides 11% of homicides enforcement annually inindeed the cityin of non-adopting cities neighbors with law become controls dampens effect. . . adopting cities São Paulothe
Fixed-effects model with No model for Accounts forthe panel AR(1) model for within. Accounts for AR(1) Excludes São Variance, more impact on specific AR(1) panel autocorrelation Restricted sample autocorrelation with panel Paulodeviation standard autocorrelation within (Betrand, Duflo and Mullainathan [2004]) panel
A placebo Experiment n Move “adoption date” to 18 moths before
Propensity score weighting n Lack of comparable non-adopting cities and lack of common support may cause bias n Reference n Propensity score weighting “homogenizes” observations n Rosenbaum and Rubin [1983] n Adopting with high propensity and non-adopting with low propensity receive low wieght n We use a modified version of Rosenbaum and Rubin [1983] n n Two few treatment and controls We treat each pair month-city as a potential treatment unit
Trimming the sample n “Homogenizing” adopting and non-adopting cities: similar to “matching” n Procedure proposed by Crump, Hotz, Imbens and Mitnik [WP, 2006] n Exclude all pairs month-city with propensity scores lower than 10% and higher than 90%
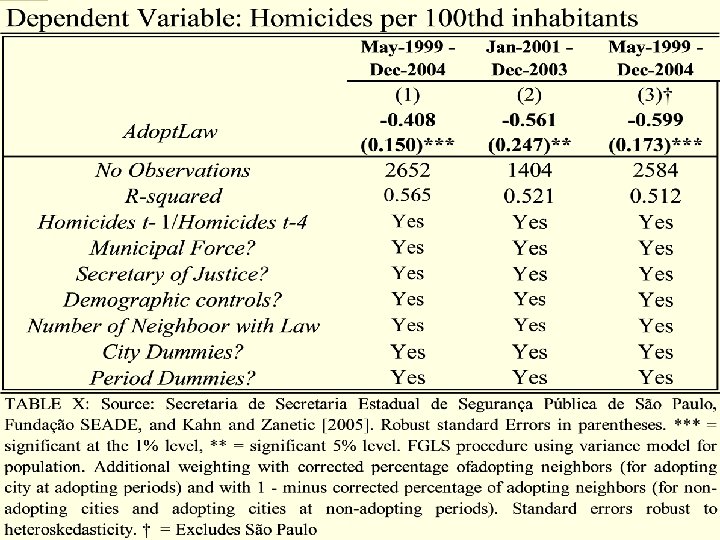
Beggar-thy-neighbor? n Prohibition in one city could just shift crime to the neighbor n The effect arises but overall effect is zero n Important for policy n It is analogous to the so-called “general equilibrium effects” of policy intervention
Beggar-thy-neighbor? n Ideally one would like to: n Restrict the attention to adopting cities with not bordering non-adopting cities n And non-adopting cities with no bordering adopting city n This leave us with too few observations (1 adopting city, Juquitiba) n So we weight: n Adopting month-city pair with a corrected proportion of adopting neighbors n Non-adopting month-city pair with 1 minus a corrected proportion of adopting neighbors
Identification by adotion timing n Use only late adopters as controls By revealed preference very high “propensity” to adopt given evetual adoption n Two sets: n n n Vargem Grande (Dec-03), São Caetano (Jul-04) and Poá (Aug-04), sample up to Dec-03 Embu-Guaçu (Jul-03), Vargem Grande (Dec-03), São Caetano (Jul-04) and Poá (Aug-04), sample up to Jul 03
Exogenous break n See what the standard errors are like in the figure above n Imposes a candidate for structural break in Jul- 2002 (average adoption period) Non-adopting Adopting
Endogenous break Adopting: break at May. Non-adopting: at Nov 2002, -2001, significant not significant n Let the data choose whethere was a structural break and when n n If chooses break after 140 for non-adopting, suspicious If it chooses break too far for adopting too far from 140, especially if before, suspicious n Break can occur in any period τ (starting Jan-2001) estimate: n Break is at:
Conclusion n Data from the São Paulo Metropolitan Area suggest that punctual, focused restriction of recreational sales of alcohol does reduce homicides n Roughly, a reduction between 10% and 20%
Evidence: trends