Dott Marcello Dallio Specialista in formazione in Malattie


 •")


,")


")


- Slides: 28
Dott. Marcello Dallio Specialista in formazione in Malattie dell’Apparato Digerente Tutor: Prof. Alessandro Federico
Prevalenza della NAFLD 20 -33% in adulti-anziani: • Incrementa con l’età; • Più alta negli uomini rispetto alle donne; • Più alta nei soggetti di etnia caucasica rispetto agli ispanici; • Non è significativamente più alta nei pazienti con alterazione della ALT rispetto a quelli senza tale alterazione
La prevalenza della NAFLD è più alta in: • Soggetti obesi (36 -78%) • Pazienti con iperglicemia o diabete (43 -62%) • Pazienti con iperlipemia (45 -65%) • Pazienti con ipertensione (35 -45%) • Pazienti con sindrome metabolica: il rischio di progressione verso stadi più gravi di malattia è significativamente maggiore • Pazienti con infezione da HCV (55%)
L’eziologia del danno epatico sta cambiando: passato, presente e futuro %
Storia Naturale Attenzione: l’HCC insorge su epatopatia metabolica spesso anche prima che essa giunga allo stadio di cirrosi epatica, quindi su “semplice” epatite cronica. Tale condizione sarebbe dovuta allo stimolo procancerogeno sostenuto dalle condizioni costituenti la stessa sindrome: il diabete in primis!
Come si fa la diagnosi di NAFLD? A. B. C. D. E. Ecografia Biopsia epatica Marcatori ematici RMN Fibroscan CAP?
DIAGNOSI Anamnesi, EO, misurazione indici antropometrici Prelievi ematochimici: insulinemia, The Homeostasis Model Assessment (HOMA), colesterolemia, trigliceridemia, glicemia a digiuno, ecc Ecografia epatica: metodica non proprio eccezionale a causa della scarsa sensibilità e dell’operatore dipendenza RM: consente una definizione precisa della presenza del grasso epatico ma non differenzia la steatosi dalla steatoepatite Analisi CAP: software annesso ad un apparecchio chiamato “Fibroscan”. Consente un’analisi specifica per la presenza del grasso epatico Biopsia: attualmente l’unica possibilità reale per porre diagnosi di steatoepatite
MODELLI PREDITTIVI SEMPLICI DI PROGRESSIONE AST/ALT ratio • AST/ALT > 1 suggerisce fibrosi avanzata non distingue tra steatosi semplice e NASH BMI, AST/ALT Ratio e Diabete - BARD score • combinazione di 3 variabili (BMI ≥ 28: 1 punto; AST/ALT ratio ≥ 0. 8: 2 punti; diabete: 1 punto) solo 43% di sensibilità NAFLD fibrosis score (NFS) • basato su età, iperglicemia, BMI, piastrine, livello di albumina e AST/ALT ratio • una grande percentuale cade nella categoria indeterminata FIB 4 index • basato su età, piastrine e livelli di AST e ALT
MODELLI PREDITTIVI COMPLESSI DI PROGRESSIONE Enhanced Liver Fibrosis – ELF panel • INCLUDE 3 biomarkers (acido ialuronico, tissue inhibitor della metalloproteinasi-1 e N teleopeptide del collageno III) • ELF panel + NAFLD score aumenta l’accuratezza diagnostica Fibrotest • INCLUDE 5 biomarkers (GGT, bilirubina, aptoglobina, α 2 macroglobulina e apo-lipoproteina A) • sensibilità e specificità: 77%
LIVER BIOPSY IL RUOLO DELL’ ISTOLOGIA
RUOLO DELLA BIOPSIA EPATICA NELLA NAFLD A FAVORE CONTRO Ø Esclude altre cause di malattia epatica Ø Prognosi generalmente buona Ø Distingue la NAFL dalla NASH Ø Mancanza di terapia specifica Ø Stima la prognosi Ø Rischio e costi associati Ø Valuta la progressione della malattia
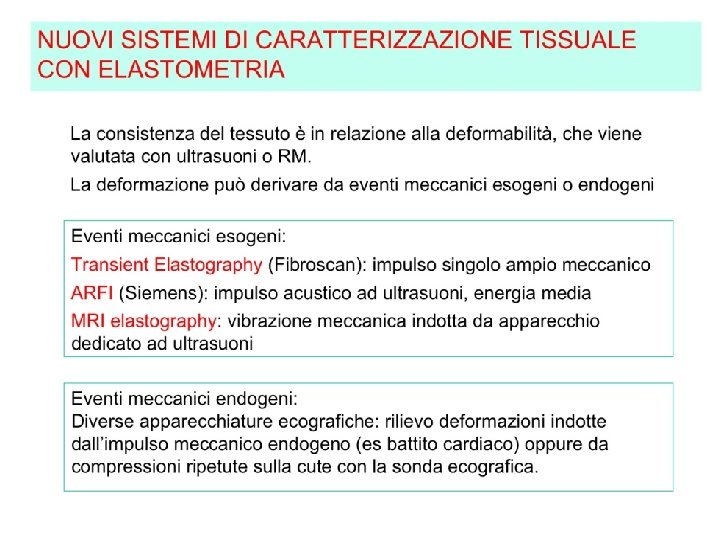
• • • US is the preferred first-line diagnostic procedure for imaging of NAFLD, as it provides additional diagnostic information (A 1) Whenever imaging tools are not available or feasible (e. g. large epidemiological studies), serum biomarkers and scores are an acceptable alternative for the diagnosis of steatosis (B 2) A quantitative estimation of liver fat can only be obtained by H-MRS. This technique is of value in clinical trials and experimental studies, but is expensive and not recommended in the clinical setting (A 1) NASH has to be diagnosed by a liver biopsy showing steatosis, hepatocyte ballooning and lobular inflammation (A 1) Biomarkers and scores of fibrosis, as well as transient elastography, are acceptable noninvasive procedures for the identification of cases at low risk of advanced fibrosis/cirrhosis (A 2). The combination of biomarkers/ scores and transient elastography might confer additional diagnostic accuracy and might save a number of diagnostic liver biopsies (B 2)
• • Monitoring of fibrosis progression in clinical practice may rely on a combination of biomarkers/scores and transient elastography, although this strategy requires validation (C 2) The identification of advanced fibrosis or cirrhosis by serum biomarkers/scores and/or elastography is less accurate and needs to be confirmed by liver biopsy, according to the clinical context (B 2) In selected patients at high risk of liver disease progression, monitoring should include a repeat liver biopsy after at least 5 -year follow-up (C 2) In children, predictors of fibrosis, including elastometry, acoustic radiation force impulse (ARFI) imaging and serum biomarkers might help reduce the number of biopsies (B 2)
EASL, EASD, EASO. J Hepatol. 2016
…e se la biopsia non fosse solo una metodica diagnostica?
Fibrosis stage but not NASH predicts mortality and time to development of severe liver disease in biopsy-proven NAFLD. Hannes Hagstro m, Patrik Nasr, Mattias Ekstedt, Ulf Hammar, Per Sta l, Rolf Hultcrantz, Stergios Kechagias. J Hepatol. 2017 Aug 10. pii: S 0168 -8278(17)32202 -X. doi: 10. 1016/j. jhep. 2017. 027. Aim To investigate the long-term prognosis in a large cohort of NAFLD patients with a prolonged follow-up time, and to study the specific effect of NASH on the outcomes of mortality and liver-specific morbidity.
Materials and methods Patients: retrospective cohort study including all patients diagnosed with biopsy-proven NAFLD, at the Karolinska University Hospital, Huddinge and Linko ping University Hospital, during 1971 to 2009. Patients with other causes for steatosis than NAFLD or diagnosed with any concurrent liver disease during follow-up were excluded. Patients on treatment with drugs associated with hepatic steatosis or hepatotoxicity at the time of biopsy were also excluded. Furthermore, ten patients with a diagnosis of either HCC or decompensated liver disease at or within six months from baseline were excluded.
Materials and methods • Histopathological evaluation: Lobular inflammation and steatosis were scored on a 0 -3 scale and ballooning and portal inflammation on a 0 -2 scale. The FLIP algorithm was used to define presence of NASH. Fibrosis stage was scored according to the Kleiner classification on a 5 -point scale (F 0 -F 4). • Baseline characteristics: assessment of type 2 diabetes mellitus, hypertension; cardiovascular disease; hyperlipidaemia; smoking habits and weight. • Biochemical variables: routine biochemical variables within one month of liver biopsy were registered and included alanine and aspartate aminotransferase, albumin, bilirubin, alkaline phosphatase, and gamma-glutamyl transferase levels, complete blood count, fasting cholesterol and triglycerides, fasting glucose, autoantibodies and α 1 -antitrypsin levels. In cases with missing data, multiple imputation was used. Analysis for detection of hepatitis B surface antigen was performed in all cases and anti-hepatitis C virus (HCV) antibodies were analysed in cases evaluated after 1991 when testing became available.
Materials and methods • Control group and follow up: The personal identification number (PIN) is a unique tendigit code provided to all Swedish citizens. The PIN was first used to create a control population derived from Statistics Sweden using ten controls per case (N=6345 after exclusions). For the follow up they used outcome data from the National Patient Register of Hospital Discharges (NPR), from the Cause of Death Register (CDR) and from the Swedish Cancer Register (SCR). • Severe liver disease was defined as an ICD-code for liver failure, cirrhosis, HCC or decompensated liver disease. Decompensated liver disease was in turn defined as an ICD -code for esophageal varices (bleeding or not bleeding), ascites or hepatic encephalopathy, while liver failure was defined as having a specific ICD-code for liver failure only.
Results The cohort was followed for a mean period of 19. 9 years There was a strong collinearity between higher stages of fibrosis and higher NAS and presence of NASH, with 82% of patients with stage 4 having a NAS of 5 -8 and NASH in 94% compared to a NAS of 5 -8 in 24% and NASH in 35% in patients with stage 0 (p<0. 001, respectively). Cause of death Cases, N % N=646 Mortality: Controls, N % N=6345 P-value Psychiatric disorder (including suicide) 2 0. 9 85 4. 5 0. 02 Infections 4 1. 9 19 1. 0 0. 18 Kidney disease 4 1. 9 20 1. 1 0. 21 External trauma 4 1. 9 38 1. 9 0. 87 Gastrointestinal 5 2. 4 53 2. 8 0. 87 Nervous system 6 2. 8 67 3. 5 0. 76 Other 9 4. 2 130 6. 9 0. 23 Endocrine (including T 2 DM) 11 5. 1 52 2. 7 0. 02 Liver-related 17 7. 9 26 1. 4 <0. 001 Respiratory disease 18 8. 4 121 6. 4 0. 13 Extrahepatic malignancy 55 25. 7 544 28. 6 0. 96 Cardiovascular 79 36. 9 748 39. 3 0. 74 Total 214 33. 1 1903 30. 0 0. 1
Results Compared to controls • The entire group of NAFLD patients showed a trend towards higher risk for mortality than controls (HR 1. 14, 95%CI 0. 99 -1. 32, p=0. 07): Patients with fibrosis stage 0 (HR 0. 86, 95%CI 0. 65 -1. 16, p=0. 33) and stage 1 (HR 0. 88, 95%CI 0. 70 -1. 12, p=0. 30) did not have an increased mortality, while patients with stage 2 (HR 1. 36, 95%CI 1. 021. 80, p=0. 03), stage 3 (HR 2. 54, 95%CI 1. 79 -3. 60, p<0. 001) and stage 4 (HR 5. 19, 95%CI 3. 06 -8. 79, p<0. 001) did with increasing HR: s per stage of fibrosis. Patients with NASH had a slight increase in overall mortality (1. 22, 95%CI 1. 02 -1. 46, p=0. 03). • Using NAFLD cases with fibrosis stage 0 as controls, and adjusting for age, sex and T 2 DM, a significant increase in mortality was seen for patients with fibrosis stage 3 (HR 1. 76, 95%CI 1. 02 -3. 06, p=0. 04) and stage 4 (HR 3. 75, 95%CI 1. 81 -7. 73, p<0. 001). Adding presence of NASH to the model with fibrosis stage as the independent variable did not add to the predictive capacity of the model for any stage of fibrosis (LR test p > 0. 05 for each stage of fibrosis), while adding information on fibrosis stage significantly improved the model with NASH as an independent variable (LR test p<0. 001).
Results Overall mortality stratified on fibrosis stage compared to matched controls. Log-rank test p�. 001
Results Development of severe liver disease stratified on fibrosis stage compared to matched controls. Logrank test p �. 001.
Results Laplace regression revealed that the time until the first 10% of the patients had developed severe liver disease was 30. 5 years in F 0 (95%CI 21. 5 -39. 6), 35. 6 years in F 1 (95%CI 25. 6 -45. 4), 19. 4 years in F 2 (95%CI 9. 3 - 29. 5) and 6. 0 in F 3 (95%CI 2. 3 -9. 6). The time until 10% of the patients had developed liver decompensation was 33. 4 years for F 0 (95%CI 24. 2 -42. 6), 34. 1 years for F 1 (95%CI 25. 1 -43. 2), 22. 7 years for F 2 (95%CI 13. 7 -31. 7), 11. 8 years for F 3 (95%CI 4. 3 -19. 4) and 5. 6 years for F 4 (95%CI 0. 9 -10. 3). There was no significant difference in the number of severe liver disease cases in patients without and with NASH (9. 8% vs. 12. 8%, p=0. 29). Cases with NAFLD were significantly more likely than controls to develop severe liver disease (HR 4. 25, 95%CI 3. 09 -5. 84, p<0. 001), and fibrosis stage was highly predictive of this.
Conclusions 1. After a follow-up time of up to 40 years, presence of NASH did not affect the longterm outcome of NAFLD significantly. 2. Patients with lower stages of fibrosis (stage 0 -1) had the potential to progress to severe liver disease and this occurred in roughly 7% of these patients, independent of presence of NASH. 3. The lower end of the 95% CI for the 10 th percentile of liver decompensation was 0. 9 years in manifest cirrhosis (5. 6, 95%CI 0. 9 -10. 3). The lower end of the 95% CI for the 10 th percentile of time to severe liver disease was 2. 3 years in F 3 (6. 0, 95%CI 2. 3 -9. 6), 9. 3 years in F 2 (19. 4, 95%CI 9. 3 - 29. 5) and around 22 -26 years in F 0 -1 (30. 5 years in F 0, 95%CI 21. 5 -39. 6, and 35. 6 years in F 1, 95%CI 25. 6 -45. 4). 4. Although patients with NASH seemed to have a small increase in risk for overall mortality and liver-specific morbidity in univariate analyses compared to a reference population, this was generally not significant when adjusting for confounders including fibrosis stage, and no added risk was seen for presence of NASH after adjusting for confounders. Furthermore, in patients with similar stages of fibrosis, presence of NASH did not affect the estimates in any specific manner.
Punti di forza e limitazioni Pro: - Ampia popolazione studiata; - Diagnosi ottenuta con biopsia esaminata dallo stesso patologo esperto per ridurre i bias di interpretazione dei quadri istologici; - Ampio follow-up; - Elevata affidabilità delle informazioni ottenute dai registri svedesi.
Punti di forza e limitazioni Contro: - Il 12% della popolazione studiata aveva una fibrosi avanzata (F 3 -4), percentuale superiore rispetto a quella della popolazione generale; - Non sono stati ottenuti dati individuali dei pazienti attraverso un’analisi diretta ed inoltre le variabili valutate al baseline non sono state prese in considerazione durante il follow-up.