Chapter 2 Personality Assessment Measurement Research Design Psychometrics


 Jane Loevinger")

 1 2 3 4")


 Socially Desirable Responding SDR")
 ■ SDR is not one thing, but two: ■ They correspond")


 Effect of Aggregation Across Observers on Heritability Estimates")
 Effect of Aggregation Across Observers on Heritability Estimates")


 • Dominance, gender & leadership • Pre-tested M and F on")
 “Actometer”")


 • PET • 9 low (I),")
")
 • Measured “self-transcendence” • Measured serotonin")


 ap-perception (away from + perception) \"assimilation of perception by prior")


")
")


 Case Study 2) Correlational 3) Experimental")

 • Anna O (Freud & Breuer, 1895)")


 1) 2) 3) 4) Interpersonal circumplex")


 r =.")
 Maltreatment in childhood r=. 05 r =. 42 MAO 9 0. r=")


 • How does arousal influence memory? •")
 • High extraversion = LOW brain arousal • Low extraversion")
 Ex tra ve rts Int rov ert")


 • effect size was equivalent to r =. 40")


- Slides: 99
Chapter 2 Personality Assessment, Measurement, & Research Design
Psychometrics & Personality ■ Individual differences psychology is closely linked to psychometrics • Correlation Coefficient • Factor analysis • Construct Validity • Test construction (1900) (1930) (1950) (1960 s)
Primary Measurement Issues 1. Where we get our information about personality, i. e. , our data sources. 2. How we evaluate our data quality. 3. How we use personality measurements in data analysis procedures to… 4. Address different research questions with different research designs.
Data Sources: LOTS of data L Life outcome data O Observer reports T Test data S Self-reports
Sources of Personality Data Self-Report The information a person reveals about her/himself in…. Questionnaires Interviews
Sources of Personality Data Self-Report • Unstructured “I am ______” EXAMPLE: “ 20 Statements. Test” I am___________ I am______
Sentence Completion Blanks Washington University Sentence Completion test of Ego -Maturity (WUSCTED) Jane Loevinger 1) At times she worried about ______ 2) The thing I like about myself is______ 3) I am_________ • Content coding procedure (requires training)
Structured tests I am devious. T F To be famous. 123456789 Types of Response formats: Check list True-False Likert
“Likert Scale” I am kindhearted. To be famous. (Likert, 1932) 1 2 3 4 5 123456789
Sources of Personality Data Self-Report Experience Sampling: - Beepers, cellphones, daily diary Mc. Clelland (1980) • Affiliation study • Compare TAT vs Questionnaire • Outcome variable = Freq of affiliating • Result: Both TAT & Ques. predicted
Sources of Personality Data Self-Report Ø Strength: Individuals have access to a wealth of information about themselves Ø Weakness: Respondents must ØImpression management ØSelf-deception be honest
Del Paulhus (UBC) Socially Desirable Responding SDR
Paulhus (1984; 2008) ■ SDR is not one thing, but two: ■ They correspond to 2 kinds of social value: agentic, communal Agentic bias • Look competent, powerful, superior Communal bias • Look kind, trustworthy, loyal
Agency and Communion
SDR IMPRESSION MANAGEMENT Agentic image Communal image SELF DECEPTION Asset Exaggeration Deviance Of Denial
Acquiescence l Yea-saying and Naysaying Agreeing regardless of content Disagreeing regardless of content l Solution: Balance wording direction l Controversial because reverse-keyed items sometimes have weaker validity than affirmative worded items.
Sources of Personality Data ■ Observer Report Data • Unique access to some data • Data aggregation across observers Cancel idiosyncratic biases Improve reliability & validity
Reiman et al. (1997) Effect of Aggregation Across Observers on Heritability Estimates
Reiman et al. (1997) Effect of Aggregation Across Observers on Heritability Estimates
Sources of Personality Data ■ Observer Report Data • Types of observers: • Professional (eg IPSR) +trained to assess reliably and validly • Intimate observers (eg roommate) +access to natural behavior +multiple vantage points (spouse, parents)
Sources of Personality Data Observer Report Data Naturalistic vs. Artificial Observation Ø Immediate vs. Retrospective Observation Ø Molar vs. Molecular Units of Observation. Ø
Sources of Personality Data Test Data Ø Participants are placed in a standardized testing situation Procedures are designed to elicit behaviour difficult to observe in everyday life. Ø
Example: Megargee (1969) • Dominance, gender & leadership • Pre-tested M and F on dominance • Groups=MM, FF, MF, FM (H/L dom) • Contrived leadership task "fix the box " task "assign your own leader". . . result: • MM: Leader was Dom (75% of time) • MF: Leader was M (80% of time) MF: Dom F chose leader! ( chose M)
Sources of Personality Data Test Data Mechanical Recording Devices Buss et al. (1980) “Actometer” study 1) Do measures converge? (ratings, actometer data) 2) Is activity-level stable over time? 3) Does actometer predict psychological functioning?
Sources of Personality Data Test Data Physiological Data…
Functional MRI
Positron Emission Tomography
Neuroscience of extraversion ■ Johnson et al. (1999) • PET • 9 low (I), 9 high (E) • resting state only ■ RESULTS • Thalamus • Insula • Broca’s Area I: ↑ Anterior, E: ↑ posterior I > E ( talking to yourself !!)
Neuroscience of spiritual feelings Borg et al. (1999)
Neuroscience of spiritual feelings Borg et al. (1999) • Measured “self-transcendence” • Measured serotonin receptor density Conclusions • Weak serotonin binding • Weak gating of sensory stimuli [? ]
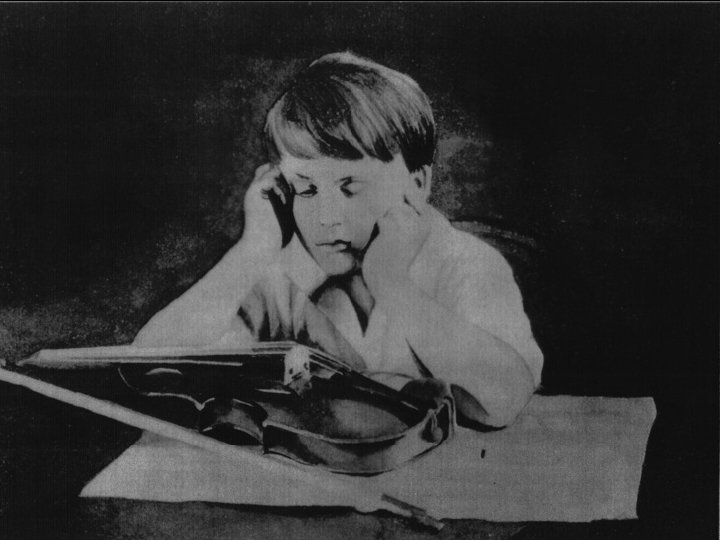
Sources of Personality Data Test Data Mechanical Recording Devices Physiological Data Projective Tests
Rorshchach
Rorschach
Thematic Apperception Test (TAT) ap-perception (away from + perception) "assimilation of perception by prior knowledge" • Created 1930 s by Christiana Morgan and Henry Murray • "Tell a story" • Analyzed for motivational themes (n=need): n. Achieve, n. Power, n. Affiliation, n-Intimacy
2000
Rorschach? -No. TAT? -Yes.
Sources of Personality Data Life-Outcome Data Information that can be gleaned from the events, activities, and outcomes in a person’s life.
Motor Vehicle Accident Death rate per 10, 000
Bad-tempered Boys Outcomes ■ Caspi, Elder, Bem (1989)
Shy Boys' Outcomes ■ Caspi, Elder, Bem (1989)
Evaluating Measure Quality Reliability How trustworthy is the score? Test-Retest Reliability Split Half Reliability Alternate Forms Internal Consistency Coefficient Alpha
Why so many similar statements? ■ EPQ Extraversion Scale • 30 statements! ■ Answer: improve reliability Aggregation Reduce error variance Increase Signal/Noise ratio
Effect of aggregation on Reliability
Evaluating Data Quality Reliability = trustworthiness • Say I use Shoe Size to measure IQ… • Is it a reliable test? • Yes. Measurements of Shoe Size are very stable across time and situations. • Is it a VALID test? … Nope. Validity = meaning of scores. • Do the scores truly measure thing they are supposed to be measuring?
Types of Validity
Face Validity Face validity = Whether the item content in the measure appears to be logically relevant to the underlying concept being measured. This is not a critical form of validity for a measure, but in some circumstances can be important.
Content Validity Content validity = whether the content is fully representative of all aspects of the construct being measure. The paranormal beliefs scale above has items to cover all of the primary content distinctions that had been proposed for the concept of “paranormal belief”.
■ Convergent Validity • Proof that the scores ARE associated with things they SHOULD be associated with. ■ Discriminant Validity • Proof that the scores are NOT associated with things they should NOT be associated with. Above are correlations between paranormal beliefs and various other traits.
■ Criterion Validity • Does the measure predict something that can be considered a theoretical criterion for the concept--something it should predict if the scores were measuring what they are supposed to be measuring? This example here used “known groups” as criteria: If the paranormal beliefs measure is valid, the groups here should differ in an expected pattern: Relg. fundamentalists should be lowest and “spiritualists” should be highest in paranormal beliefs.
■ Factorial Validity • Do the items all hang together--do they intercorrelate with each other in the expected manner? In other words, do the items show good “structure”? • Example: The example on the next page shows results from a factor analysis. The numbers are correlations with two “underlying factors”. All the paranormal items correlate with the same factor, (except P 07). All the fundamentalism items correlate with the other factor. These are good results. They suggest the paranormal scale items all hang together as they should, and the fundamentalism items all hang together as they should.
Factorial Validity of a Paranormal Beliefs Scale Fac 1 Fac 2
Summary of Types of Validity
Research Designs 3 Primary Types 1) Case Study 2) Correlational 3) Experimental
Research Designs Case Studies • SINGLE PERSON + More detail, more depth + Excellent for developing theory - Bad for testing theory
Influential Case Studies • Phineus Gage (1860) • Anna O (Freud & Breuer, 1895) • HM (Henry Molaison, 1953) • Mask of Sanity (Cleckley, 1941)
Dodge Morgan
● Morgan sailed alone around the world. ● Team of trait researchers did case study of Morgan. ● Numerous personality assessments done. ● Different measurement approaches were pitted against each other. ● Whole issue of Journal of Personality (1997) devoted to Morgan.
Dodge Morgan Study by Nasby & Reid (1997) 1) 2) 3) 4) Interpersonal circumplex (Wiggins) Five factor Model Life Story narratives (Costa & Mc. Crae) (D. Mc. Adams) MMPI, Clinical Assessment (J. Butcher) Each perspective provided something unique in understanding Dodge Morgan.
Research Designs ■ Correlational: Quantify covariation between things. Correlation coefficient: r – Magnitude & direction of assoc. – (Usually) cannot infer causation from correlation.
The Correlation Coefficient: • Numerical index of covariation • Ranges from: -1. 0. . to. . +1. 0 • “. 00” = no association. Q: Which correlation below is the strongest association in the list? A) -. 59 B) +. 50 C) -. 09 D) +. 34
Guess the correlation ! r Height and Weight Extrav & Happiness Consc and GPA Consc and Creativity Aspirin and Heart attack risk Neuroticism and Happiness +. 70 +. 50 +. 30 -. 20 -. 08 -. 50
3 Common Correlational Relationships: Additive, Mediator, Moderator
Additive Self-Control r =. 45 Well-being Mindfulness r =. 30
Mindfulness Mediation (M r =. 60 ED IA Self-Control TO R ) r =. 45 r =. 00 Well-being
Moderation (interaction) Maltreatment in childhood r=. 05 r =. 42 MAO 9 0. r= Antisocial
Fundamentalist Background Spiritual Belief ? Paranormal Belief
r =. 00 M Religious Fundamentalism Low High Spirituality r =. 50 Paranormal Belief ode rato r
Multiple Correlation & Regression
Personality of Video Gamers
Causal Modeling
Factor Analysis “Seeing the forests instead of the trees” • Finding broad patterns of covariation among many variables • Partitioning covariation among many measures into independent sets • Shrinking a large number of smaller variables into a small number of larger variables.
Factor a number: 15 = 3 x 5 Factor a matrix of numbers:
Intercorrelation matrix
Intercorrelation matrix 2 product matrices
Intercorrelation matrix
e. g. , We factor analyze a correlation matrix. o Yields 2 product matrices o Eigenvalues, and eigenvectors. o Eigenvectors = “factor loadings”
Intercorrelation matrix
Intercorrelation matrix 2 product matrices
Loadings Body Mental Mass Ability Factor II I
Factor Analysis ■ Many uses 1. Discovering trait dimensions Perceptual sensitivity? Curiosity? Fantasy-proneness? Liberal Values? OPENNESS TO EXPERIENCE 2. Constructing taxonomies (e. g. , Big Five)
3. Data reduction e. g. , Aggregating predictors for regression analyses 4. Test construction e. g. , Selecting questionnaire items Factor loading
Factor Analysis 5. Evaluating the factor structure of a test “Factorial validity”
Experimental Methods ■ Typical experiment • Measure a trait • Select Hi vs. Lo on the trait • Put subjects in controlled situation • Manipulate some variable(s) • Measure some outcome(s) ■ Example…
Experimental Methods: Example Howarth & Eysenck (1988) • How does arousal influence memory? • Depends if STerm or LTerm memory: “Action Decrement theory” Example: strong emotion • Short-term memory: worsens • Long-term memory: improves
Howarth & Eysenck (1988) • High extraversion = LOW brain arousal • Low extraversion = HIGH brain arousal If true… E >I I >E short-term recall long-term recall
# Words recalled Howarth & Eysenck (1988) Ex tra ve rts Int rov ert s Delay Interval
“Significance” Need to distinguish: • Statistical significance What is the statistical probability that the result was due to random error? • Practical significance Does a result of that magnitude (r =. 09) have any real world importance?
Personality of Video Gamers
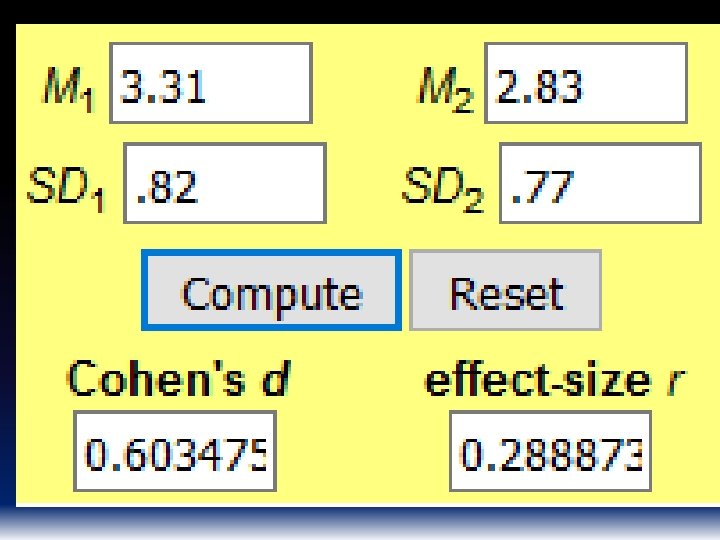
Effect Size ■ Measures of effect size 1. Magnitude of experimental effect Cohen’s d = (Group 1 – Group 2) / SD 2. Correlations are effect sizes. Can convert d to correlation.
Effect Size ■ Useful benchmarks: Large 40+ Medium 25 - 40 Small 15 - 25 ■ Example: • Milgram (1962) Obedience Study…
r =. 40
Effect Size ■ Milgram (1962) • effect size was equivalent to r =. 40 • This is one of the most well-known studies in social psychology. • Trait measures often predict important life outcomes >. 40 ■ Traits are indeed real and important.
Some Effect Sizes in Medicine: Effect sizes in personality psychology are not abysmal. A growing concern is how replicable important research findings are. Now great interest in systematic replication research in psychology.
SUMMARY • Data sources: LOTS • Data quality: Reliability and Validity • Research designs: Case study Correlational Experiment