Psychometrics Statistical Concepts PSYC 101 Dr Gregg Fall


 & group without")


2 Variance = s 2 = ----------- N Standard")


 (Independent) + constant weight =")


 =")

 P=.")

")


 -")


 • In sample,")


 Weight = 3. 3 Height - 73")


")


- Slides: 62
Psychometrics & Statistical Concepts PSYC 101 Dr. Gregg Fall, 2006
Vocabulary • Item: 1 question or task • Scale: Set of items that measure a single trait or characteristic • Test: Usually large set of items that measure one or several traits May consist of several scales or “subtests” (IQ; SAT; ACT)
Likert Scale • Item with following response forms: Strongly Agree Disagree Strongly Disagree [ ] [ ] [ ] Strongly [ ] Strongly Agree [ ] Disagree
Psychometrics: Test Design Theory-based strategy: Galton Prediction-based strategy: Binet
Psychometrics: Test Design Theory-based strategy: Create items based on theory “Some people are born with an urge to jump from high places. ”
Psychometrics: Test Design Prediction-based strategy: 1. Identify criterion group (with trait) & group without trait. 2. Select items criterion group answers differently than noncriterion group.
Psychometrics: Designing an Accurate Test Reliability: Does test consistently measure what it measures? Validity: Does test measure what it aims to measure?
Reliability Does test consistently measure what it measures? Internal consistency Test-retest reliability
Validity Does test measure what it aims to measure? Convergent Validity: Correlations with other measures of same trait. Divergent Validity: Noncorrelation with measures of different traits.
Need to Understand • Correlation • Regression • Factor Analysis Key concept: variance
Types of Variables
Types of Variables Nominal / Categorical: each value is distinct category [gender, blood type, city] Scale / Interval: linear measure, same interval between each value [age, weight, IQ, GPA, SAT, income] Ordinal: ranking, un-equal intervals between values [Likert scale, preference ranking]
Variables & Statistical Tests Variable Type Nominal by nominal Example Blood type by gender Scale by nominal GPA by gender GPA by major Scale by scale Weight by height GPA by SAT Common Stat Method Chi-square T-test Analysis of Variance Regression Correlation
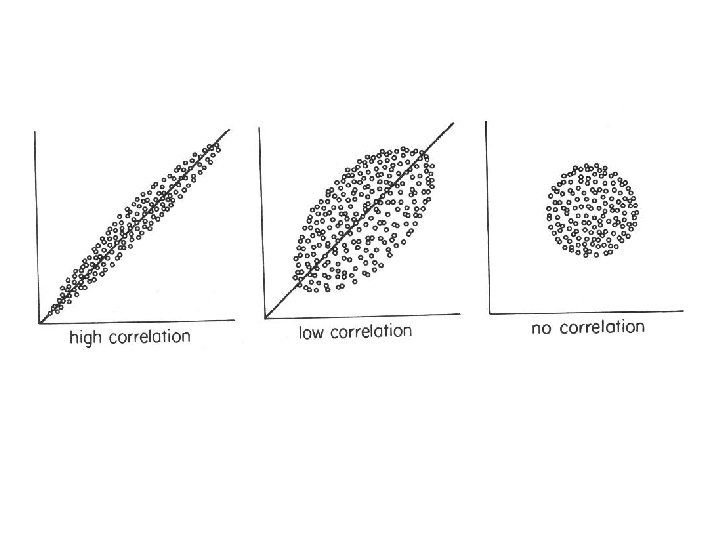
Correlation • Strength of association of scale measures • r = -1 to 0 to +1 +1 perfect positive correlation -1 perfect negative correlation 0 no correlation • Interpret r in terms of variance
Mean & Variance
Survey of Class n = 42 • • • Height Mother’s height Mother’s education SAT Estimate IQ Well-being (7 pt. Likert) • • • Weight Father’s education Family income G. P. A. Health (7 pt Likert)
Frequency Table for: HEIGHT Valid Cum Value Label Value Frequency Percent 59. 00 1 2. 4 61. 00 2 4. 8 7. 1 62. 00 3 7. 1 14. 3 63. 00 3 7. 1 21. 4 65. 00 5 11. 9 33. 3 66. 00 3 7. 1 40. 5 67. 00 4 9. 5 50. 0 68. 00 5 11. 9 61. 9 69. 00 1 2. 4 64. 3 70. 00 6 14. 3 78. 6 71. 00 1 2. 4 81. 0 72. 00 4 9. 5 90. 5 73. 00 3 7. 1 97. 6 74. 00 1 2. 4 100. 0 ------- Total 42 100. 0 Valid cases 42 Missing cases 0
Frequency Table for: HEIGHT Valid Cum Value Label Value Frequency Percent 59. 00 1 2. 4 61. 00 2 4. 8 7. 1 62. 00 3 7. 1 14. 3 63. 00 3 7. 1 21. 4 65. 00 5 11. 9 33. 3 66. 00 3 7. 1 40. 5 67. 00 4 9. 5 50. 0 68. 00 5 11. 9 61. 9 69. 00 1 2. 4 64. 3 70. 00 6 14. 3 78. 6 71. 00 1 2. 4 81. 0 72. 00 4 9. 5 90. 5 73. 00 3 7. 1 97. 6 74. 00 1 2. 4 100. 0 ------- Total 42 100. 0 Valid cases 42 Missing cases 0 Descriptive Statistics for: HEIGHT Valid Variable Mean Std Dev Variance Range Minimum Maximum N HEIGHT 67. 33 3. 87 14. 96 15. 00 59. 00 74. 00 42 mean
Variance x i - Mean )2 Variance = s 2 = ----------- N Standard Deviation = s = variance
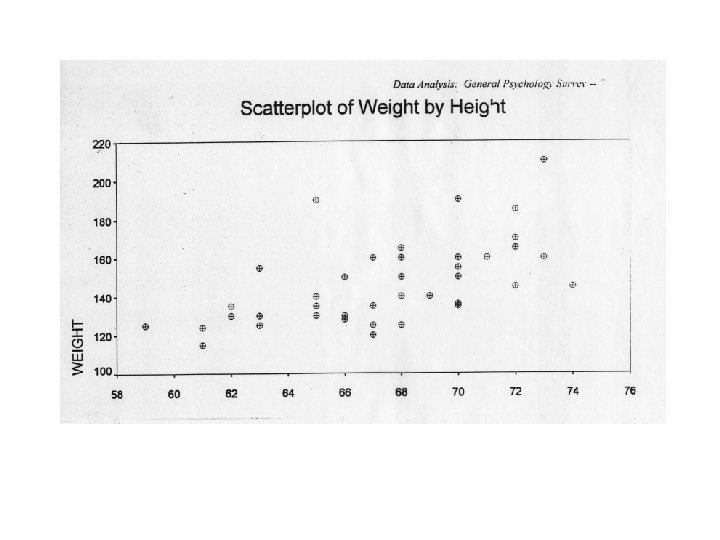
Frequency Table for: WEIGHT Valid Cum Value Label Value Frequency Percent 115. 00 1 2. 4 120. 00 1 2. 4 4. 8 124. 00 1 2. 4 7. 1 125. 00 4 9. 5 16. 7 128. 00 1 2. 4 19. 0 130. 00 6 14. 3 33. 3 135. 00 4 9. 5 42. 9 136. 00 1 2. 4 45. 2 140. 00 3 7. 1 52. 4 145. 00 2 4. 8 57. 1 150. 00 3 7. 1 64. 3 155. 00 2 4. 8 69. 0 160. 00 6 14. 3 83. 3 165. 00 2 4. 8 88. 1 170. 00 1 2. 4 90. 5 185. 00 1 2. 4 92. 9 190. 00 2 4. 8 97. 6 210. 00 1 2. 4 100. 0 ------- Total 42 100. 0 Valid cases 42 Missing cases 0 Descriptive Statistics for: WEIGHT Valid Variable Mean Std Dev Variance Range Minimum Maximum N WEIGHT 146. 38 21. 30 453. 80 95. 00 115. 00 210. 00 42 mean
Relationship of weight & height: Regression Analysis
“Least Squares” Regression Line Dependent = ( B ) (Independent) + constant weight = ( B ) ( height ) + constant
es r g e R e n i l sion
Regression: WEIGHT on HEIGHT Multiple R . 59254 R Square . 35110 Adjusted R Square . 33488 Standard Error 17. 37332 Analysis of Variance DF Sum of Squares Mean Square Regression 1 6532. 61322 Residual 40 12073. 29154 301. 83229 F = 21. 64319 Signif F = . 0000 --------- Variables in the Equation --------- Variable B SE B Beta T Sig T HEIGHT 3. 263587 . 701511 . 592541 4. 652 . 0000 (Constant) -73. 367236 47. 311093 -1. 551 [ Equation: Weight = 3. 3 ( height ) - 73 ]
e n i l on i s s e Regr 3 7 H 3. 3 W=
Strength of Relationship “Goodness of Fit”: Correlation How well does the regression line “fit” the data?
Frequency Table for: WEIGHT Valid Cum Value Label Value Frequency Percent 115. 00 1 2. 4 120. 00 1 2. 4 4. 8 124. 00 1 2. 4 7. 1 125. 00 4 9. 5 16. 7 128. 00 1 2. 4 19. 0 130. 00 6 14. 3 33. 3 135. 00 4 9. 5 42. 9 136. 00 1 2. 4 45. 2 140. 00 3 7. 1 52. 4 145. 00 2 4. 8 57. 1 150. 00 3 7. 1 64. 3 155. 00 2 4. 8 69. 0 160. 00 6 14. 3 83. 3 165. 00 2 4. 8 88. 1 170. 00 1 2. 4 90. 5 185. 00 1 2. 4 92. 9 190. 00 2 4. 8 97. 6 210. 00 1 2. 4 100. 0 ------- Total 42 100. 0 Valid cases 42 Missing cases 0 Descriptive Statistics for: WEIGHT Valid Variable Mean Std Dev Variance Range Minimum Maximum N WEIGHT 146. 38 21. 30 453. 80 95. 00 115. 00 210. 00 42 mean
e n i l ion ss e r g Re mean
Correlation: “Goodness of Fit” • Variance (average sum of squared distances from mean) = 454 • “Least squares” (average sum of squared distances from regression line) = 295 • 454 – 295 = 159 / 454 =. 35 • Variance is reduced 35% by calculating from regression line
Correlation coefficient = r r 2 = % of variance in WEIGHT “explained” by HEIGHT
Correlation: HEIGHT with WEIGHT HEIGHT WEIGHT HEIGHT 1. 0000 . 5925 ( 42) P=. 000 WEIGHT . 5925 1. 0000 ( 42) P=. 000 P=.
r = . 59 r 2 = . 35 HEIGHT “explains” 35% of variance in WEIGHT
Heretibility % of variance in measures of a trait (such as height or IQ) that is “attributable to” genes
Multiple Regression • Problem: relationship of weight and calorie consumption • Both weight and calorie consumption related to height • Need to “control for” height
Multiple Regression e n i l ion ss e r g Re mean
Form of relationship -- regression line: Weight = 3. 3 ( height ) - 73 Each inch of height “adds” 3. 3 pounds of weight Strength of relationship -- correlation: r =. 59 r 2 =. 35% Height “explains” 35% of variance in weight
Statistical Significance
Statistical Significance What is the probability that the relationship observed in the sample does not exist in the universe from which the sample was drawn? What are the chances that the sample could be a “quirky” one, which doesn’t reflect the real state of affairs in the larger world?
If the probably of having drawn a “quirky, ” non-representative sample is less than 5 in 100, the finding from the sample can be said to be statistically significant. p < . 05
Stat Sig of Height–Weight Correlation ( sample n = 42 ) • In sample, r =. 59 • What are chances a sample with r =. 59 could come from a population in which there is NO correlation between height and weight?
Statistical Significance • Need to know: distribution of possible samples of 42 from population in which height and weight are NOT correlated: Sampling Distribution • Is probability of drawing a sample in which r =. 59 less than. 05? • r =. 59 p <. 001
Distinguish Between • Relationship -- slope of regression line • Strength of the relationship – “goodness of fit” -- % of variance explained • Statistical significance p <. 05
es r g e R e n i l sion
Height and Weight • Relationship (regression line) Weight = 3. 3 Height - 73 • Strength of relationship (correlation) r =. 59 r 2 =. 35 35% variance “explained” • Statistical significance p <. 001 ( p <. 05 )
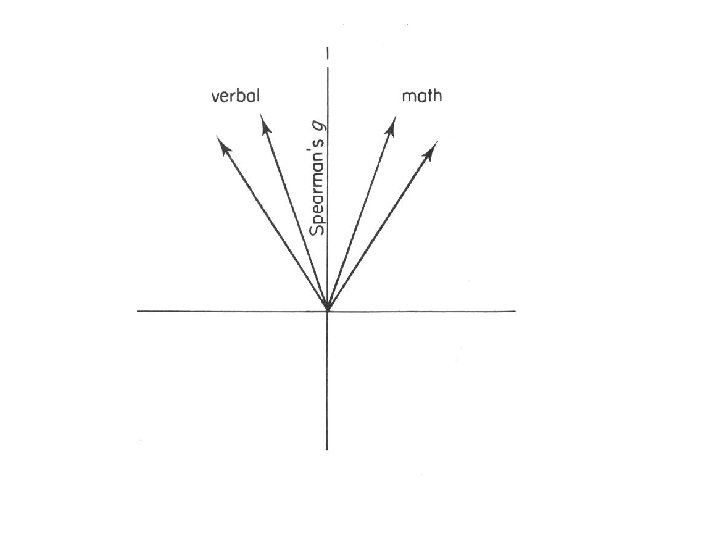
Factor Analysis Charles Spearman
Charles Spearman Believed IQ inherited Eugenics advocate Created factor analysis: Showed intercorrelation among Binet’s sub-tests Two-factor theory: g + s-s
Survey of Class n = 42 • • • Height Mother’s height Mother’s education SAT Estimate IQ Well-being (7 pt. Likert) • • • Weight Father’s education Family income G. P. A. Health (7 pt Likert) How many pieces of cherry pie could you eat if you had to?
Height Father Height Mother Height Weight Pieces Father Educ Mother Educ G. P. A. S. A. T. I. Q. Income Health Happy 1. 0 . 36* . 57*** . 59** . 57*** . 20 . 05 . 04 . 21 . 25 -. 09 . 06 . 10 F Height 1. 0 . 30 . 05 . 16 . 23 . 08 . 25 . 38* . 37* -. 04 -. 40* -. 01 M Height 1. 0 . 19 . 29 . 08 . 003 . 05 . 001 . 09 -. 23 -. 10 . 03 Weight 1. 0 . 54*** -. 06 -. 10 -. 02 . 04 . 05 -. 07 . 16 -. 09 Pie 1. 0 . 16 . 19 . 03 . 25 . 35* . 03 . 21 -. 02 F Educ 1. 0 . 62*** -. 21 -. 02 . 10 . 29 -. 32* -. 06 M Educ 1. 0 -. 07 . 06 . 23 . 30 . 005 . 22 G. P. A. 1. 0 . 63*** . 51*** -. 19 . 13 . 10 S. A. T. 1. 0 . 67*** -. 22 . 15 . 28 I. Q. 1. 0 -. 14 . 25 . 19 Income 1. 0 -. 15 -. 23 Health 1. 0 . 36* Happy 1. 0 Height
Weight Pieces G. P. A. S. A. T. I. Q. Health Happy Height . 59** . 57*** . 04 . 21 . 25 . 06 . 10 Weight . 54*** -. 06 -. 10 . 05 . 16 -. 09 Pieces . 03 . 25 . 35* -21 -. 02 G. P. A. . 63*** . 51*** . 13 . 10 S. A. T. . 67*** . 15 . 28 I. Q. . 25 . 19 Health . 36*
Weight Pieces G. P. A. S. A. T. I. Q. Health Happy Height . 59** . 57*** . 04 . 21 . 25 . 06 . 10 Weight . 54*** -. 06 -. 10 . 05 . 16 -. 09 Pieces . 03 . 25 . 35* -21 -. 02 G. P. A. . 63*** . 51*** . 13 . 10 S. A. T. . 67*** . 15 . 28 I. Q. . 25 . 19 Health . 36*
Three Factors • “Size” • “Smarts” • “Good Life”
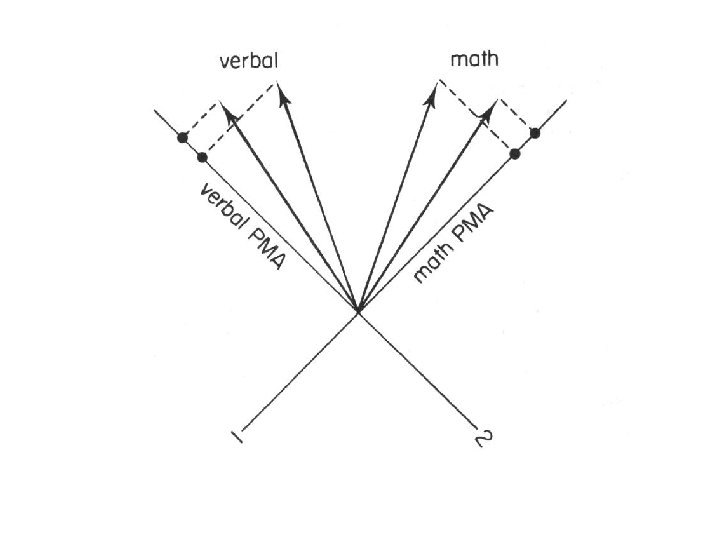
Lewis Thurstone Invented factor rotation technique Found 7 factors – “Primary Mental Abilities”
Thurstone: Primary Mental Abilities • • Verbal comprehension Word fluency Computational ability Spatial visualization Associative memory Perceptual speed Reasoning
Theories of Intelligence Single • • • Galton Cattell Goddard Terman Spearman Herrnstein & Muray Multiple • Binet • Thurstone • Gardner
David Wechsler Developed W. A. I. S. (Wechsler Adult Intelligence Scale)
W. A. I. S.
W. A. I. S.