
HELLENIC STATISTICAL AUTHORITY ELSTAT Population and Housing Census

- Slides: 9
HELLENIC STATISTICAL AUTHORITY - ELSTAT Population and Housing Census Special bilateral event and Workshop ELSTAT – Statistics Poland Piraeus, 29 March 2019 Population and Labour Market Statistics Division Censuses and Population Status Section Panagiota Poziou
2 2011 Population census Resident population of Greece with Polish citizenship www. statistics. gr
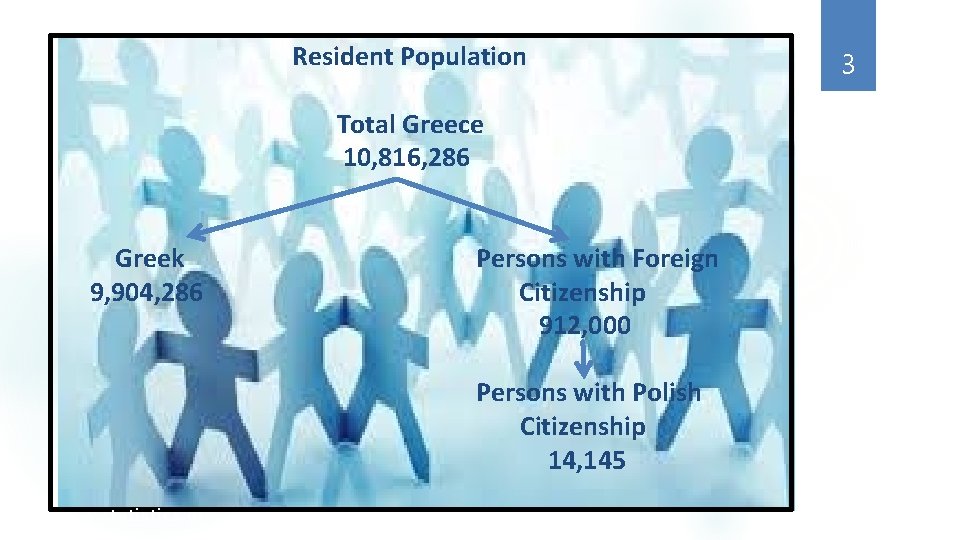
Resident Population Total Greece 10, 816, 286 Greek 9, 904, 286 Persons with Foreign Citizenship 912, 000 Persons with Polish Citizenship 14, 145 www. statistics. gr 3
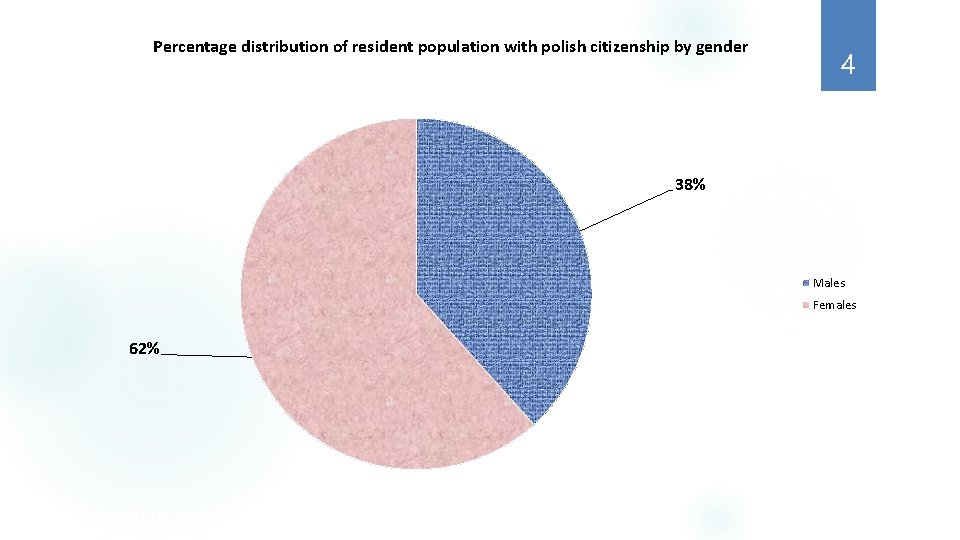
Percentage distribution of resident population with polish citizenship by gender 4 38% Males Females 62% www. statistics. gr
Age Pyramid of the resident population with Polish citizenship MALES FEMALES 80+ 75 -79 70 -74 65 -69 60 -64 55 -59 50 -54 45 -49 40 -44 35 -39 30 -34 25 -29 20 -24 15 -19 10 -14 5 -9 0 -4 1500 www. statistics. gr 1000 500 1000 1500 5
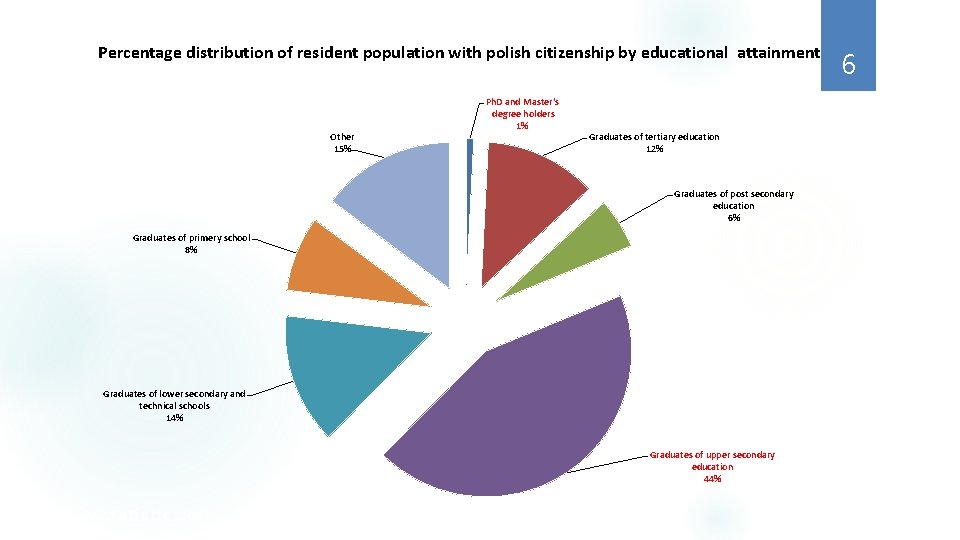
Percentage distribution of resident population with polish citizenship by educational attainment Other 15% Ph. D and Master's degree holders 1% Graduates of tertiary education 12% Graduates of post secondary education 6% Graduates of primery school 8% Graduates of lower secondary and technical schools 14% Graduates of upper secondary education 44% www. statistics. gr 6
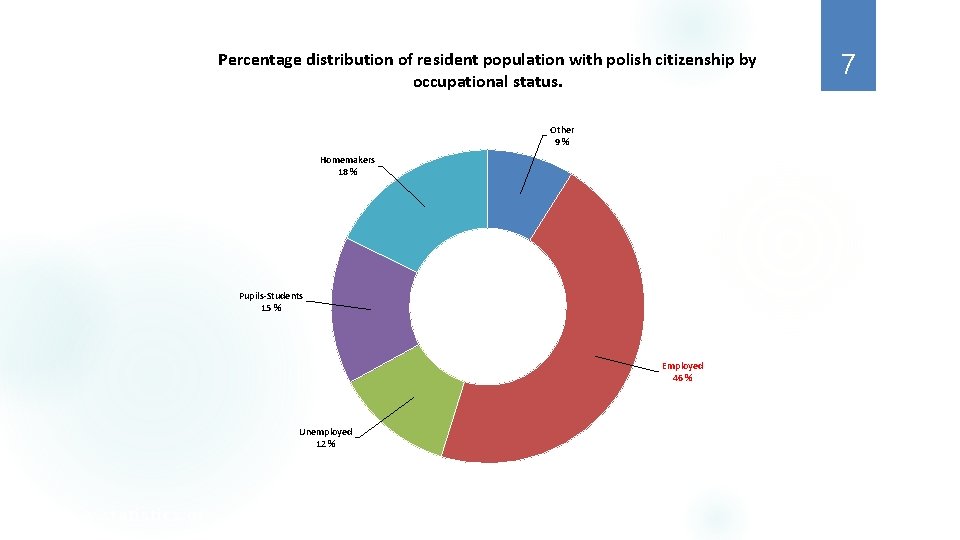
Percentage distribution of resident population with polish citizenship by occupational status. Other 9% Homemakers 18 % Pupils-Students 15 % Employed 46 % Unemployed 12 % www. statistics. gr 7
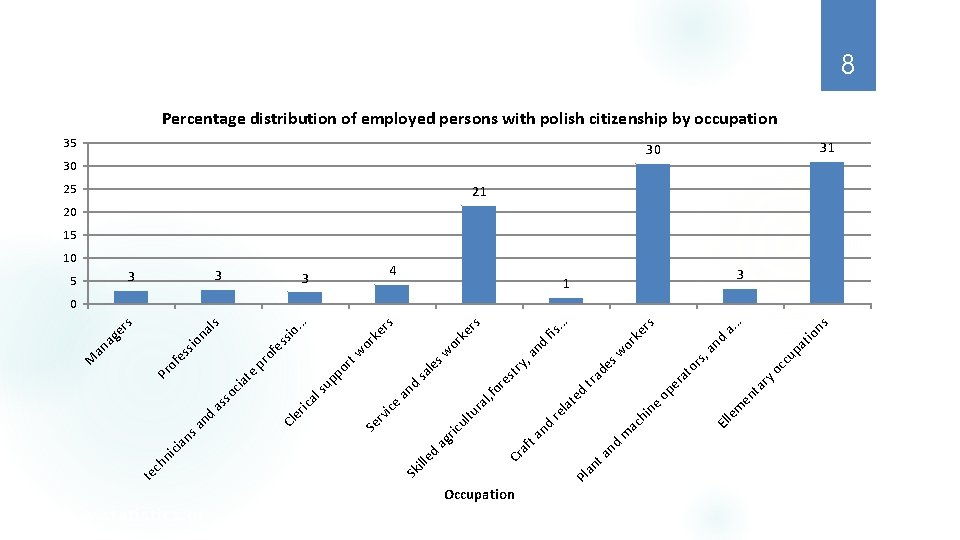
www. statistics. gr Pl Occupation nd ry ta m en oc c ns io . . a. 1 at up d an 30 le or s, rs . . . fis ke or sw de ra t op e tra d an 35 El ne d te re la hi m ac nd 4 ta an ta ry , rs ke or le sw st or e ra l, f tu ul ric ag sa 25 af Cr d d rs ke w or 3 ille an rt po up ss io. . . of e pr ls io na 3 ice ls er ica te so cia as ss 3 Cl d an of e Pr 5 Se rv ns cia ni er s ag 10 Sk ch te an M 8 Percentage distribution of employed persons with polish citizenship by occupation 30 31 21 20 15 3 0
THANK YOU FOR YOUR ATTENTION