ARMSTATEHYDROMET Satellite Data for Drought Monitoring and Agrometeorological


")
 into NDVI values comparable to the NDVI values")

 level and")

 and METOP (red )")


 was consider to determine the temperature-related")


 for FRP")
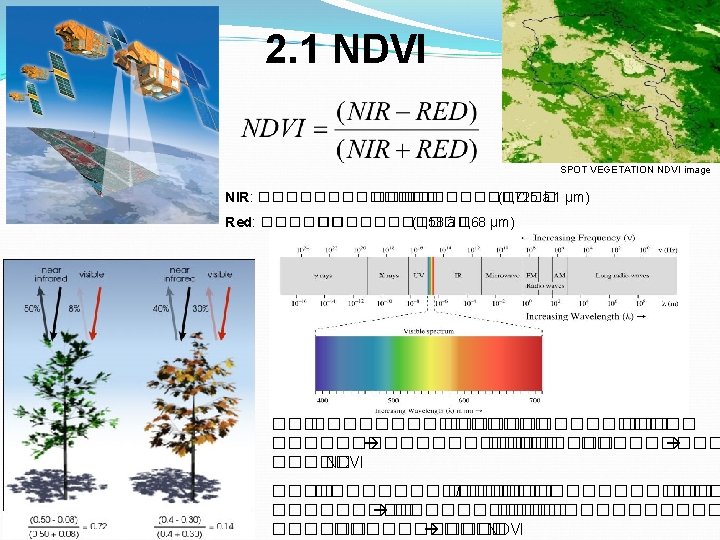
 Services • NDVI • GARI • GVI • GEMI")


- Slides: 40
ARMSTATEHYDROMET Satellite Data for Drought Monitoring and Agrometeorological Service Zara Petrosyan, Antoine Denis, Nelli Araqelyan, Susanna Shindyan, Gagik Surenyan SALGEE-3 21. 03. 2013
Climate of Armenia Annual mean air temperature over Armenia 5, 50 C; Summer average air temperature varies from 100 C in high mountainous regions to +24…+260 C in lowlands. January average air temperature depending on the altitude and peculiarity of the relief fluctuates from – 130 C to +10 C. The absolute maximum +43. 70 C(2011) The absolute minimum temperatures -420 C(1972) • The annual precipitation amount 592 In Lowland areas 250 -300 mm, in submountainous areas 300 -500 mm, mountainous areas 500 -800 mm
Expected Impacts of Climate Change on Agricultur in Armenia Less water available for irrigation and more areas may need to have irrigation systems. Reduced agricultural productivity; loss of food security for the rural poor 2 -5% of GDP lost annually in agriculture production by 2100; an additional 2 -3% of GDP lost in the food production industry annually by 2100 Decreasing water level in Lake Sevan Ecosystem damages and a loss of cultural heritage
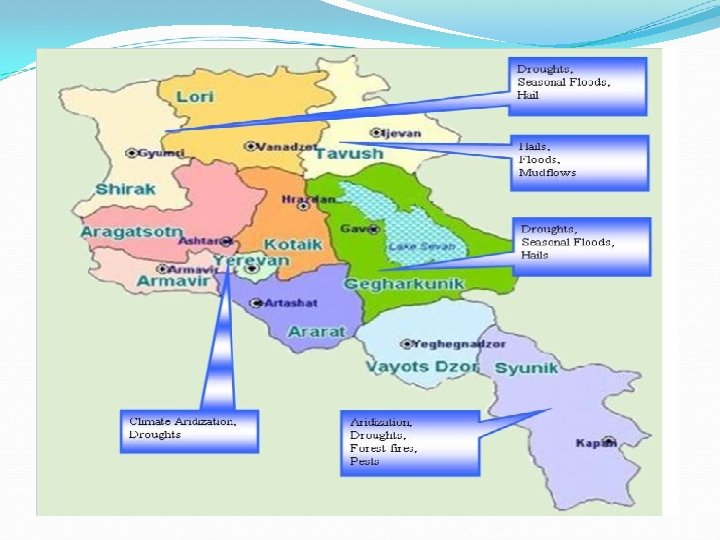
Expected Impacts of Climate Change on Agricultur in Armenia Variety of hazardous weather and climate events --droughts, floods, cold spells, heat waves, mudflows, landslides, storm winds, affect the sociowinds, socio--economic sectors and sustainable development in the region. There are several climate sensitive sectors in Armenia which shall be potential beneficiaries if accurate forecast information is provided in advance. Water resources, agriculture, natural ecosystems are among sectors which are vulnerable to even slightest change of climate.
Hydrometeorological data exchange scheme
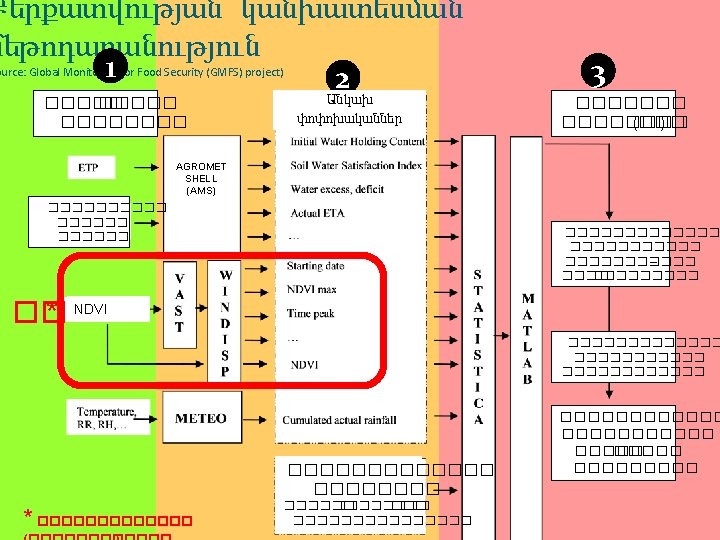
The data analyses NWP: WRF, COSMO Satellite data Statistical Methodes Synoptic Maps
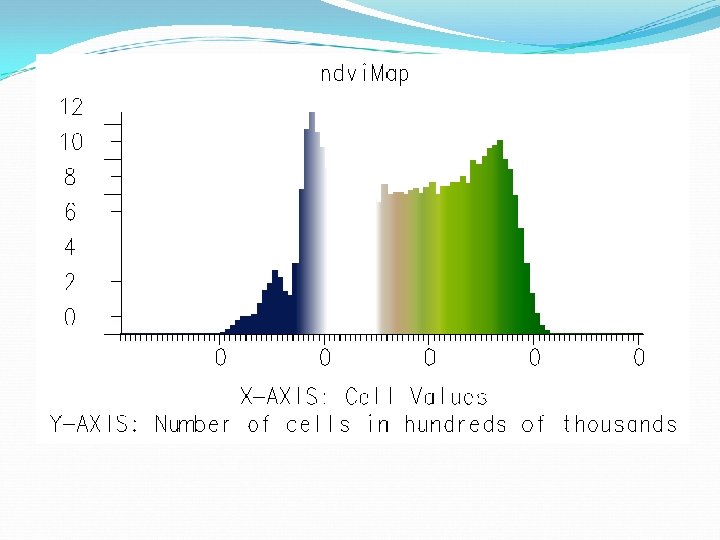
Vegetation Analysis in Space and Time NDVI time serie 12 Phenological parameters images NDVI time curve 12 Phenological parameters computation Time (decades)
Motivation SPOT Vegetation- available until 2013 is the current satellite used in Armenia for crop yield forecasting METOP NDVI- available in real time since 2009 and operational until 2022 MSG NDVI –is available in Armenia through EUMETCAST
Motivation The study was carried out to set up an alternative from existing satellite information Difficulty with Eumetcast: only 2 year of data is available in EUMETSAT archive. The process of crop yield forecast request at least ten years of historical data
Objective To determine and compare the different NDVI profiles and their phenological parameters from two sensors with the tools used in the crop yield models approach
Comparison between SPOT-VGT and METOP at pixel level (Eerens, 2011)
the DN of METOP images (DNMETOP) into NDVI values comparable to the NDVI values of SPOT VEGETATION. Based on the 2 following relations obtained by Herman Eerens: NDVIMETOP = -0. 08 + 0. 004 * DNMETOP NDVIVGT = -0. 0585 + NDVIMETOP It is easy to obtain the following relation: NDVIVGT = -0. 1385 + 0. 004*DNMETOP
Details of the computation NDVIMETOP = 0. 0585 + NDVIVGT = -0. 08 + 0. 004 * DNMETOP NDVIVGT = -0. 1385 + 0. 004*DNMETOP
Armenia : Comparison of SPOT-VGT and METOP NDVI averaged at Marz (Province) level and limited to arable lands: case of year 2008
Complementary analysis
Comparison of non-smoothed SPOT VEGETATION (green) and METOP (red )
Solution for noisy time series improvement : smoothing, in this case with simple moving average green before smoothing, red after smoothing
12 Crop phenological parameters images Examples: MAXDATE Maximum NDVI value during the year Decade of the MAX value
12 vegetation condition parameters
Viewing temporal NDVI evolution in a graph 2001 2002 Pasture 1998 -2011 Pasture
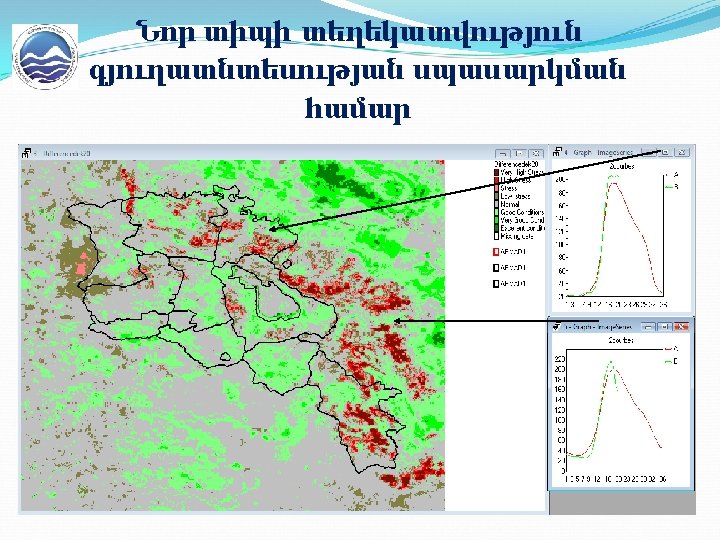
NDVI for drougt monitoring The vegetation index has been considered by numerous scientists as one of the important parameters for the mapping of agricultural fields, rainfall monitoring, estimating weather impacts, crop yield and pasture production, as well as drought conditions analyses
NDVI for drougt monitoring Vegetation Condition Index (VCI) was consider to determine the temperature-related vegetation stress and also stress caused by excessive wetness Basic assumptions: Depend on the region and also weather and ecological conditions. interpretive problems may arise when these results are extrapolated over non-homogeneous areas
VCI comparizon with presipitation ant temperature. . The study was carres out for drought assesment For the present study, NDVI and observation data of 14 years from 1998 to 2012 have been used. The index characterize the status of crop develop The (VCI) is based on the relation between the actual weekly value of NDVI and the values of NDVI that represent the best (NDVImax) and the worst (NDVImin) crop yield
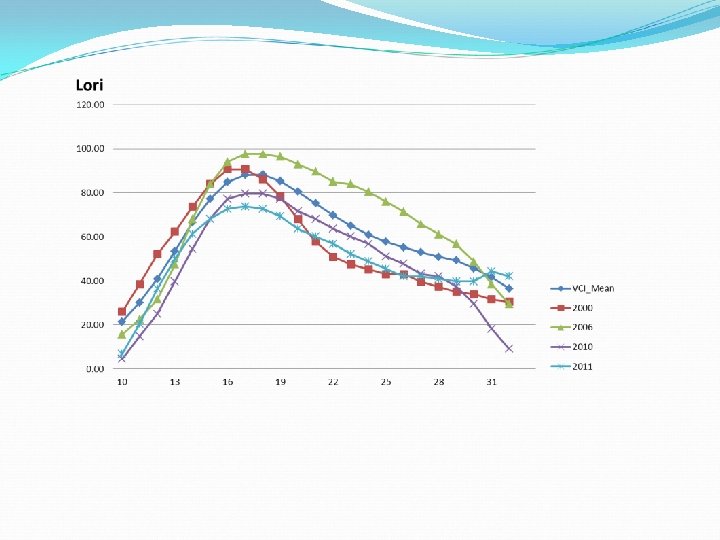
Wheat yield for years with drought conditions Dept Gegharkunik Lori Shirak Year drought normal 2000 2006 2010 2011 9. 5 12. 2 10 12 11. 6 12. 2 25. 7 16. 5 25. 6 32. 5 28. 1 28. 9
Vegetation condition index multi year average with drought condition years: 2000, 2006, 2010, 2011
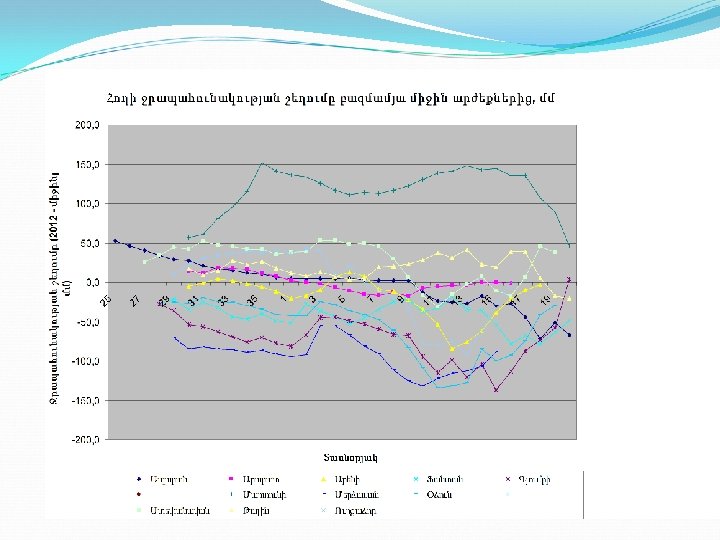
Shirak Rainfall_Devaiation Dekade 10 11 12 13 14 15 16 17 18 19 Temperature VCI 2000 2006 2010 2011 53. 42 81. 79 59. 69 73. 41 78. 34 97. 75 86. 55 8. 08 8. 01 16. 16 129. 27 60. 32 302. 54 167. 45 45. 87 13. 85 29. 07 0. 00 228. 50 128. 41 169. 57 126. 27 142. 17 215. 07 96. 21 76. 32 103. 87 253. 87 95. 76 41. 86 101. 64 94. 38 99. 24 42. 71 212. 91 9. 26 69. 46 0. 00 11. 56 48. 78 4. 1 2. 8 2. 9 -0. 4 -0. 6 0. 4 1. 6 -1. 7 0. 9 3. 1 1. 2 3. 2 -4. 6 1. 2 0. 9 1. 9 4. 7 3. 8 2. 6 -2. 3 -1 -0. 6 -1. 8 -1. 3 1. 8 -2. 2 3. 3 2 -0. 1 4 -0. 6 -1. 1 -0. 9 -0. 2 -0. 3 -0. 1 -0. 4 1. 9 3. 4 26. 3 38. 4 52. 8 66. 1 78. 1 87. 8 92. 6 90. 2 84. 2 73. 3 28. 7 38. 4 50. 4 66. 1 80. 5 90. 2 93. 8 91. 4 84. 2 79. 3 26. 5 34. 9 45. 8 59. 0 71. 1 80. 7 83. 1 77. 1 73. 5 7. 2 16. 9 27. 7 44. 6 60. 2 72. 3 79. 5 77. 1 72. 3 20 131. 30 101. 81 171. 62 383. 09 21 1. 20 44. 36 158. 09 100. 00 4. 5 5. 5 -0. 1 -0. 6 0. 9 -0. 7 -1. 8 1. 7 62. 5 52. 8 74. 5 69. 7 67. 5 61. 4 65. 1 59. 0 22 120. 25 100. 15 23 26. 11 21. 09 24 50. 63 140. 54 25 22. 99 29. 77 26 34. 38 215. 26 12. 08 85. 84 7. 69 44. 00 19. 35 0. 7 1. 8 2. 2 4. 6 4. 2 2. 4 -1. 6 1. 5 2 0. 3 4. 7 1. 6 0. 8 0. 1 -2. 3 -0. 4 0. 3 48. 0 44. 4 42. 0 40. 8 39. 6 64. 9 60. 1 55. 2 51. 6 49. 2 55. 4 51. 8 47. 0 42. 2 38. 6 54. 2 51. 8 48. 2 44. 6 41. 0 27 170. 44 98. 66 65. 32 90. 99 28 40. 62 235. 80 288. 99 38. 93 29 79. 29 291. 54 169. 07 137. 21 -0. 4 -1 -3. 3 0. 2 0. 5 -2. 9 4. 1 -2. 5 -1 -1. 5 -1. 7 0 38. 4 37. 2 36. 0 48. 0 49. 2 52. 8 37. 3 38. 6 41. 0 38. 6 33. 7 30 191. 83 -3. 3 1. 3 3. 1 -2. 3 36. 0 52. 8 42. 2 26. 5 90. 86 29. 73 45. 83 90. 83 18. 94 0. 00 93. 52 14. 93
Agro Meteorological services through the websites Zara Petrosyan Armstatehydromet 34
Agro Meteorological services through the websites Development of SDI (Special Data Infrastructures) for FRP based on OSGeo standards (such as using Opengeo. Suite, Geo. Network, etc. ) Development of portal and user interfaces for FRP (using different protocols, such as WPS, WMS, etc) Satellite Image processing using open source GIS tools and packages, such as GRASS, QGIS
needed to open KML files) Services • NDVI • GARI • GVI • GEMI • SAVI • EVI • ARVI • DVI • IPVI • MSAVI 2 • PVI • SR • VARI • WDVI RED Band (e. g. http: //arpegeo. sci. am/gistestdata/sevan 3. tif ) or NIR Band (e. g. http: //arpegeo. sci. am/gistestdata/sevan 4. tif)
Role of agro meteorological service on economy Solution of environmental issues Decrease of losses (in crop yield, …) Land management Planning of activities
Agro Meteorological services through the website Zara Petrosyan Armstatehydromet 39